. 2017 Mar 24:7:44992.
doi: 10.1038/srep44992.

Molecular heterogeneity in major urinary proteins of Mus musculus subspecies: potential candidates involved in speciation

Affiliations

Molecular heterogeneity in major urinary proteins of Mus musculus subspecies: potential candidates involved in speciation

Jane L Hurst et al. Sci Rep. .

Abstract

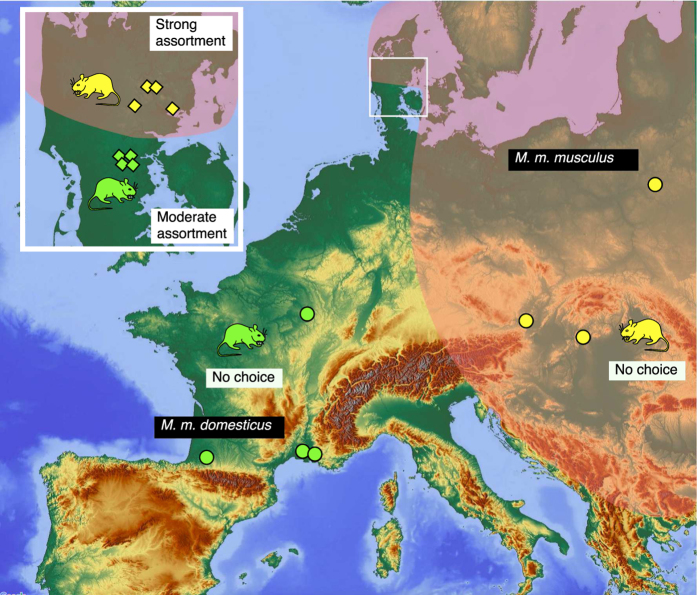
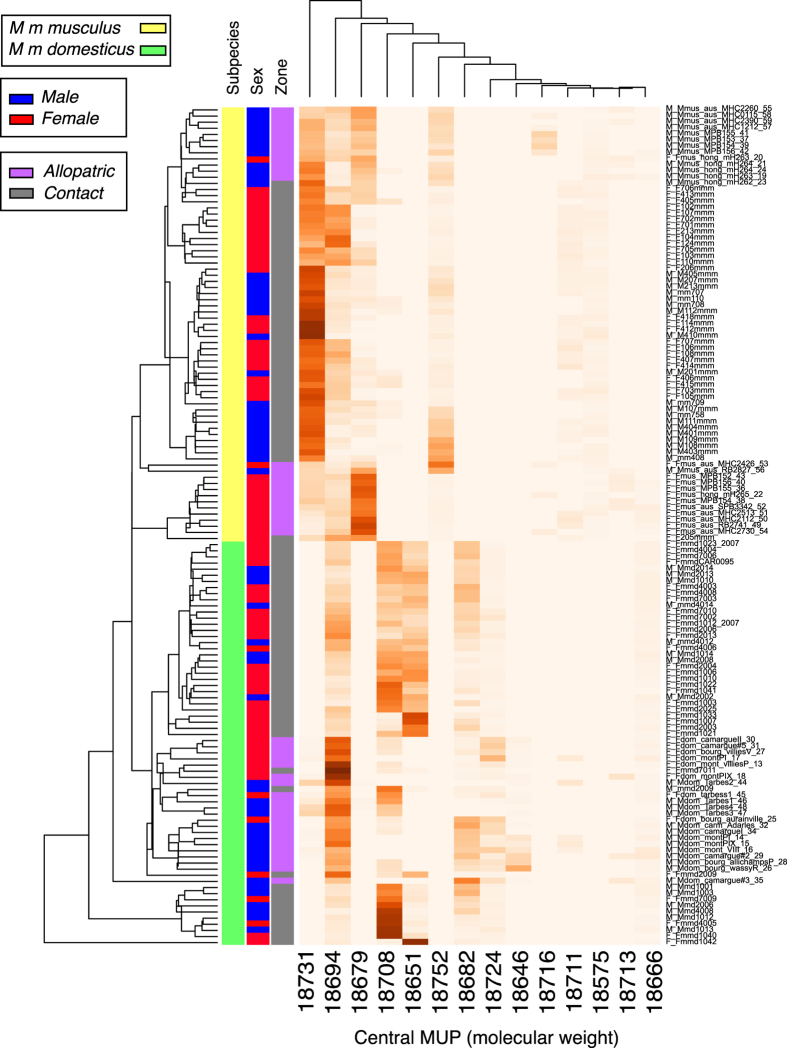
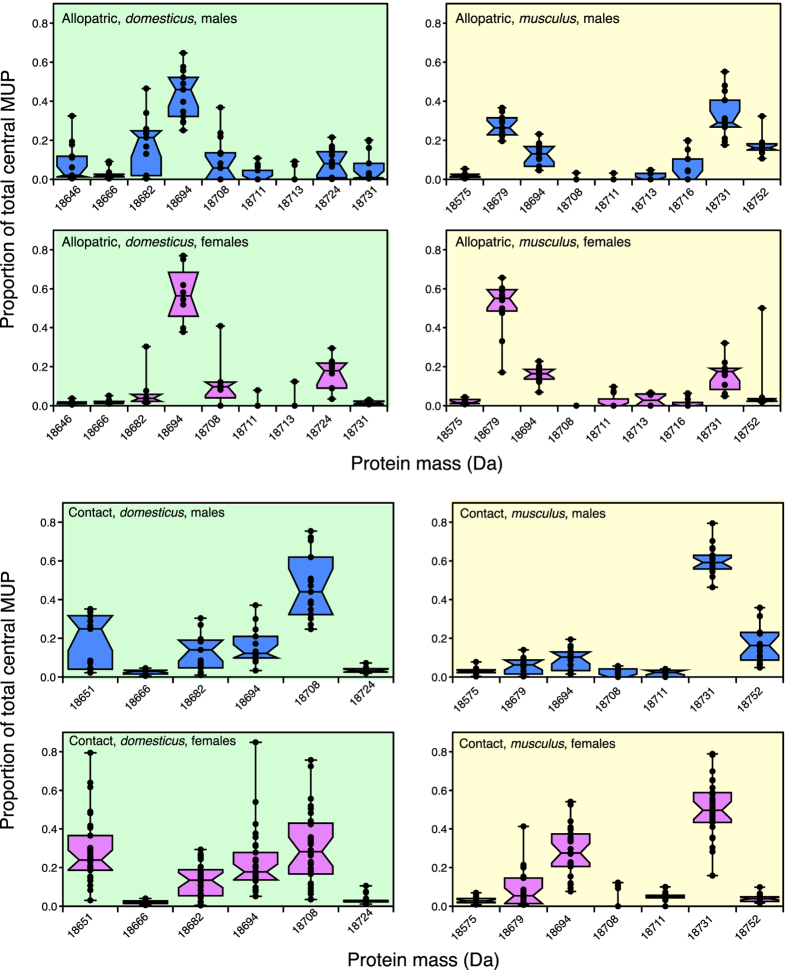
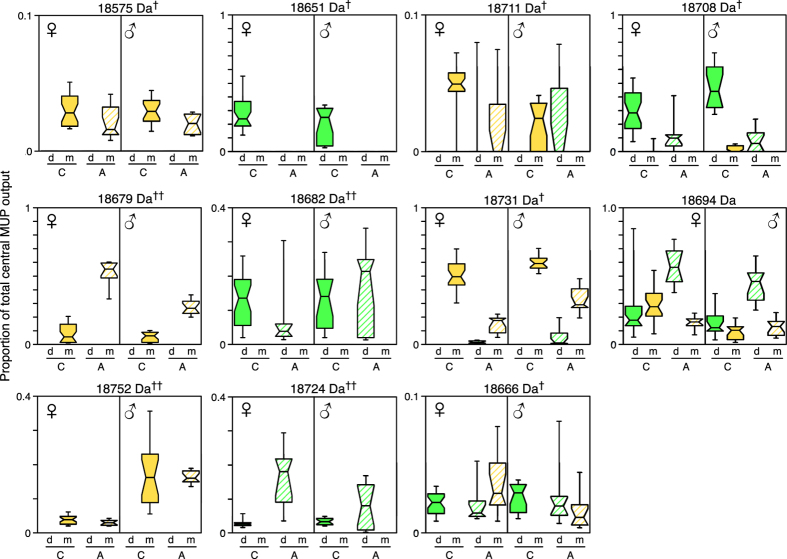
When hybridisation carries a cost, natural selection is predicted to favour evolution of traits that allow assortative mating (reinforcement). Incipient speciation between the two European house mouse subspecies, Mus musculus domesticus and M.m.musculus, sharing a hybrid zone, provides an opportunity to understand evolution of assortative mating at a molecular level. Mouse urine odours allow subspecific mate discrimination, with assortative preferences evident in the hybrid zone but not in allopatry. Here we assess the potential of MUPs (major urinary proteins) as candidates for signal divergence by comparing MUP expression in urine samples from the Danish hybrid zone border (contact) and from allopatric populations. Mass spectrometric characterisation identified novel MUPs in both subspecies involving mostly new combinations of amino acid changes previously observed in M.m.domesticus. The subspecies expressed distinct MUP signatures, with most MUPs expressed by only one subspecies. Expression of at least eight MUPs showed significant subspecies divergence both in allopatry and contact zone. Another seven MUPs showed divergence in expression between the subspecies only in the contact zone, consistent with divergence by reinforcement. These proteins are candidates for the semiochemical barrier to hybridisation, providing an opportunity to characterise the nature and evolution of a putative species recognition signal.


Conflict of interest statement

The authors declare no competing financial interests.

Figures

Figure 1
Figure 1. Geographical distribution of the two subspecies of house mice in Europe.
The sampling locations of allopatric mice (filled circles) or contact mice (diamonds, shown in boxed area in Jutland) are shown for each subspecies (green: domesticus; yellow: musculus – the same colour scheme is used for all figures). The map was downloaded from http://maps-for-free.com/ (© OpenStreetMap contributors). The cartography in the OpenStreetMap map tiles is licensed under CC BY-SA (www.openstreetmap.org/copyright). The licence terms can be found on the following link: http://creativecommons.org/licenses/by-sa/2.0/.
Figure 2
Figure 2. MUP and total urinary protein output.
(a) Total urinary protein output corrected for urine dilution, (b) creatinine as a measure of urine dilution, and (c) uncorrected urinary protein concentration for male and female adults of musculus and domesticus from contact (C) or allopatric (A) origin. (d) A representative set of samples resolved by reducing SDS-PAGE, with standard molecular weight markers indicated on the left of the gel. Sample sizes: domesticus male contact (n = 22), male allopatric (n = 13), female contact (n = 26), female allopatric (n = 8); musculus male contact (n = 18), male allopatric (n = 13), female contact (n = 31), female allopatric (n = 12).
Figure 3
Figure 3. Intact mass profiling of central MUPs according to subspecies, sex and origin.
Overall profiles of central MUPs (analysed by electrospray ionisation mass spectrometry, ESI-MS), normalised to scale 0 to 1 and averaged across individuals of the same subspecies, sex and origin (contact or allopatric). Mass peaks shared by multiple individuals are indicated by grey dashed lines, with the mass labelled at the top of the figure. The peak height of darcin (18893 and 18897 Da) is reduced because it does not produce a strong signal on the instrument used for this analysis (see text).
Figure 4
Figure 4. Molecular analysis of MUPs from Mus musculus domesticus and Mus musculus musculus.
Example urinary MUPs from both sexes of (a) domesticus and (b) musculus resolved by native gel electrophoresis, with average intact mass profiles (derived by ESI-MS) presented to the right of gel images. Each electrophoretically resolvable band (labelled A through E) was assigned to one or more MUPs by in-gel digestion, followed by peptide mass fingerprinting by MALDI-TOF mass spectrometry (see Supplementary Figs S2 and S3). The intact mass of each of these MUPs was also confirmed as present in the intact mass profiles.
Figure 5
Figure 5. Hierarchical clustering analysis of individual intact mass profiles.
Heatmap based on abundances of each central MUP mass, calculated as a proportion of the total intact mass urinary MUP profile for each individual urine sample (n = 137). The data set (protein: rows, individual animals: columns) was subjected to hierarchical clustering using the GMD package (ver 0.3.3, function heatmap 3) in R. Euclidean distances were calculated and median method applied for clustering and generating trees for both proteins and samples.
Figure 6
Figure 6. Quantitative profiling of central MUPs.
For each individual sample within each group (contact/allopatric, domesticus/musculus, male/female), each peak within the intact mass profile is expressed as a proportion of the total of all central MUP peaks in the profile. Individual values are present as black circles, superimposed on a box and whiskers plot (showing medians, 25–75% and furthest ranges). Statistical tests of differences in expression for each mass are shown in Tables 1 and 2. Sample sizes: domesticus male contact (n = 15), female contact (n = 30), male allopatric (n = 13), female allopatric (n = 8); musculus male contact (n = 19), female contact (n = 27), male allopatric (n = 13), female allopatric (n = 12).
Figure 7
Figure 7. Subspecies differences in contact versus allopatric samples.
Box and whisker plots (showing medians, 25–75% and 10–90% ranges) compare expression levels of each mass peak, as a proportion of the total of all central MUP peaks in that sample, for each mass that showed a significant difference in expression between subspecies (statistical tests shown in Table 1). C: contact samples (solid fill), A: allopatric samples (hatched fill); d: domesticus (green), m: musculus (yellow). Candidates for reinforcement; ††candidates for assortative mating (statistical tests shown in Table 2).

Similar articles

Cited by

References

    1. Butlin R. K. & Ritchie M. G. In Behaviour and evolution (eds Slater P. J. B. & Halliday T. R.) 43–79 (Cambridge University Press, 1994).
    1. Coyne J. A. & Orr H. A. Speciation (Sinauer Associates, Inc., 2004).
    1. Maan M. E. & Seehausen O. Ecology, sexual selection and speciation. Ecol Lett 14, 591–602, doi: 10.1111/j.1461-0248.2011.01606.x (2011). - DOI - PubMed
    1. Smadja C. & Butlin R. K. On the scent of speciation: the chemosensory system and its role in premating isolation. Heredity 102, 77–97 (2009). - PubMed
    1. Monti L., Genermont J., Malosse C. & Lalanne-Cassou B. A genetic analysis of some components of reprouctive isolation between two closely related species, Spodoptera latifascia (Walker) and S. descoinsi (Lalanne-Casou and Silvain) (Lepidoptera: Noctuidae). J Evol Biol 10, 121–134, doi: 1010-061X/97010121-14$1.50+0.20/0 (1997).

Publication types

LinkOut - more resources