. 2017 Mar 24:7:45197.
doi: 10.1038/srep45197.

Dissecting miRNA gene repression on single cell level with an advanced fluorescent reporter system

Affiliations

Dissecting miRNA gene repression on single cell level with an advanced fluorescent reporter system

Nicolas Lemus-Diaz et al. Sci Rep. .

Abstract

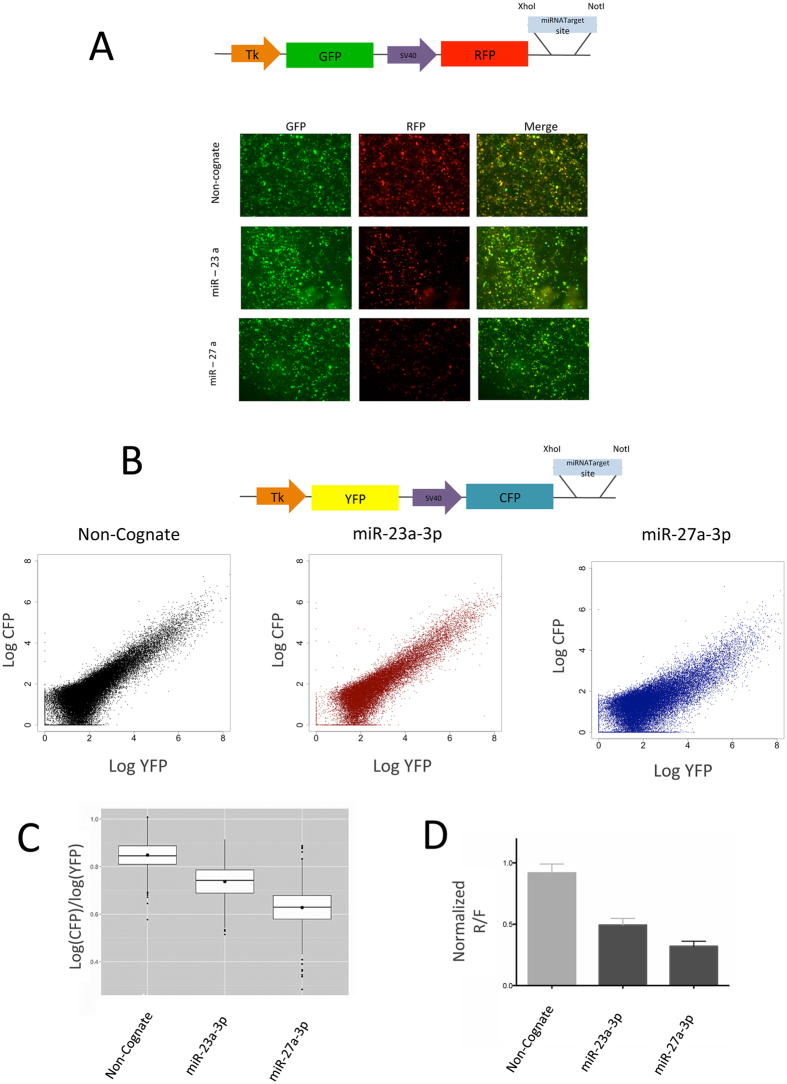
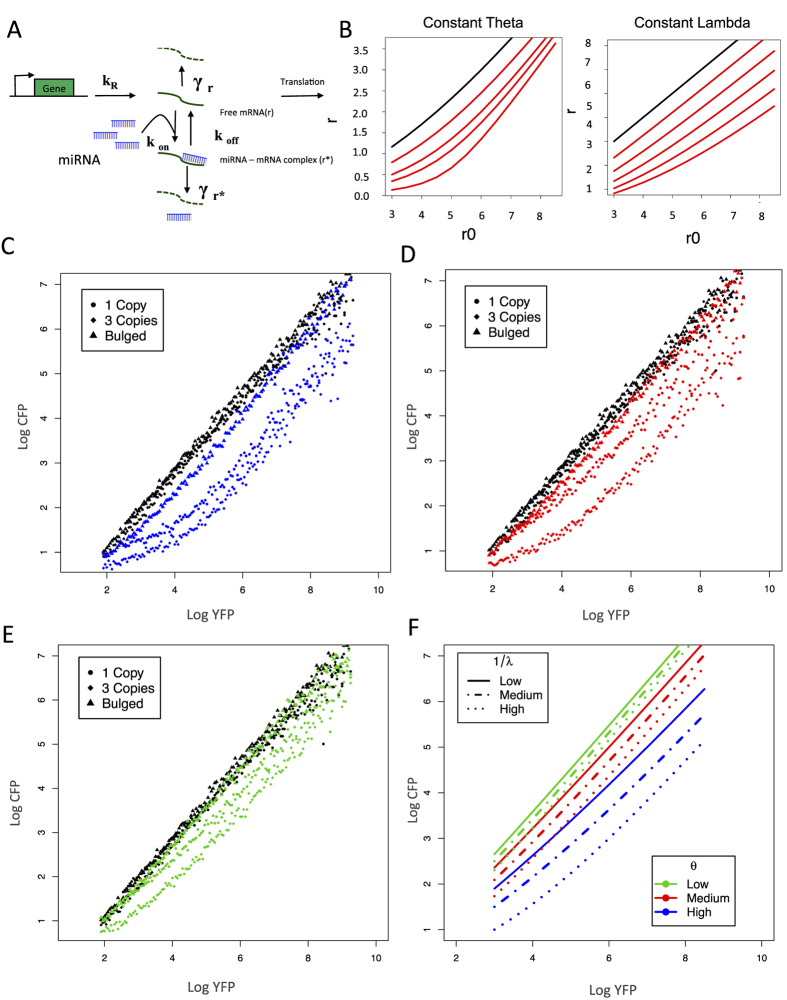
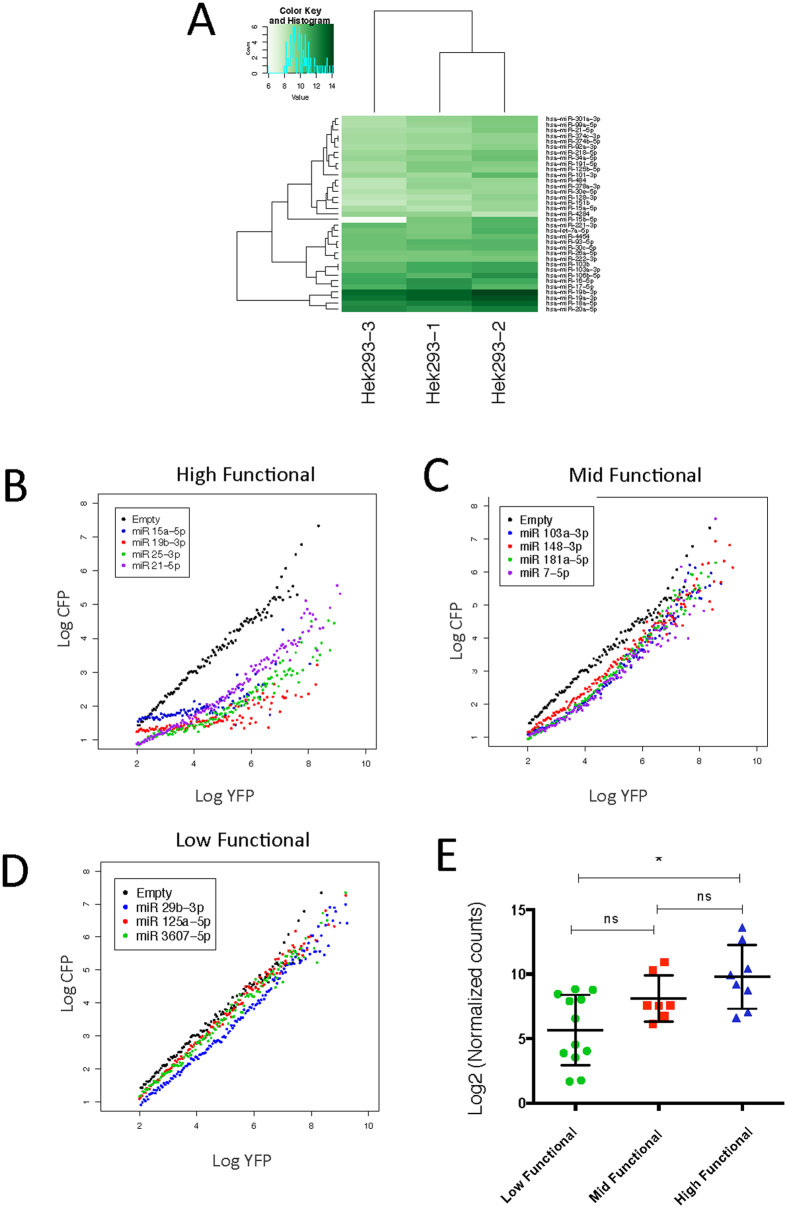
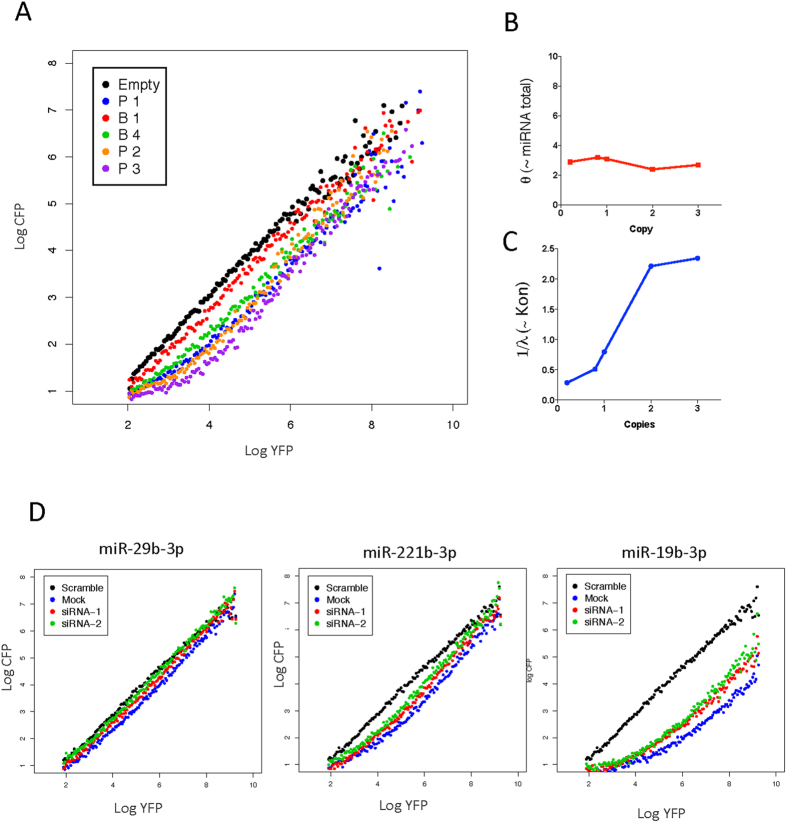
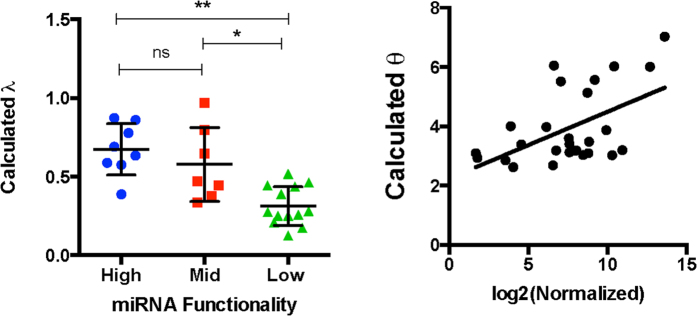
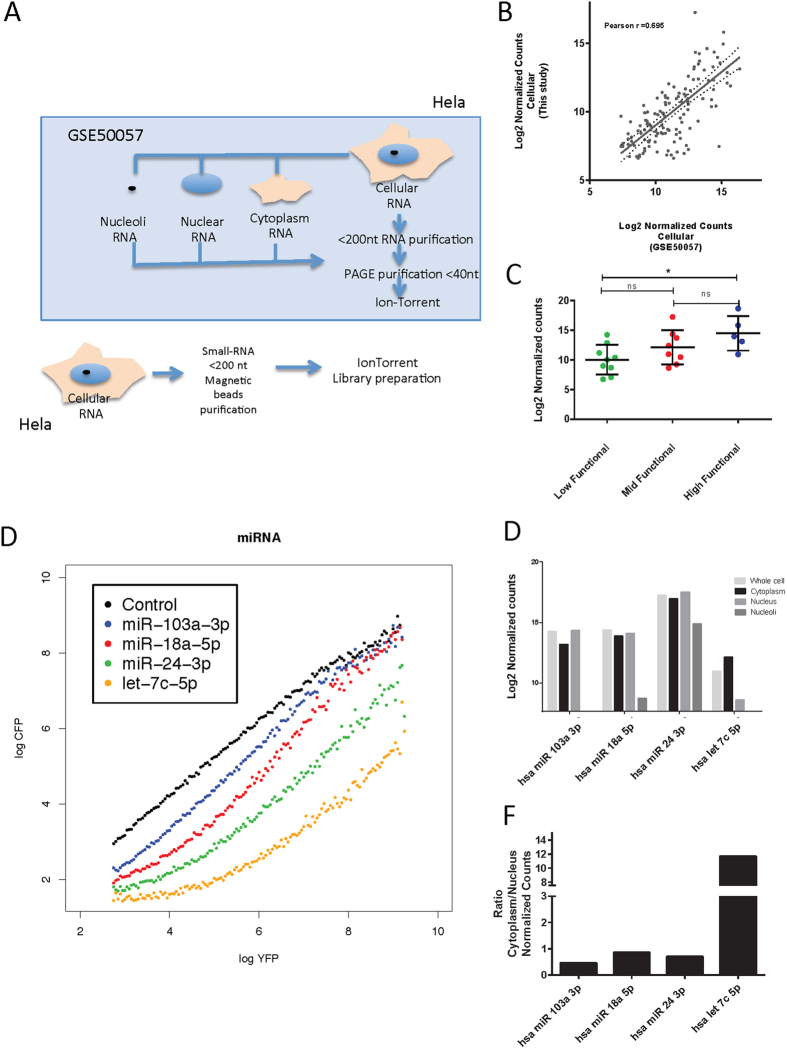
Despite major advances on miRNA profiling and target predictions, functional readouts for endogenous miRNAs are limited and frequently lead to contradicting conclusions. Numerous approaches including functional high-throughput and miRISC complex evaluations suggest that the functional miRNAome differs from the predictions based on quantitative sRNA profiling. To resolve the apparent contradiction of expression versus function, we generated and applied a fluorescence reporter gene assay enabling single cell analysis. This approach integrates and adapts a mathematical model for miRNA-driven gene repression. This model predicts three distinct miRNA-groups with unique repression activities (low, mid and high) governed not just by expression levels but also by miRNA/target-binding capability. Here, we demonstrate the feasibility of the system by applying controlled concentrations of synthetic siRNAs and in parallel, altering target-binding capability on corresponding reporter-constructs. Furthermore, we compared miRNA-profiles with the modeled predictions of 29 individual candidates. We demonstrate that expression levels only partially reflect the miRNA function, fitting to the model-projected groups of different activities. Furthermore, we demonstrate that subcellular localization of miRNAs impacts functionality. Our results imply that miRNA profiling alone cannot define their repression activity. The gene regulatory function is a dynamic and complex process beyond a minimalistic conception of "highly expressed equals high repression".


Conflict of interest statement

The authors declare no competing financial interests.

Figures

Figure 1
Figure 1. UTA Dual Fluorescence Reporter System functionally characterized miRNA activity.
Unstranslated Trans Assay (UTA) uses two independent fluorescent proteins expressed individually from two different promoters. RFP in A (or CFP in B) contained a perfect complementary target region for miRNAs within its 3′ UTR while YFP (or GFP) is unaffected (cartoons depict the used promoters and proteins). Human HEK293 cells were transfected with three different sensor constructs (miR-23a-3p, miR-27a-3p and non-cognate as control) and evaluated after 72 h. (A) Qualitative micrographs and (B) scatter plots for flow cytometry measurements display constant GFP/YFP expression in all the samples within a broad range of fluorescence intensities. The RFP/CFP expression was reduced for miRNA-23a-3p and miRNA-27a-3p targets but remained proportional to GFP/YFP in the non-cognate control. (C) Decreased ratios CFP/YFP for miRNA-targeted constructs from bulk quantitative analysis was performed after flow cytometry. Fluorescence intensity ratios of CFP and YFP for miRNA-23a-3p, miRNA-27a-3p and the non-cognate control were calculated using custom R scripts. (D) For standard luciferase assays HEK293 were transfected with miRNA-23a-3p and miRNA-27a-3p targets located within the 3′UTR of Renilla luciferase and the ratio between Renilla and Firefly luciferase were examined after 72 h.
Figure 2
Figure 2. Molecular titration model for miRNA-mediated regulation can be exploited for UTA fluorescent reporters.
(A) The titration model adapted from (ref. and methods section) describes the steady-state levels of free mRNA (r) and miRNA associated mRNA (r*). The steady state solution for r contains two parameters that define the shape of the function: λ and θ, λ proportional to the effective dissociation constant of miRNA-mRNA (koff) and inverse-proportional to the on-rate (kon) constant of miRNA-mRNA complex formation while θ is proportional to miRNA concentration. (B) Several solutions were simulated using custom R scripts for r as a function of r0. Increasing values of θ (left) and λ (right) were utilized for simulations. Only values within the experimentally determined range of YFP intensities were used for r0. Control (non-human targeted) siRNA GL-2 reproduced model predictions; three different GL2 target UTA reporters were used to evaluate λ, i.e. bulged with 19 matching complementary base pairs, and 3 unpaired bases (Triangles), one 21 base perfectly complementary target (circles), and three copies of 21 exact complementary bases separated by 4 unpaired bases (diamonds). To mimic effector expression differences (θ) synthetic Gl-2 siRNA was co-transfected at different concentration (C) 20 nM (D) 1.5 nM and (E) 0.5 nM. The transfer functions for cells transfected with only the dual reporter (negative control) are depicted in black. (F) Simulation of data-derived parameters describes three functional miRNA classes. The GL-2 (siRNA) experimental transfer functions were fitted using non-linear regression methods to define θ and λ range; steady state solutions for nine combinations of θ (Colors) and 1/λ (lines) are depicted.
Figure 3
Figure 3. UTA Reporter derived functions uncouple miRNA expression from functionality.
(A) Expression levels of miRNAs were investigated by NGS using three small-RNA libraries from three independent HEK293 cultures. Sequence data were processed and aligned to sRNA databases, subsequently reads were normalized using DEseq package. Sample quality and sequencing reproducibility were assured by using heat map and blind hierarchal clustering. Selected miRNA target regions were inserted into the CFP 3′UTR, transfected into HEK293 cells and incubated for 72 h, then cells were examined by FACS and transfer functions were calculated (for details see methods section). Three different functional behaviors are depicted according to the shape of the transfer function: (B) High functional (Left) have a threshold up to high YFP intensities, (C) mid Functional (Middle) have a threshold at intermediate YFP intensities and (D) low functional (Right) have no detectable threshold (compare Supplementary Fig. S3). (E) Functional groups were used as ordinal variables and mean normalized counts were compared between groups (P < 0.01 Kruskal-Wallis test, Dunns multiple comparisons test * < 0.05).
Figure 4
Figure 4. Threshold modulation is suitable for functional evaluation of endogenous miRNAs.
Sharpening of the threshold was investigated by target site modulations; bulged and perfect binding sites for miR-27a-3p were inserted at 3′UTR of CFP, HEK293 cells were transfected and analyzed by FACS after 72 h. (A) Transfer functions for perfect binding sites (“P”) with 1, 2 and 3 copies and bulged (contain three unmatched bases “B”) sites 1 and 4 copies are shown. Experimentally derived parameters predicted behavior for endogenous miRNA: UTA derived transfer functions were fitted using non-linear least squares using custom R scripts and θ and λ values were calculated for different miR-27a-3p transfer functions: (B) Copy number of miRNA targets vs. calculated θ (~miRNA) and (C) Copy number of miRNA targets vs. 1/λ (~Kon), copy number value for bulged target sites was arbitrary set to 0.2. (D) Outcompeting miRNA with siRNA shift the UTA resultant function, three-selected UTA construct for low, mid and high functional miRNA were cotransfected with two distinct siRNA and evaluated after 72 h.
Figure 5
Figure 5. Molecular miRNA titration model describes functional groups and solves discrepancy of expression/repression by incorporating binding capability.
UTA transfer functions for tested miRNAs were fitted using non-linear least squares regression and λ and θ were extracted (A) Calculated 1/λ (~Kon) plotted versus different functional groups (P < 0.05 Kruskal-Wallis test, * < 0.05 ** < 0.01). (B) Expression in mean normalized counts from the three sequenced libraries vs. calculated (~miRNA).
Figure 6
Figure 6. Subcellular localization of miRNAs influences their functional output.
GEO50057 retrieved raw data from HeLa small – RNA seq experiment was retrieved and compared with fresh produced total cell small RNA library. Fractionated cell compartment derived small RNA libraries were used for further analysis of nuclear, cytoplasmic and nucleolar content. (A) Experimental layout for HeLa small RNA library preparation in GSE50057 and this study. (B) Comparison of small RNA expression profiles from HeLa cells from two independent sources, plot of normalized counts HeLa library prepared vs retrieved (r = 0.695, P < 2.2e16 r2 = 0.48).(C) miRNAs UTA reporters were transfected into HeLa cells, evaluated after 72 h and UTA transfer functions were plotted (Supplementary Fig. S8) distributed into the three ordinal variables as before and cellular normalized counts were compared between groups (P < 0.01 Kruskal-Wallis test, Dunn’s multiple comparisons test * < 0.05). Four individual miRNAs were chosen according to their cellular expression, 3 miRNAs on low and mid functional groups with expression higher than the high functional median (miR-103a-3p, miR-18a-5p, miR-24-3p) and one high functional miRNA lower than the mid functional median of normalized cellular read counts. (D) UTA transfer functions (E) Bar plots for cellular compartments small RNA libraries and (F) Cytoplasmic/Nuclear ratio for selected candidates.

References

    1. Nishihara T., Zekri L., Braun J. E. & Izaurralde E. miRISC recruits decapping factors to miRNA targets to enhance their degradation. Nucleic acids research 41, 8692–8705, doi: 10.1093/nar/gkt619 (2013). - DOI - PMC - PubMed
    1. Jonas S. & Izaurralde E. Towards a molecular understanding of microRNA-mediated gene silencing. Nature reviews. Genetics 16, 421–433, doi: 10.1038/nrg3965 (2015). - DOI - PubMed
    1. Huntzinger E. & Izaurralde E. Gene silencing by microRNAs: contributions of translational repression and mRNA decay. Nature reviews. Genetics 12, 99–110, doi: 10.1038/nrg2936 (2011). - DOI - PubMed
    1. Eulalio A. et al.. Deadenylation is a widespread effect of miRNA regulation. Rna 15, 21–32, doi: 10.1261/rna.1399509 (2009). - DOI - PMC - PubMed
    1. Braun J. E., Huntzinger E. & Izaurralde E. The role of GW182 proteins in miRNA-mediated gene silencing. Advances in experimental medicine and biology 768, 147–163, doi: 10.1007/978-1-4614-5107-5_9 (2013). - DOI - PubMed

Publication types