. 2017 Mar 24:7:44034.
doi: 10.1038/srep44034.

Halo-free Phase Contrast Microscopy

Affiliations

Halo-free Phase Contrast Microscopy

Tan H Nguyen et al. Sci Rep. .

Abstract

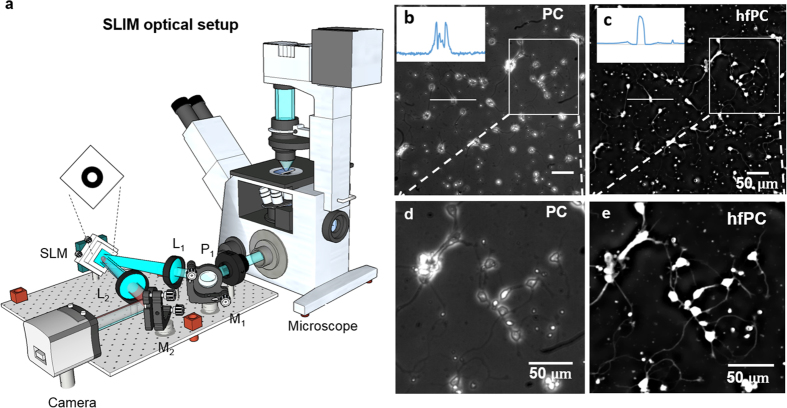
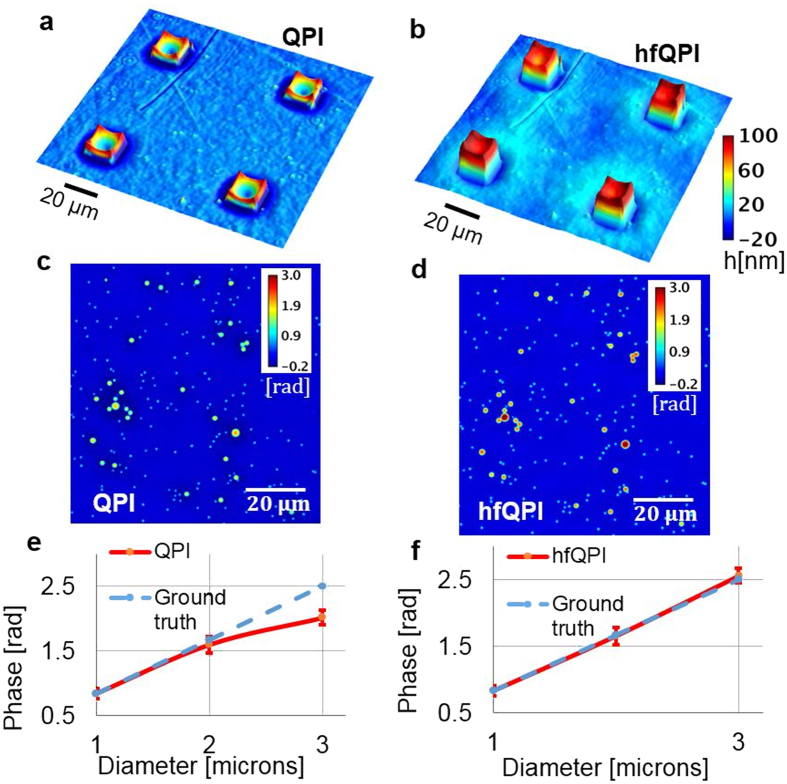
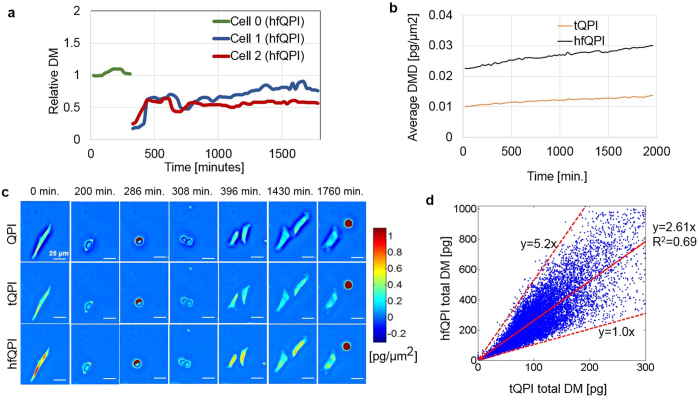
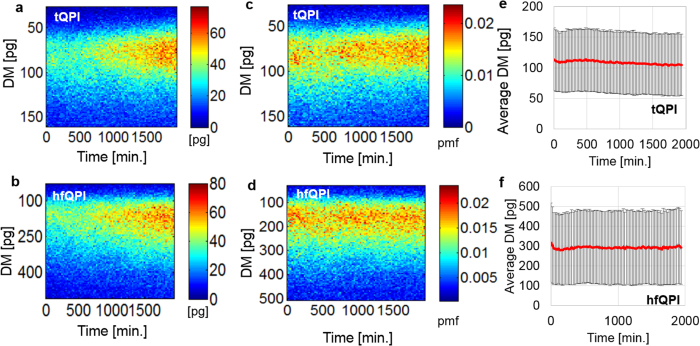
We present a new approach for retrieving halo-free phase contrast microscopy (hfPC) images by upgrading the conventional PC microscope with an external interferometric module, which generates sufficient data for reversing the halo artifact. Acquiring four independent intensity images, our approach first measures haloed phase maps of the sample. We solve for the halo-free sample transmission function by using a physical model of the image formation under partial spatial coherence. Using this halo-free sample transmission, we can numerically generate artifact-free PC images. Furthermore, this transmission can be further used to obtain quantitative information about the sample, e.g., the thickness with known refractive indices, dry mass of live cells during their cycles. We tested our hfPC method on various control samples, e.g., beads, pillars and validated its potential for biological investigation by imaging live HeLa cells, red blood cells, and neurons.


Conflict of interest statement

G.P. has financial interest in Phi Optics, Inc., a company developing quantitative phase imaging technology for materials and life science applications.

Figures

Figure 1
Figure 1. Optical setup.
(a) The SLIM add-on module uses a 4-f system and a SLM coupled to the output port a phase-contrast microscope. A camera is placed at the output of the module to record the interference intensity. Post-processing is performed on a computer to recover the phase quantity of interest. (b) Positive PC image of mouse neurons imaged using a 20x/0.3 NA objective. (c) Positive hfPC image. (d,e) Zoomed-in image of the regions boxed by the rectangle in (b) and (c) respectively.
Figure 2
Figure 2. Halo removal of square micro-pillars and polystyrene beads.
(a) Input height surface map of four quartz micro-pillars that are 20-μm wide and 80-nm high measured using a 20x/0.3 NA objective. The unit is nm. (b) The halo-free surface map of (a). (c) Measured phase map of a mixture of 1, 2 and 3-μm polystyrene beads image under the same setup. Note that the halo affects less the small beads than to the large beads. (d) Halo-free version of (c). (e,f) Diameter profiles for different sizes of the beads for (c) and (d) respectively. Dashed lines are expected ground truth profiles.
Figure 3
Figure 3
Halo removal of red blood cells (a,b) Original QPI image and hfQPI image version of the same red blood cell sample measured under 40x/0.75 NA. (c,d) Phase profiles of several red-blood cells selected in (a) and (b) respectively.
Figure 4
Figure 4
Original QPI and hfQPI images of different samples at different magnifications, as indicated.
Figure 5
Figure 5. Automatic cell segmentation.
(a) Stitching results of hfQPI images over a large FOV. (b) Stitching results of automatic binary segmentation. (c,d) Segmentation results overlaid on the hfQPI images of zoomed-in regions (1) & (2) in (a) and (b) respectively.
Figure 6
Figure 6. HeLa cell mass measurement.
(a) Different growth curves from a parent and two daughter HeLa cells measured using a 20x/0.3 NA objective over 32.6 hours. Each growth curves show the total dry mass of a single HeLa cell over time. When a parent cell divides, two new curves are generated for the daughter cells. (b) Measured averaged dry mass densities obtained from the thresholded quantitative phase imaging (tQPI) images and the hfQPI images over time. (c) Each row shows seven measurements of the dry mass density at different time points in (a). The first row contains the raw QPI images. The middle row shows tQPI images. The bottom row is for hfQPI images. (d) Scatter plot of the total dry mass of all several cells obtained from tQPI images (horizontal axis) and the hfQPI images (vertical axis) using automatic segmentation. The lines show the maximum slope, minimum slope and fitted slope using linear regression relations between these two quantities.
Figure 7
Figure 7
(a,b) Total dry mass histogram of all cells in the FOV obtained from the tQPI and hfQPI images over time, respectively. Each column corresponds to one time-step. Each row corresponds to bin of the dry mass histogram. (c,d) Normalized version of (a) and (b) to the number of cells, respectively. Therefore, they show the probability mass function of a single cell. (e,f) The mean and the standard deviation of the mass over time obtained from tQPI and hfQPI images, respectively. DM: single cell dry mass.

References

    1. Evanko D., Heinrichs A. & Rosenthal C. Milestones in light microscopy. Nature Cell Biol. 11, S5–S20 (2009). - PubMed
    1. Abbe E. Beiträge zur Theorie des Mikroskops und der mikroskopischen Wahrnehmung. Archiv für mikroskopische Anatomie 9, 413–418 (1873).
    1. Hell S. W. & Wichmann J. Breaking the diffraction resolution limit by stimulated emission: stimulated-emission-depletion fluorescence microscopy. Optics letters 19, 780–782 (1994). - PubMed
    1. Pluta M. Advanced light microscopy. (Polish Scientific Publishers, 1988).
    1. Popescu G. Quantitative phase imaging of cells and tissues. (McGraw-Hill, 2011).

Publication types