. 2017 Mar 24:7:45140.
doi: 10.1038/srep45140.

Gsα Controls Cortical Bone Quality by Regulating Osteoclast Differentiation via cAMP/PKA and β-Catenin Pathways

Affiliations

Gsα Controls Cortical Bone Quality by Regulating Osteoclast Differentiation via cAMP/PKA and β-Catenin Pathways

Girish Ramaswamy et al. Sci Rep. .

Abstract

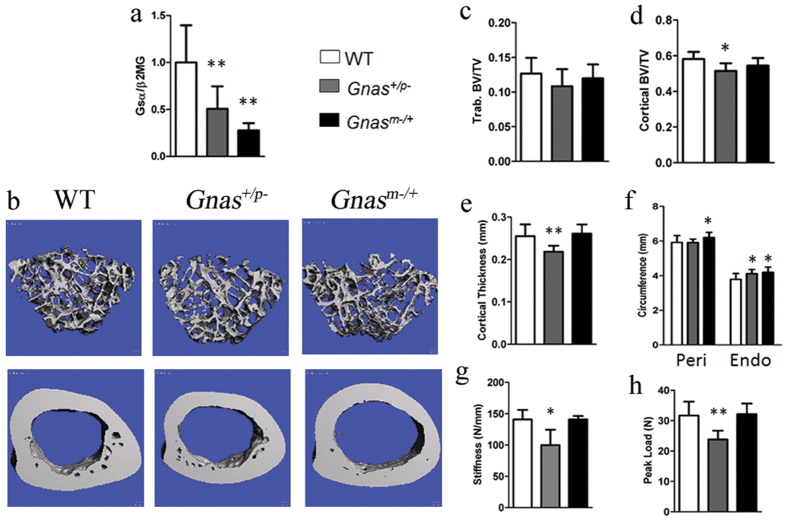
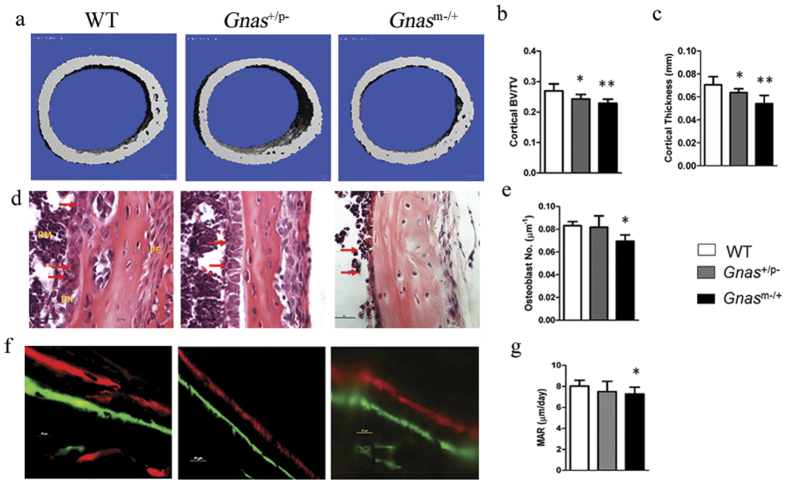
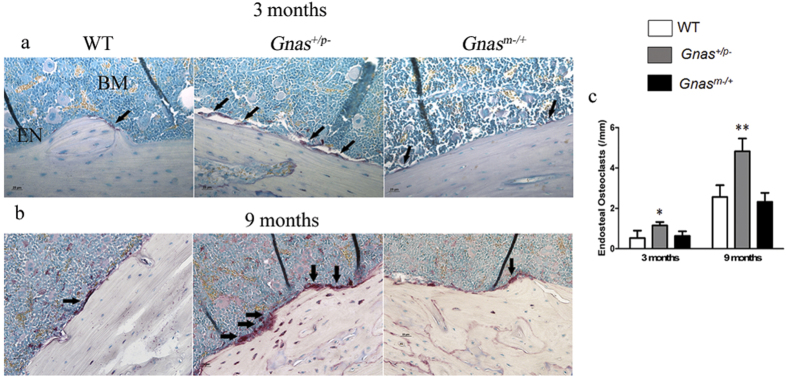
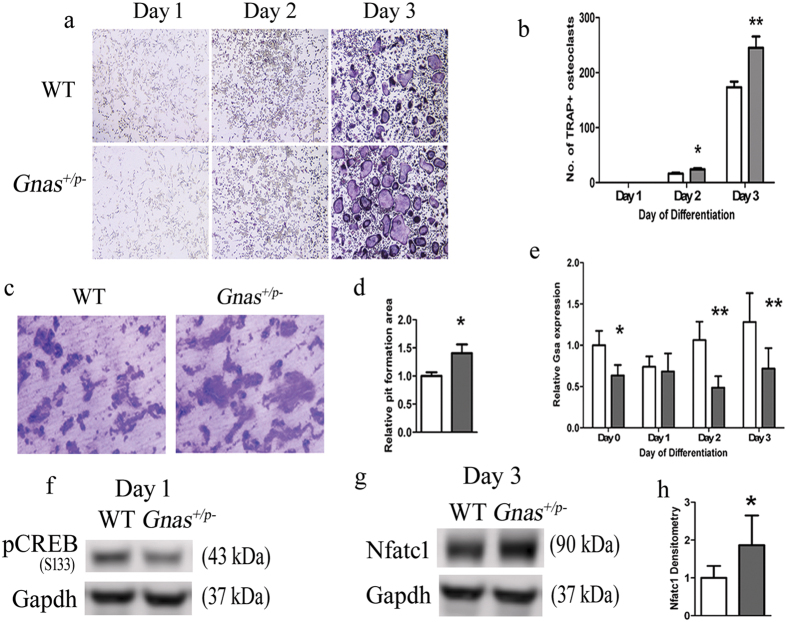
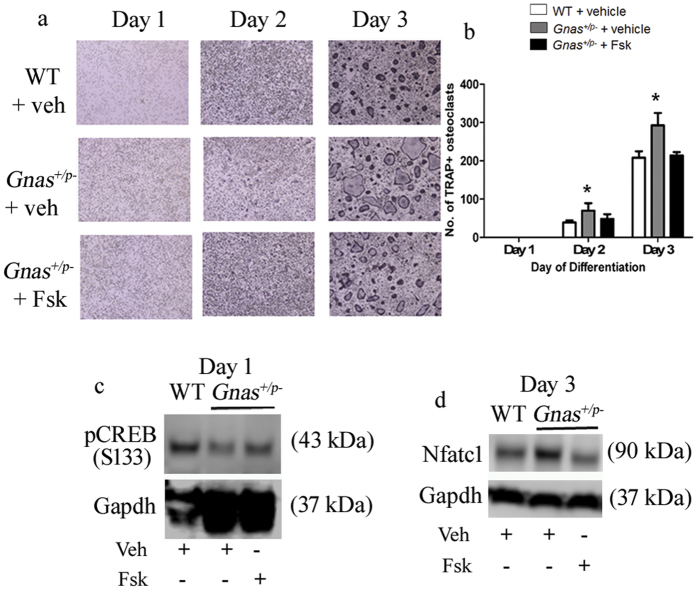
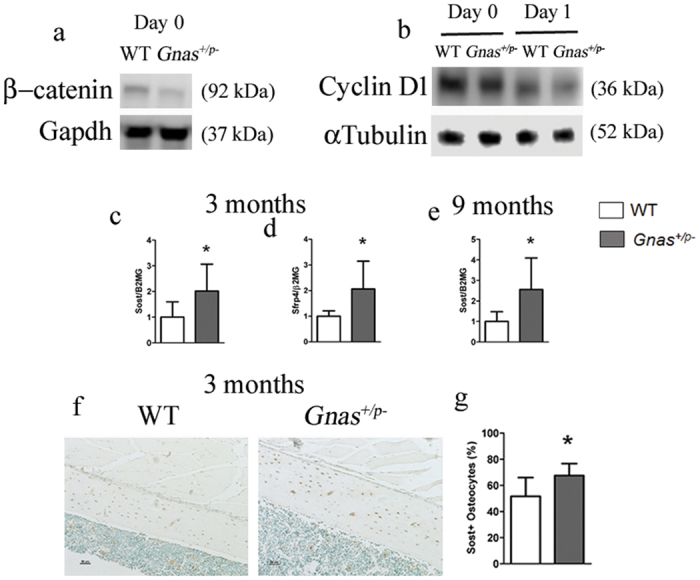
Skeletal bone formation and maintenance requires coordinate functions of several cell types, including bone forming osteoblasts and bone resorbing osteoclasts. Gsα, the stimulatory subunit of heterotrimeric G proteins, activates downstream signaling through cAMP and plays important roles in skeletal development by regulating osteoblast differentiation. Here, we demonstrate that Gsα signaling also regulates osteoclast differentiation during bone modeling and remodeling. Gnas, the gene encoding Gsα, is imprinted. Mice with paternal allele deletion of Gnas (Gnas+/p-) have defects in cortical bone quality and strength during early development (bone modeling) that persist during adult bone remodeling. Reduced bone quality in Gnas+/p- mice was associated with increased endosteal osteoclast numbers, with no significant effects on osteoblast number and function. Osteoclast differentiation and resorption activity was enhanced in Gnas+/p- cells. During differentiation, Gnas+/p- cells showed diminished pCREB, β-catenin and cyclin D1, and enhanced Nfatc1 levels, conditions favoring osteoclastogenesis. Forskolin treatment increased pCREB and rescued osteoclast differentiation in Gnas+/p- by reducing Nfatc1 levels. Cortical bone of Gnas+/p- mice showed elevated expression of Wnt inhibitors sclerostin and Sfrp4 consistent with reduced Wnt/β-catenin signaling. Our data identify a new role for Gsα signaling in maintaining bone quality by regulating osteoclast differentiation and function through cAMP/PKA and Wnt/β-catenin pathways.


Conflict of interest statement

The authors declare no competing financial interests.

Figures

Figure 1
Figure 1. Paternal but not maternal heterozygous Gnas deletion causes reduction in cortical bone quality in 9 month old mice.
(a) mRNA expression of Gsα in cortical bone was reduced in heterozygous Gnas mutants compared to WT by qRT-PCR. There was no statistical difference between Gnas+/p− and Gnasm−/+. (b) Representative 3D μCT images of (top) trabecular and (bottom) cortical bone. (c) No differences in trabecular bone volume fraction were observed between the groups. Decreased (d) cortical bone volume fraction, (e) cortical thickness and (g) stiffness and (h) peak load in Gnas+/p− mice but not Gnasm−/+ mice as compared to WT. (f) Endosteal circumference (Endo) measured at the femoral mid-shaft is increased with no change in periosteal circumference (Peri) in Gnas+/p− mice while both are increased in Gnasm−/+ mice. Data represent mean ± SD. N = 13 WT, 7 Gnas+/p− and 5 Gnasm−/+ animals. *p < 0.05, **p < 0.01.
Figure 2
Figure 2. Cortical bone defects in Gnas+/p− mice are not due to defects in osteoblast numbers and function in Gnas+/p− mice.
(a) Representative 3D μCT images of cortical bone from mice at 2 weeks of age. (b) Cortical bone volume fraction and (c) cortical thickness measurements by μCT scans at the mid-diaphyseal region of femurs were significantly reduced in both Gnas+/p− and Gnasm−/+ 2-week-old mice. (d) H&E staining of cortical bone shows osteoblasts (arrows) lining the endocortical surface. (f) Double labeling of cortical bone surface with calcein and xylenol orange in 2-week-old mice. Quantification of osteoblast number (e) and mineral apposition rate (g) along the endocortical surface showed reduction in Gnasm−/+ but not Gnas+/p− when compared to WT mice. Data represent mean ± SD. N = 7–11 animals per group for μCT and 5–6 animals per group for histology. *p < 0.05, **p < 0.01.
Figure 3
Figure 3. Mice with paternal inheritance of heterozygous deletion of Gnas have elevated numbers of endosteal osteoclasts.
At (a) 3 months and (b) 9 months of age, Gnas+/p− exhibit increased endocortical osteoclasts (arrows) detected by TRAP staining compared to WT and Gnasm−/+ mice. (c) Quantification of endocortical osteoclast number at the diaphyseal region in WT, Gnas+/p− and Gnasm−/+ mice at 3 and 9 months of age. Data represent mean ± SD. N = 4–8 animals per group. *p < 0.05. EN – endosteum, BM – bone marrow.
Figure 4
Figure 4. Paternal inheritance of Gnas inactivation enhances osteoclast differentiation and resorption activity of osteoclasts.
(a) Differentiation of bone marrow macrophages (BMMs) from 7–9 week old WT and Gnas+/p− mice into osteoclasts. (b) Quantitation of TRAP+ multi-nucleated cells (≥3 nuclei) at days 1–3 of differentiation shows increased Gnas+/p− osteoclasts at days 2 and 3 of differentiation. (c) Osteoclasts differentiated from BMMs were seeded on bone slices for 48 h and (d) the relative resorption area measured; resorption activity was greater with Gnas+/p− osteoclasts compared to WT. (e) mRNA expression of Gsα was reduced over time in Gnas+/p− cells during osteoclast differentiation. β2-microglobulin was used for normalization and WT values were set to 1. (f) pCREB was lower during osteoclast differentiation in Gnas+/p− cells as compared to WT cells. (g,h) Nfatc1 from whole cell lysate was significantly elevated in Gnas+/p− cells as compared to WT cells at day 3 of osteoclast differentiation. Data represent mean ± SD. Experiments were performed at least 3 times with n = 2–3 animals per group per experiment. Total of 5–7 animals per group from 3 experiments used for quantification. For osteoclast differentiation and pit formation, cells were seeded in triplicates in 96-well plate and on bone slices respectively. For pit formation, resorption area mean of WT was set to 1. *p < 0.05; **p < 0.01.
Figure 5
Figure 5. Forskolin (Fsk) rescues the osteoclast differentiation phenotype of cells from Gnas+/p− mice.
(a,b) Forskolin treatment during osteoclast differentiation rescued the increased osteoclast numbers in Gnas+/p− mice. (c,d) Forskolin treatment of Gnas+/p− cells increased pCREB (c) and reduced Nfatc1 (d) to levels comparable to WT. Experiments were performed at least 3 times with n = 1–2 animals per group per experiment. Total of 5 animals per group used for quantification. *p < 0.05.
Figure 6
Figure 6. Wnt/β-catenin-mediated cyclin D1 signaling is downregulated in Gnas+/p− mice.
Western blots of (a) β-catenin and (b) cyclin D1 at days 0 and 1 during osteoclast differentiation showed reduced levels in Gnas+/p− cells during osteoclast differentiation. mRNA expression of the Wnt pathway inhibitors Sost (c) and Sfrp4 (d) at 3 months and Sost at 9 months (e) is increased in cortical bone from Gnas+/p− mice as compared to WT by qRT-PCR. β2-microglobulin was used for normalization and WT values were set to 1. (f) Immunohistochemistry of sclerostin in the mid-diaphyseal region of femurs from 3-month old WT and Gnas+/p−mice. (g) Quantitation of IHC detection shows increase in Sclerostin positive osteocytes in Gnas+/p− cortical bone as compared to WT. Data represent mean ± SD. Western blots were performed twice with n = 2–3 animals per group per experiment. N = 5–8 animals per group for real time PCR. N = 6 animals per group for IHC. *p <0.05.

References

    1. Eriksen E. F. Cellular mechanisms of bone remodeling. Reviews in Endocrine and Metabolic Disorders 11, 219–227 (2010). - PMC - PubMed
    1. Seeman E. Bone modeling and remodeling. Critical Reviews in Eukaryotic Gene Expression 19, 219–233 (2009). - PubMed
    1. Sims N. A. & Martin T. J. Coupling the activities of bone formation and resorption: a multitude of signals within the basic multicellular unit. BoneKEy reports 3, 481 (2014). - PMC - PubMed
    1. Abu-Amer Y. Inflammation, cancer, and bone loss. Current Opinion in Pharmacology 9, 427–433 (2009). - PMC - PubMed
    1. Jones D., Glimcher L. H. & Aliprantis A. O. Osteoimmunology at the nexus of arthritis, osteoporosis, cancer, and infection. Journal of Clinical Investigation 121, 2534–2542 (2011). - PMC - PubMed

Publication types

MeSH terms