. 2017 Mar 24:7:44976.
doi: 10.1038/srep44976.

Septin 9_i2 is downregulated in tumors, impairs cancer cell migration and alters subnuclear actin filaments

Affiliations

Septin 9_i2 is downregulated in tumors, impairs cancer cell migration and alters subnuclear actin filaments

P Verdier-Pinard et al. Sci Rep. .

Abstract

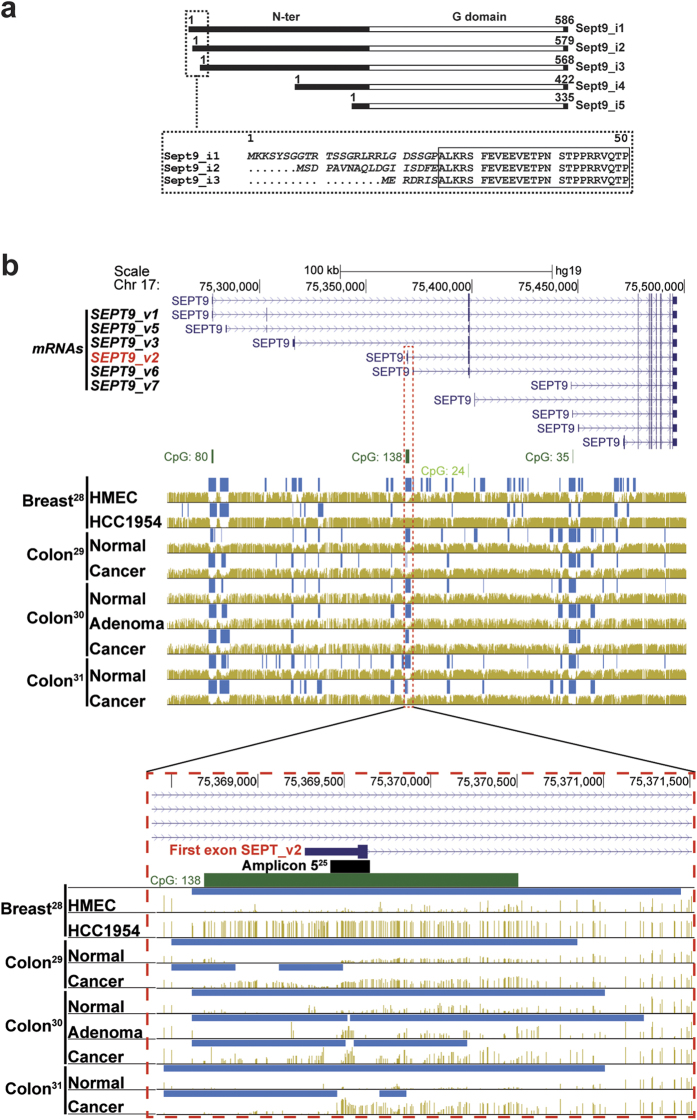
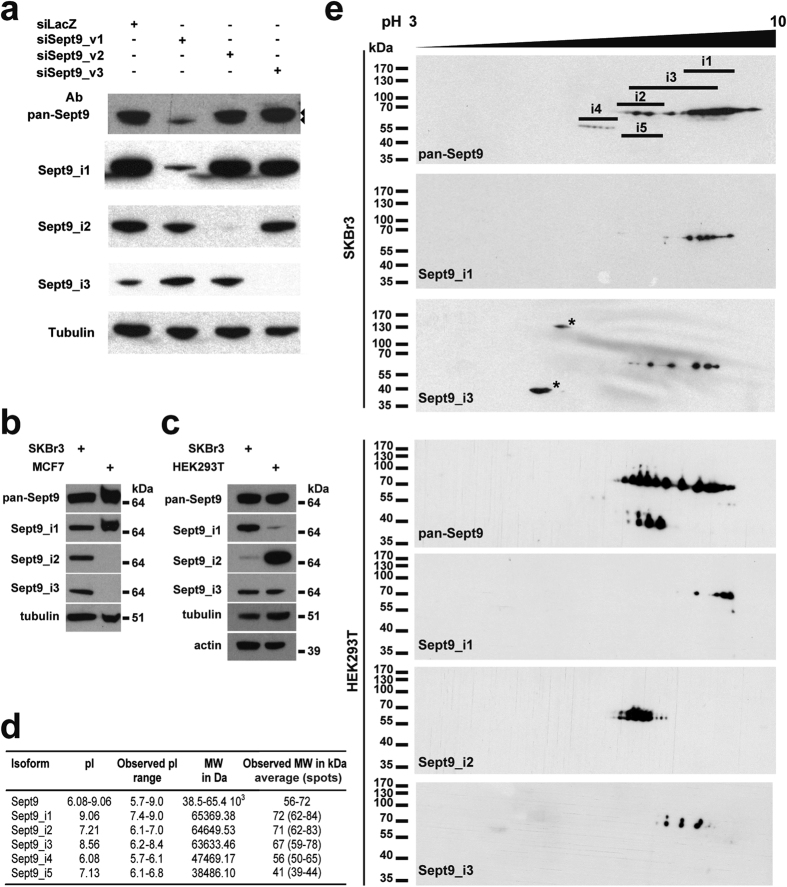
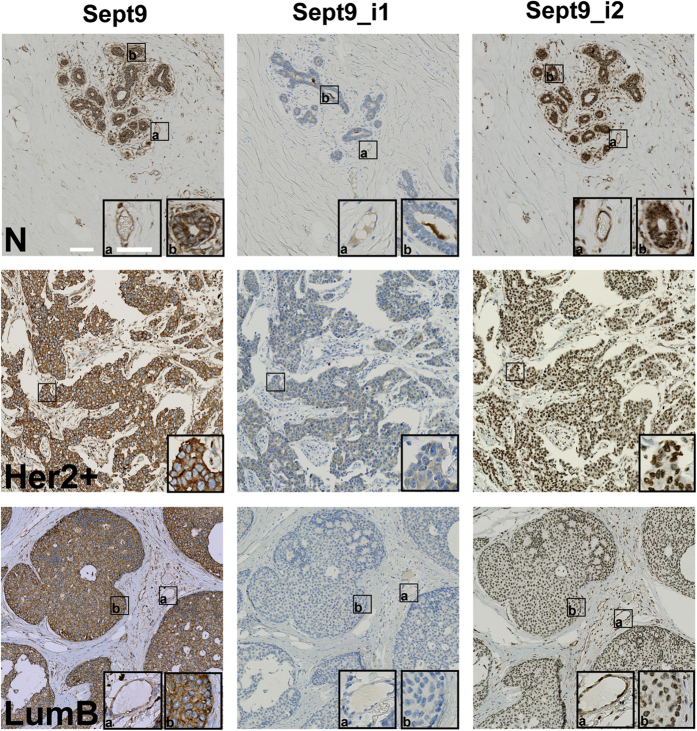
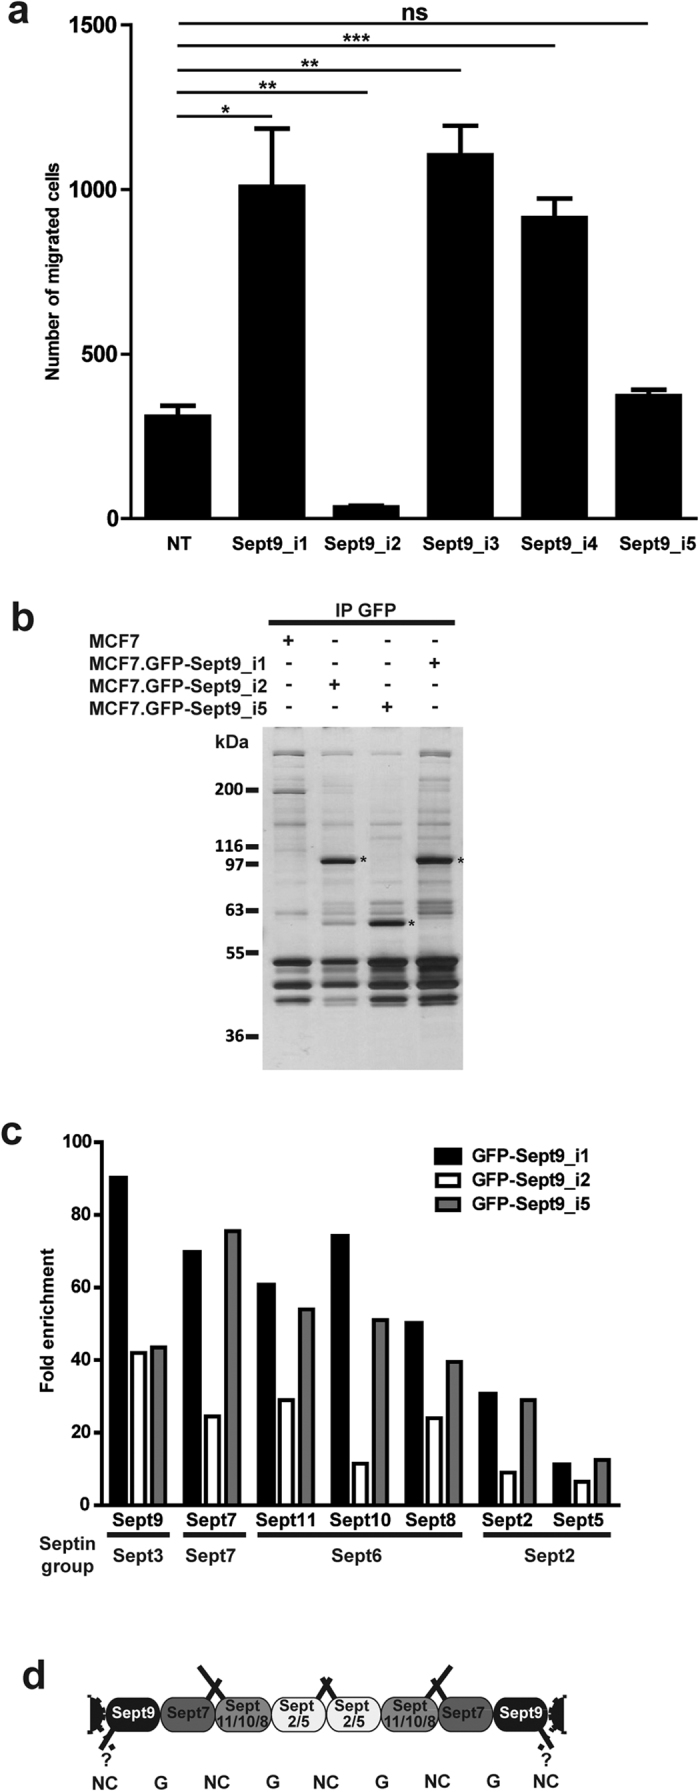
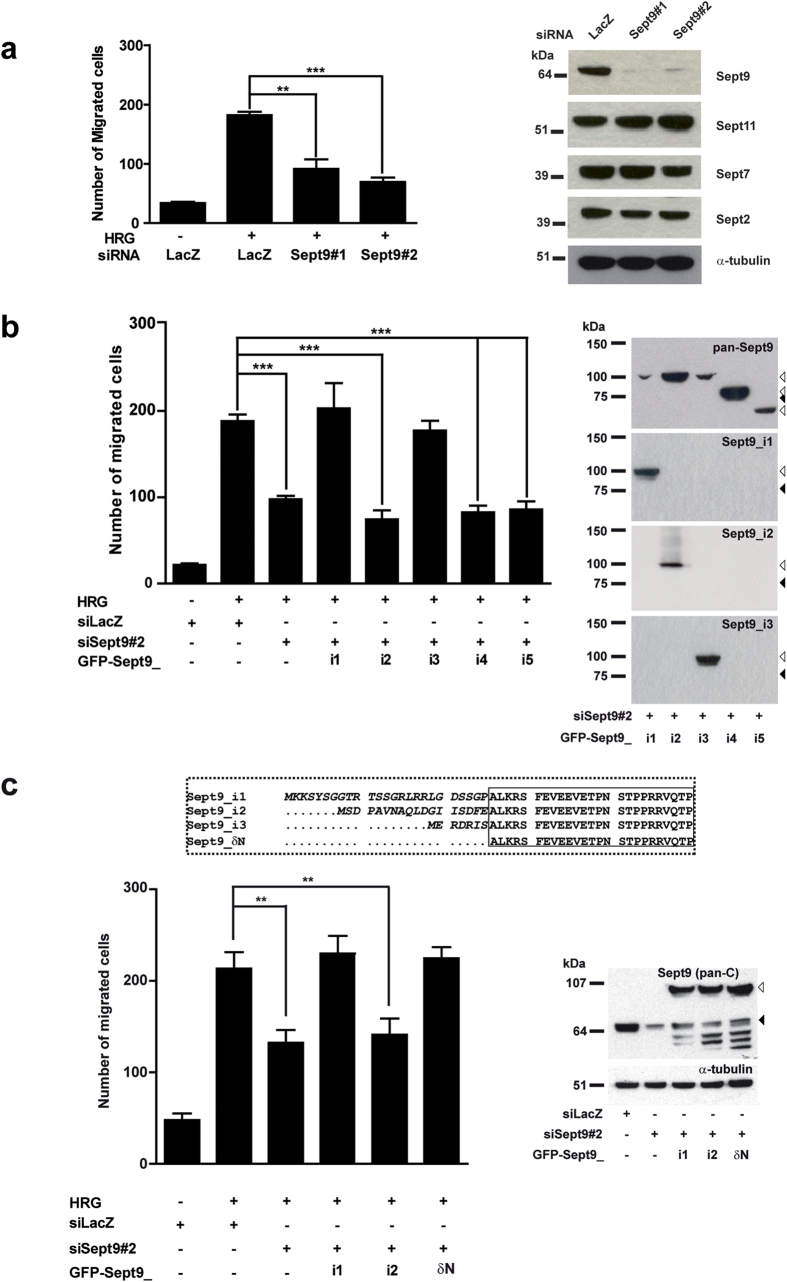
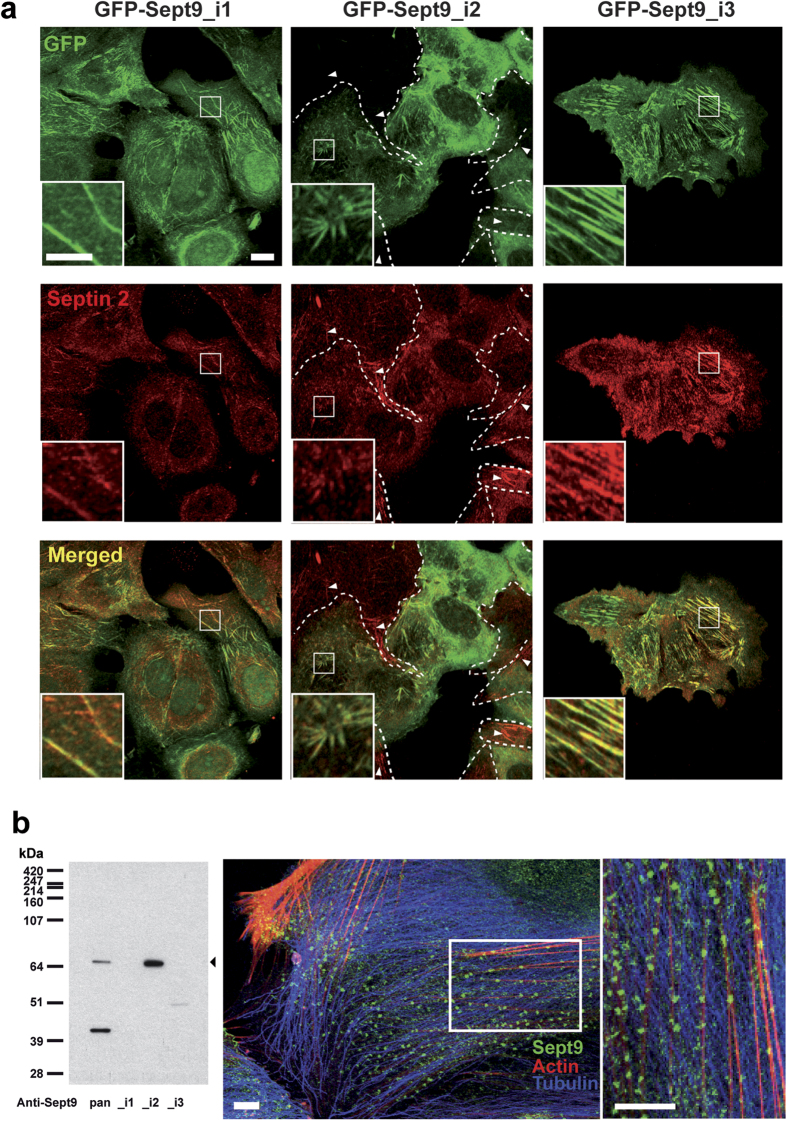
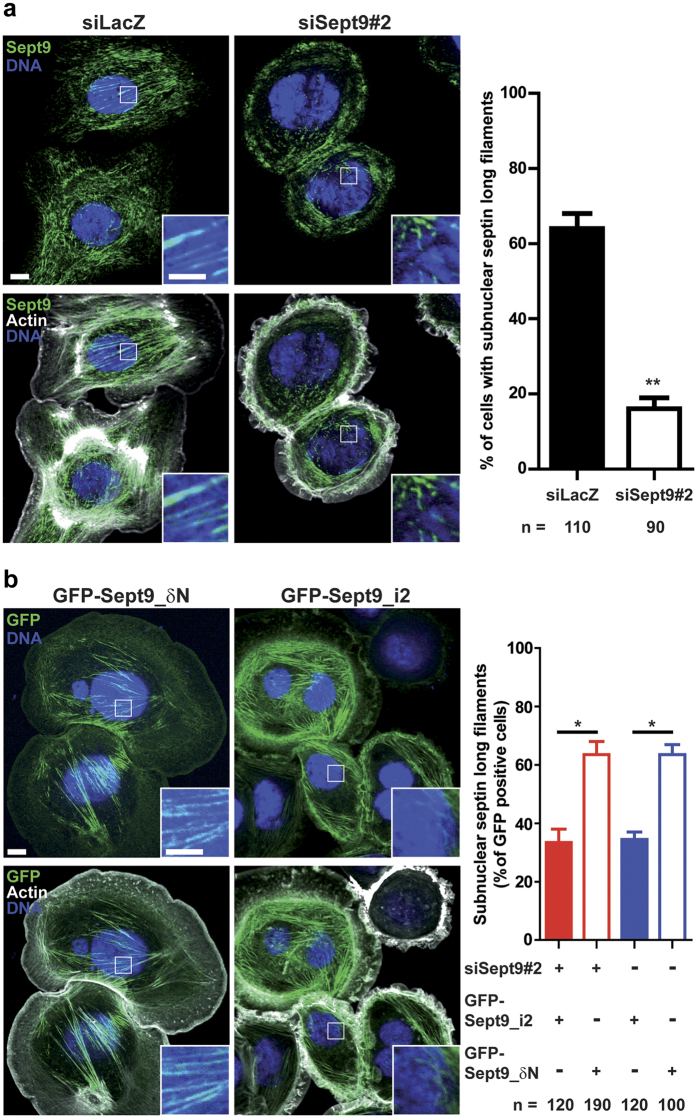
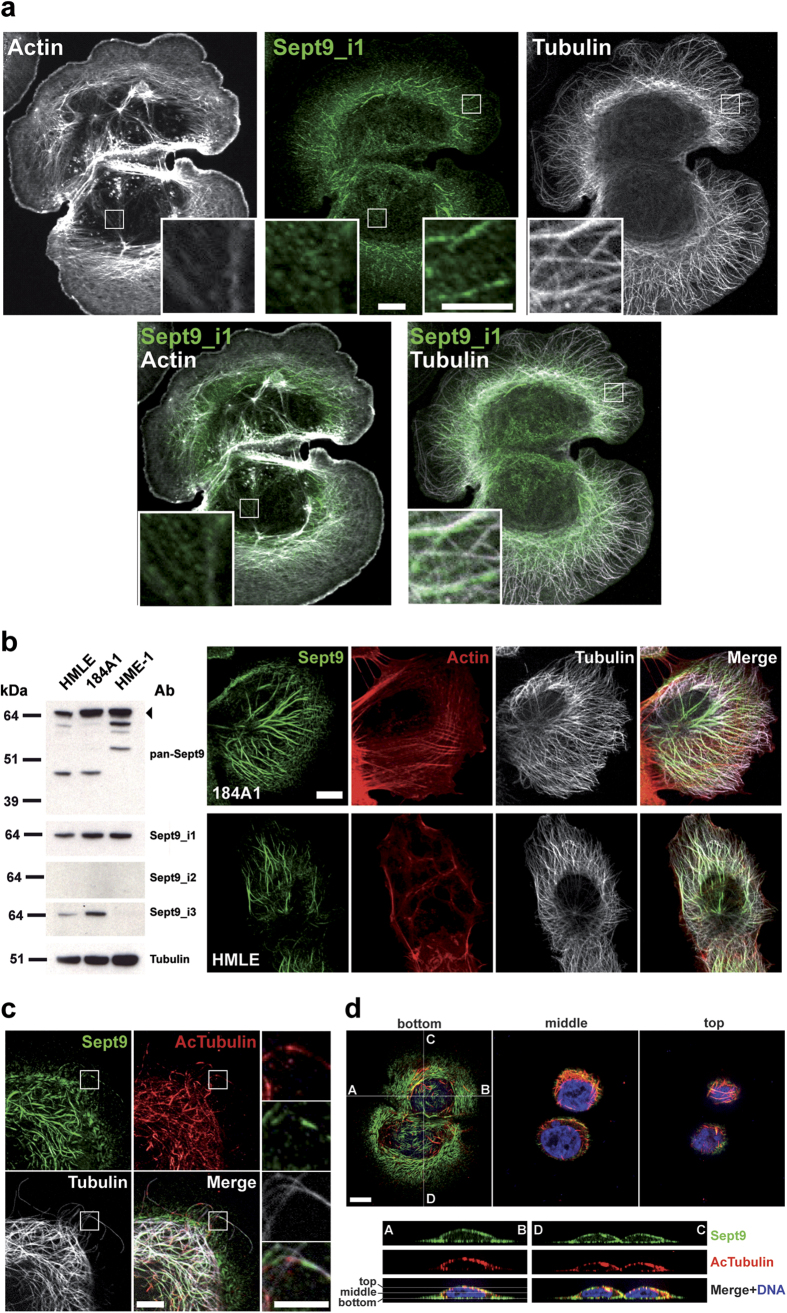
Functions of septin cytoskeletal polymers in tumorigenesis are still poorly defined. Their role in the regulation of cytokinesis and cell migration were proposed to contribute to cancer associated aneuploidy and metastasis. Overexpression of Septin 9 (Sept9) promotes migration of cancer cell lines. SEPT9 mRNA and protein expression is increased in breast tumors compared to normal and peritumoral tissues and amplification of SEPT9 gene was positively correlated with breast tumor progression. However, the existence of multiple isoforms of Sept9 is a confounding factor in the analysis of Sept9 functions. In the present study, we analyze the protein expression of Sept9_i2, an uncharacterized isoform, in breast cancer cell lines and tumors and describe its specific impact on cancer cell migration and Sept9 cytoskeletal distribution. Collectively, our results showed that, contrary to Sept9_i1, Sept9_i2 did not support cancer cell migration, and induced a loss of subnuclear actin filaments. These effects were dependent on Sept9_i2 specific N-terminal sequence. Sept9_i2 was strongly down-regulated in breast tumors compared to normal mammary tissues. Thus our data indicate that Sept9_i2 is a negative regulator of breast tumorigenesis. We propose that Sept9 tumorigenic properties depend on the balance between Sept9_i1 and Sept9_i2 expression levels.


Conflict of interest statement

The authors declare no competing financial interests.

Figures

Figure 1
Figure 1. Differential CpG methylation levels of the SEPT9 gene in carcinoma vs normal epithelia.
(a) Sept9 isoform proteins differ by their N-terminal domain; long isoforms, Sept9_i1,_i2,_i3 differ from each other by their starting amino acid sequences (indicated in italic and see Supplementary Fig. S1 for sequence details). (b) Top panel presents the human SEPT9 gene locus on Chr 17 with 11 alternatively spliced mRNA variants having in common the last 9 exons; six of these transcripts are present in breast tissues, SEPT9_v1, _v2,_v3,_v5,_v6 and_v7, coding for Sept9_i1,_i2,_i3,_i4,_i4 and_i5 isoforms, respectively. Middle panel displays the position of CpG islands (dark green >300 bases; 200< light green <300 bases), hypo-methylated regions (dark blue bars on top of corresponding genome) and methylated CpGs (golden brown vertical lines whose height is proportional to CpG methylation level). Four groups of human methylome datasets are presented: first set, HMEC (Human Mammary Epithelial Cells, primary cell line) vs HCC1954 (grade 3, ductal carcinoma cell line); second set, normal colon and colon cancer derived primary epithelial cell lines; third set, normal colon, colon adenoma and tumor biopsies; fourth set, normal colon and colon cancer biopsies. Bottom panel is the zoomed region delineated by a dashed red frame including the large CpG island 138 and the first exon of SEPT9_v2; the location of the differentially methylated amplicon identified by Wasserkort et al. in microdissected colon cancer cells is represented by a black bar on top of CpG 138 island (dark green bar). Public bisulfite-seq datasets were extracted from the MethBase methylome database using the UCSC Genome Browser on Human Feb. 2009 (GRCh37/hg19) assembly and the MethPipe software package (smithlabresearg.org).
Figure 2
Figure 2. Highly specific monoclonal antibodies against Sept9_i1,_i2 and_i3 reveal differential expression profiles in cell lines.
(a) SKBr3 cells were transfected with Sept9 isoform-specific siRNAs to eliminate individual endogenous isoforms. Western blotting using the different monoclonal antibodies directed against the extreme N-terminal sequence of Sept9_i1,_i2 or_i3 showed that the antibodies recognized only the targeted isoform. A polyclonal antibody directed against the C-terminus (pan-Sept9) common to all isoforms revealed that Sept9_i1 is the major isoform in SKBr3 cells. (b) Comparison of Sept9 long isoform expression in MCF7 and SKBr3 cells showed that only Sept9_i1 is expressed in MCF7 cells. Blots for each isoform were exposed for different durations in order to generate comparable signals. (c) Comparison of Sept9_i2 expression levels in HEK293T and SKBr3 cells by 1D Western blotting showed that Sept9_i2 and Sept9_i1 are strongly and weakly expressed in HEK293T cells, respectively. (d) Table presenting the calculated and observed MW and pI for each Sept9 isoform. (e) Proteins extracts of SKBr3 or HEK293T cell lines were separated by 2D-gel electrophoresis, and Western blotting was performed using the antibodies described in (a). The observed pI range for each Sept9 isoform is indicated by the horizontal bars in the upper blot. Sept9_i4 and_i5 spot assignments are solely based on apparent pI and MW revealed with the pan-C antibody. Asterisks indicate non-specific spots. The antibody used is indicated in the lower left corner of each blot. Blot images in panels (a–c) were cropped, full blot images are presented in Supplementary Fig. S8.
Figure 3
Figure 3. Expression of Sept9_ i2 is downregulated in breast tumors.
Mammary gland tissues and breast tumors belonging to different sub-types were immunolabeled, as indicated, with a pan Sept9 antibody or antibodies specific for Sept9_i1 or for Sept9_i2, validated for immunohistochemistry (see Supplementary Fig. S2). Inserts correspond to zoomed boxed areas; (a) endothelial cell labeling, (b) epithelial and carcinoma cell labeling. Nuclei were stained blue. While both normal tissue and tumors are positive with pan-Sept9 antibodies, isoform-specific antibodies reveal differential expression. Sept9_i1 is increased in a subpopulation of tumors. An example of a positive and a negative tumor is presented in an Her2+ and LumB tumors, respectively. Sept9_i2 antibody shows strong cytosolic labeling in normal tissue only. Sept9_i2 nuclear staining observed in tumors was not specific (see Supplementary Fig. S2). N: normal; Her2+: ErbB2 overexpressing; LumB: luminal B. White horizontal bars represent 100 μm and 60 μm in images and zoom inserts, respectively.
Figure 4
Figure 4. Sept9_i2 inhibits MCF7 cell migration.
(a) Migration of MCF7 cell lines stably expressing one of Sept9 isoforms was measured in a transwell assay. The reference migrated cell number was of non-transfected (NT) MCF7 parental cell lines. Means and standard deviations from three independent experiments are presented; t-test, *p value < 0.05, **p value < 0.01, ***p value < 0.001. (b-d) Identification of the protein partners of specific Sept9 isoforms. (b) Silver stained SDS-PAGE analysis of GFP-pull down performed on extracts from MCF7 cells stably expressing either GFP-Sept9_i1 or_i2 or_i5, used for mass spectrometry analyses. Extracts from non-transfected MCF7 cells were used as a control. (c) Mass spectrometry analyses identified only other septin family members. Results are expressed as means of total ion intensity signal-based enrichment ratio of proteins in GFP-pulldowns relative to control from two independent experiments. Sept9-associated septins were assembled by septin groups. The average ratio for each septin was consistent with its position in the septin tetramer. The detailed results of two independent pull-downs are presented in Supplementary Table S1 and the Vulcano plots from one pull-down are presented in Supplementary Fig. S3. (d) Scheme of septin octameric polymer with the different septins identified in MCF7 cells with known G domain-G domain (G) and N-terminus/C-terminus-N-terminus/C-terminus (NC) interactions. Septin coil-coiled C-terminal interactions and Sept9 long N-termini putative interactions are represented as solid bars at the top and the bottom of the polymer, respectively.
Figure 5
Figure 5. In contrast to Sept9_i1 and_i3, Sept9_i2 does not promote migration; role of its N-terminal sequence.
(a) SKBr3 cells were transfected with control siRNA (LacZ), Sept9 siRNA#1 or #2 for 48 h before migration was measured in a transwell assay. SKBr3 cells express ErbB2 and their migration was induced by the presence of heregulin (HRG) in the bottom chamber. Sept9 knockdown inhibited HRG-induced cell migration. (b,c) SKBr3 cells were transfected with Sept9 siRNA#2 (directed against the 3′ UTR region) and cDNA coding for GFP-Sept9 isoforms or δN mutant. (b) Expression of Sept9_i1 and_i3, but not Sept9_i2, restored migration to control levels. (c) Expression of Sept9_ δN, deleted of the isoform specific sequence tag, restored migration to control levels. Results are from three independent experiments, mean ± S.D.; t-test, **p value < 0.01, ***p value < 0.001. The Western blots corresponding to each experimental condition presented on the left of the bar graphs confirm the efficiency of the siRNAs and the expression levels of the transfected constructs. White and black arrowheads indicate the gel motility of GFP-Sept9 constructs and endogenous Sept9, respectively. Blot images in panels a) were cropped, full blot images are presented in Supplementary Fig. S8.
Figure 6
Figure 6. Sept9_i2 is incorporated into short septin filaments.
(a) Septin 2 and 9 co-localization indicative of septin polymers was assessed in in MCF7 cells stably expressing Sept9_i1,_i2 or_i3. GFP-Sept9_i1 was incorporated in long Sept2-filaments (mainly aligned with microtubules as depicted in Supplementary Fig. S4). GFP-Sept9_i2 was incorporated in very short and disorganized Sept2-filaments (aligned with actin fibers as depicted in Supplementary Fig. S5). GFP-Sept9_i3 was incorporated in long Sept2-filaments (aligned with actin fibers as depicted in Supplementary Fig. S5). White arrowheads point to septin filaments in cells negative for GFP-Sept9_i2 expression (delimited by dashed white lines). Framed regions are zoomed at the bottom of each image. White bars correspond to 10 μm and 5 μm in image and zoomed regions, respectively. (b) HUVEC cells, which expressed only the Sept9_i2 long isoform as indicated by Western blotting (left panel). Immunolabeling with pan-Sept9 antibody showed that Sept9_i2 was concentrated in very small clusters associated with actin stress fibers. White bars correspond to 10 μm.
Figure 7
Figure 7. Sept9_i2 overexpression induces a loss of septin associated actin filament that is dependent on its N-terminal sequence.
(a) SKBr3 cells were transfected either with control siRNA or siRNA targeting Sept9#2. After Sept9 knockdown, the number of cells with subnuclear long septin filaments associated with actin fibers decreased significantly as shown in the bar graph. Results are from the observation of the number of cells indicated at the bottom of the graph and collected in a duplicate, mean ± S.D.; t-test, **p value < 0.01. (b) SKBr3 cells were transfected either with GFP-Sept9_δN or GFP-Sept9_i2, and with or without the Sept9#2 siRNA. The number of cells with subnuclear long septin filaments associated with actin fibers decreased significantly when GFP- Sept9_δN was present. Results are from the observation of the number of cells indicated at the bottom of the graph and collected in a duplicate, mean ± S.D.; t-test, *p value < 0.05. Image panel display cells representative of cells expressing either GFP-Sept9_δN or GFP-Sept9_i2. Framed regions are zoomed at the bottom of each image. White bars correspond to 10 μm and 5 μm in image and zoomed regions, respectively.
Figure 8
Figure 8. Sept9_i1 associates with a subpopulation of microtubules that are acetylated.
(a) Labeling of SKBr3 cells with the anti Sept9_i1 antibody revealed that Sept9_i1 associated with a subpopulation of microtubules (right panels). A weaker labeling of microfilaments was also detected (left panels). Framed regions are zoomed at the bottom of each image. White bars correspond to 10 μm. (b) In immortalized human mammary epithelial cells that expressed the Sept9_i1 long isoform, but no Sept9_i2, Sept9 co-localized mainly with a subpopulation of microtubules oriented towards the leading edge. White bar corresponds to 10 μm. Blot images in panel b) were cropped, full blot images are presented in Supplementary Fig. S8. (c) Sept9 associated with deacetylated regions of acetylated microtubules in SKBr3 cells. Uncropped image of this cell and fluorescence intensity profiles of Sept9 vs acetylated tubulin along microtubules showing alternative patterns of labeling are presented in Supplementary Fig. S7. Framed regions are zoomed of the right side of the panel. White bars correspond to 10 μm and 5 μm in image and zoomed regions, respectively. (d) Acetylated and Sept9 labeled microtubules were mostly located on the edge and on top of the nucleus and Sept9 was present also under the nucleus (aligned with actin fibers as depicted in Fig. 7). Z-sections along the indicated A-B and D-C axes are presented at the bottom. White bar corresponds to 10 μm.
Figure 9
Figure 9. Differential interaction of endogenous Sept9 isoforms with microtubules and F-actin.
(a) SKBr3 cell lysates were incubated with either paclitaxel or phalloidin to polymerize tubulin or G-actin, respectively. After high-speed centrifugation through a sucrose cushion, supernatant and pellet proteins were separated and equivalent amounts of each fraction were analyzed by Western blotting with the indicated antibodies and distribution of each protein in pellets (P) and supernatants (S) was quantified. The percentage of each analyzed protein in the pellets was compared to (b) the percentage of tubulin present in the paclitaxel-microtubule pellets or to (c) the percentage of actin present in the phalloidin-F-actin pellets. Results are from three independent experiments, mean ± S.D.; t-test, *p value < 0.05, **p value < 0.01, ***p value < 0.001. Blot images in panels a) were cropped, full blot images are presented in Supplementary Fig. S8.

References

    1. Mostowy S. & Cossart P. Septins: the fourth component of the cytoskeleton. Nat. Rev. Mol. Cell Biol. 13, 183–194 (2012). - PubMed
    1. Fung K. Y., Dai L. & Trimble W. S. Cell and molecular biology of septins. Int. Rev. Cell. Mol. Biol. 310, 289–339 (2014). - PubMed
    1. Kinoshita M., Field C. M., Coughlin M. L., Straight A. F. & Mitchison T. J. Self- and actin-templated assembly of Mammalian septins. Dev. Cell 3, 791–802 (2002). - PubMed
    1. Frazier J. A. et al.. Polymerization of purified yeast septins: evidence that organized filament arrays may not be required for septin function. J. Cell Biol. 143, 737–749 (1998). - PMC - PubMed
    1. DeMay B. S. et al.. Septin filaments exhibit a dynamic, paired organization that is conserved from yeast to mammals. J. Cell Biol. 193, 1065–1081 (2011). - PMC - PubMed

Publication types