

Mammographic density defined by higher than conventional brightness thresholds better predicts breast cancer risk
- PMID: 28338721
- PMCID: PMC5837222
- DOI: 10.1093/ije/dyw212
Mammographic density defined by higher than conventional brightness thresholds better predicts breast cancer risk
Abstract
Background: Mammographic density defined by the conventional pixel brightness threshold, and adjusted for age and body mass index (BMI), is a well-established risk factor for breast cancer. We asked if higher thresholds better separate women with and without breast cancer.
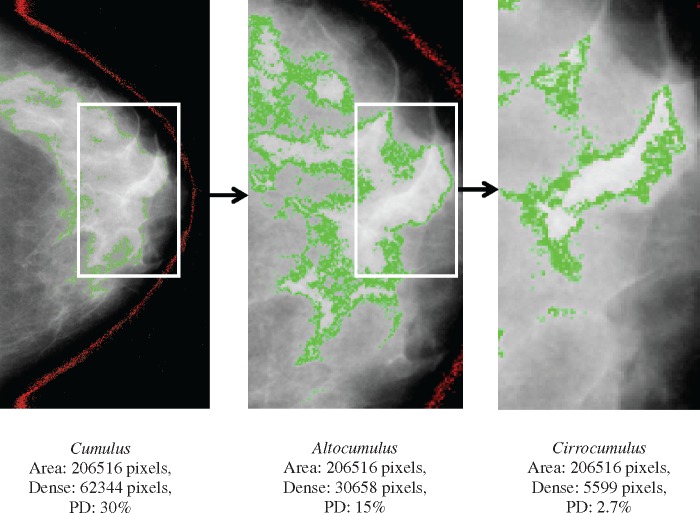
Methods: We studied Australian women, 354 with breast cancer over-sampled for early-onset and family history, and 944 unaffected controls frequency-matched for age at mammogram. We measured mammographic dense area and percent density using the CUMULUS software at the conventional threshold, which we call Cumulus , and at two increasingly higher thresholds, which we call Altocumulus and Cirrocumulus , respectively. All measures were Box-Cox transformed and adjusted for age and BMI. We estimated the odds per adjusted standard deviation (OPERA) using logistic regression and the area under the receiver operating characteristic curve (AUC).
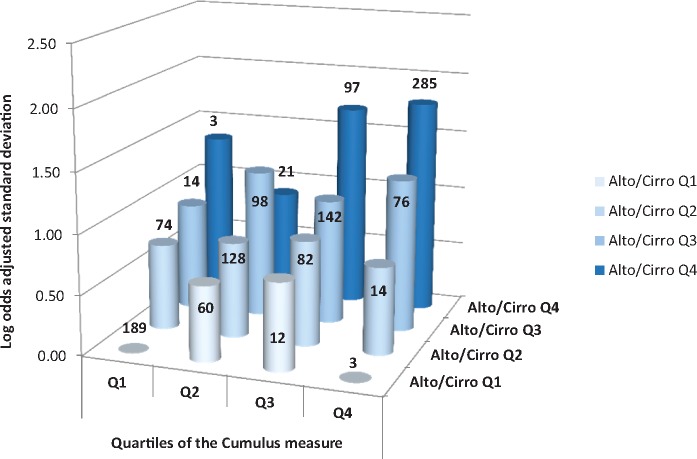
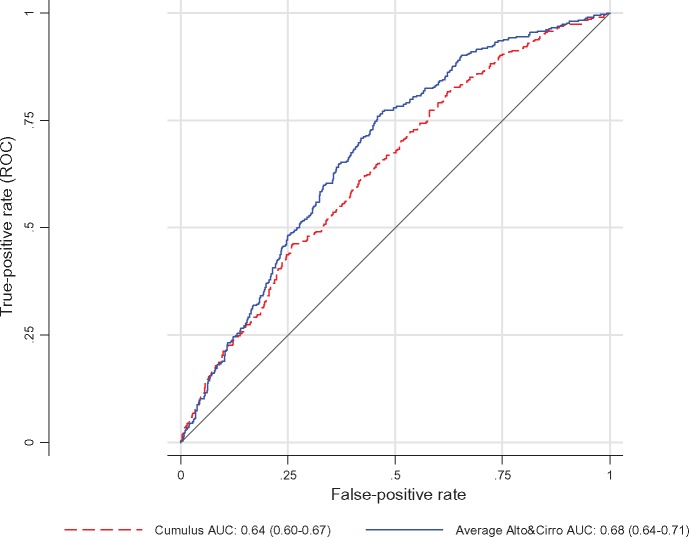
Results: Altocumulus and Cirrocumulus were correlated with Cumulus (r ∼ 0.8 and 0.6 , respectively) . For dense area, the OPERA was 1.62, 1.74 and 1.73 for Cumulus, Altocumulus and Cirrocumulus , respectively (all P < 0.001). After adjusting for Altocumulus and Cirrocumulus , Cumulus was not significant ( P > 0.6). The OPERAs for percent density were less but gave similar findings. The mean of the standardized adjusted Altocumulus and Cirrocumulus dense area measures was the best predictor; OPERA = 1.87 [95% confidence interval (CI): 1.64-2.14] and AUC = 0.68 (0.65-0.71).
Conclusions: The areas of higher mammographically dense regions are associated with almost 30% stronger breast cancer risk gradient, explain the risk association of the conventional measure and might be more aetiologically important. This has substantial implications for clinical translation and molecular, genetic and epidemiological research.
Keywords: Australian women; Breast cancer; case-control study; mammographic density; mammography.
© The Author 2016. Published by Oxford University Press on behalf of the International Epidemiological Association
Figures
References
-
- Byng JW, Yaffe MJ, Jong RA et al. . Analysis of mammographic density and breast cancer risk from digitized mammograms. Radiographics 1998;18:1587–98. - PubMed
-
- Yaffe MJ, Boyd NF, Byng JW et al. . Breast cancer risk and measured mammographic density. Eur J Cancer Prev 1998;7(Suppl 1):S47–55. - PubMed
-
- Byng JW, Boyd NF, Fishell E et al. . The quantitative analysis of mammographic densities. Phys Med Biol 1994;39:1629–38. - PubMed
-
- Boyd NF, Lockwood GA, Byng JW et al. . Mammographic densities and breast cancer risk. Cancer Epidemiol Biomarkers Prev 1998;7:1133–44. - PubMed
-
- Ursin G. [Mammographic density as indicator of breast cancer risk.]. Tidsskr Nor Laegeforen 2003;123:3373–76. - PubMed
Publication types
MeSH terms
Grants and funding
LinkOut - more resources
Full Text Sources
Other Literature Sources
Medical
Molecular Biology Databases
Miscellaneous
