. 2017 May 1;12(5):861-870.
doi: 10.1093/scan/nsx015.

Sensitivity to perception level differentiates two subnetworks within the mirror neuron system

Affiliations

Sensitivity to perception level differentiates two subnetworks within the mirror neuron system

Shiri Simon et al. Soc Cogn Affect Neurosci. .

Abstract

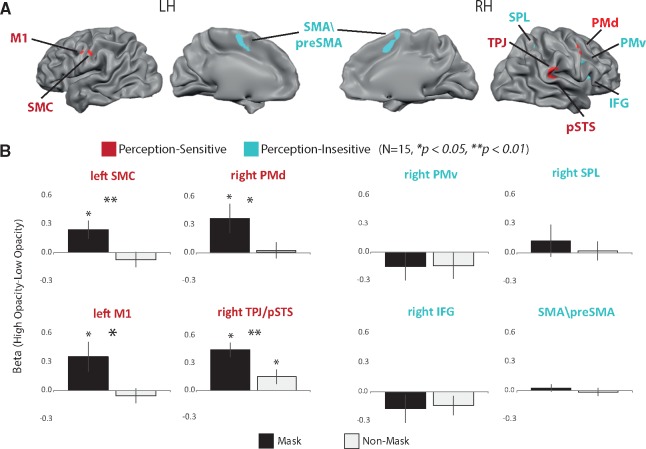
Mirror neurons are a subset of brain cells that discharge during action execution and passive observation of similar actions. An open question concerns the functional role of their ability to match observed and executed actions. Since understanding of goals requires conscious perception of actions, we expect that mirror neurons potentially involved in action goal coding, will be modulated by changes in action perception level. Here, we manipulated perception level of action videos depicting short hand movements and measured the corresponding fMRI BOLD responses in mirror regions. Our results show that activity levels within a network of regions, including the sensorimotor cortex, primary motor cortex, dorsal premotor cortex and posterior superior temporal sulcus, are sensitive to changes in action perception level, whereas activity levels in the inferior frontal gyrus, ventral premotor cortex, supplementary motor area and superior parietal lobule are invariant to such changes. In addition, this parcellation to two sub-networks manifest as smaller functional distances within each group of regions during task and resting state. Our results point to functional differences between regions within the mirror neurons system which may have implications with respect to their possible role in action understanding.

Keywords: action observation; conscious perception; fMRI; mirror neuron system.


Figures

Fig. 1.
Fig. 1.
Experimental design. (A) The experiment included three masked (M) and three non-masked (NM) functional runs presented in alternating fashion. In each run, half of the trials were presented with high target opacity (H) and half of the trials with low target opacity (L) in random order. (B) The ‘M’ runs comprised of a 2-s CFS display (containing one of three different target videos depicting a specific hand movement presented to one eye, and one of the three masking videos of different Mondrian patterns presented to the other eye). The video was followed by an Inter Trial Interval that lasted 8 s of a fixation cross (+). One-third of the ‘M’ condition trials were followed by the participants’ report of their perception. The participants reported which action was presented and their level of confidence on a scale from 1 to 4. The duration of accuracy and confidence reports was limited to 2 s. The ‘NM’ runs comprised of a 2 s presentation of the target videos to the right eye and a blank screen to the left eye, followed by an 8 s inter trial interval (ITI) of fixation cross. We also introduced six execution trials at each ‘NM’ run in which the fixation cross turned red for 6 s, and subjects were instructed to press rapidly and repetitively with both left and right fingers until the fixation cross disappeared.
Fig. 2.
Fig. 2.
Behavioral results. (A) Masking in the low-opacity condition resulted in a sharp drop in perception from ceiling (100% in the NM condition) to 22.7% in the masked condition. In the high opacity trials, perception remained high even with masking (97.9%). Since perception was already at ceiling in the NM low-opacity condition, we did not measure it again in the NM high-opacity condition. Dashed bars therefore represent ceiling performance (based on the corresponding low-opacity NM trials). (B) Out of the trials that were reported seen in the masked condition, 81.1% were correctly recognized in high opacity and 32.1% in low opacity. (C) Most trials in the masked high-opacity condition were rated with the highest confidence level, while most trials in the masked low-opacity condition were rated with the lowest confidence level. All bar graphs represent mean group results (N = 15) ± SEM across subjects.
Fig. 3.
Fig. 3.
Localization of the mirror neuron network. Group level (n = 15) RFX GLM maps (corrected for multiple comparisons with q(FDR) < 0.05) using (A) the contrast of NM observation (high and low opacity) vs rest, (B) the contrast of Execution vs rest and (C) the conjunction of (A) and (B). Regions of interest (ROIs) were defined according to this conjunction.
Fig. 4.
Fig. 4.
Differential Sensitivity to Perception level within the mirror neuron network. (A) The conjunction map from Figure 3C, color coded according to sensitive and insensitive regions. Red color coded ROIs were found sensitive to the level of action perception beyond changes in opacity level, whereas the blue color coded ROIs were found insensitive to perception level as defined from the analysis in (B). (B) For each ROI the beta differences between high and low opacities were separately calculated in the masked and NM conditions. In the Masked condition, changes in opacity level corresponded with strong changes in perception level (see figure 2) while in the NM condition perception was not affected. Changes in opacity level resulted in larger beta differences in the masked condition relative to NM condition in the right pMd, right TPJ, left M1 and left SMC. This suggests stronger sensitivity to perception level in these regions (*P < 0.05, **P < 0.01, error bars represent standard error).
Fig. 5.
Fig. 5.
Functional distances during the experiment time course. (A) Correlation matrix between MNS ROIs based on the concatenated time-courses from all functional runs (see Methods for details). Bold lines delineate the sensitive (red) and insensitive (blue) ROIs as revealed in the GLM analysis. (B) Two-dimensional plot of all functional distances between ROIs using MDS (based on the distance matrix in A). The distances within each group of ROIs (sensitive/insensitive to perception level) are significantly smaller than the distances between the groups (see text).

References

    1. Avenanti A., Annella L., Candidi M., Urgesi C., Aglioti S.M. (2013). Compensatory plasticity in the action observation network: virtual lesions of STS enhance anticipatory simulation of seen actions. Cerebral Cortex, 23(3), 570–80. - PubMed
    1. Benjamini Y., Hochberg Y. (1995). Controlling the false discovery rate: a practical and powerful approach to multiple testing. Journal of the Royal Statistical Society. Series B (Methodological), 57(1), 289–300.
    1. Bien N., Roebroeck A., Goebel R., Sack A.T. (2009). The Brain's intention to imitate: the neurobiology of intentional versus automatic imitation. Cerebral Cortex, 19(10), 2338–51. - PubMed
    1. Bischoff M., Zentgraf K., Pilgramm S., Stark R., Krueger B., Munzert J. (2014). Anticipating action effects recruits audiovisual movement representations in the ventral premotor cortex. Brain and Cognition, 92, 39–47. - PubMed
    1. Borg I., Groenen P.J. (2005). Modern Multidimensional Scaling: Theory and Applications. Springer Science & Business Media.