. 2017 Mar 24;12(3):e0174395.
doi: 10.1371/journal.pone.0174395. eCollection 2017.

Morphological and morphometric specializations of the lung of the Andean goose, Chloephaga melanoptera: A lifelong high-altitude resident

Affiliations

Morphological and morphometric specializations of the lung of the Andean goose, Chloephaga melanoptera: A lifelong high-altitude resident

John N Maina et al. PLoS One. .

Abstract

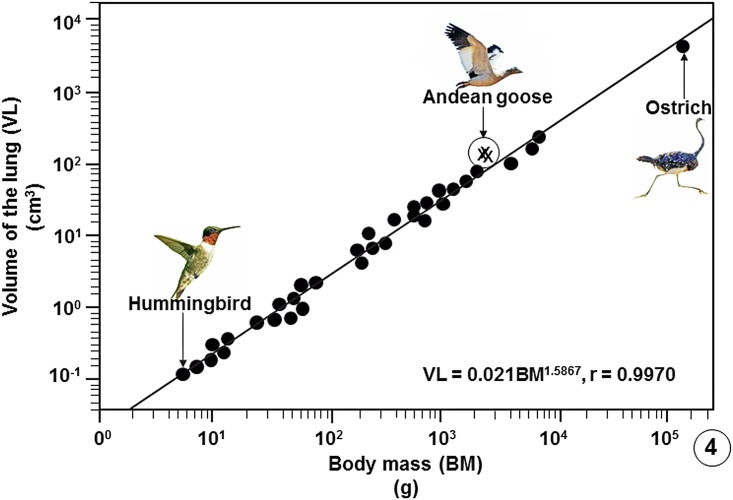
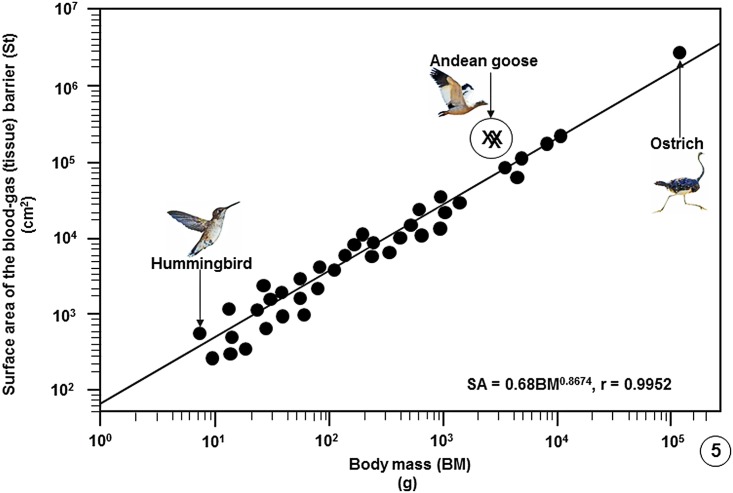
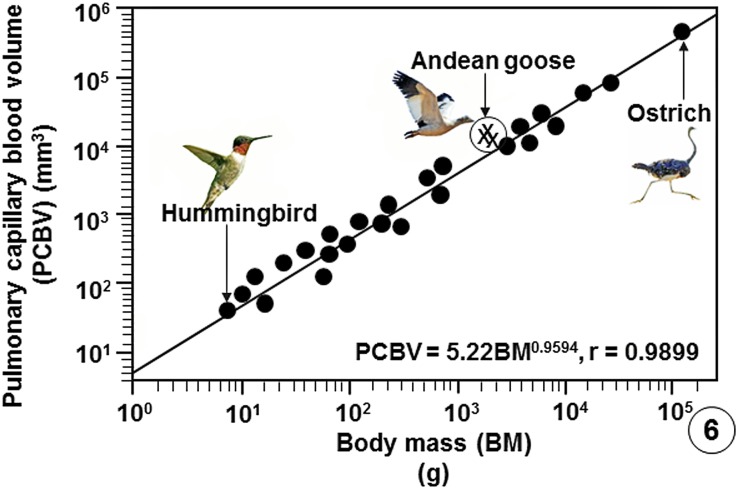
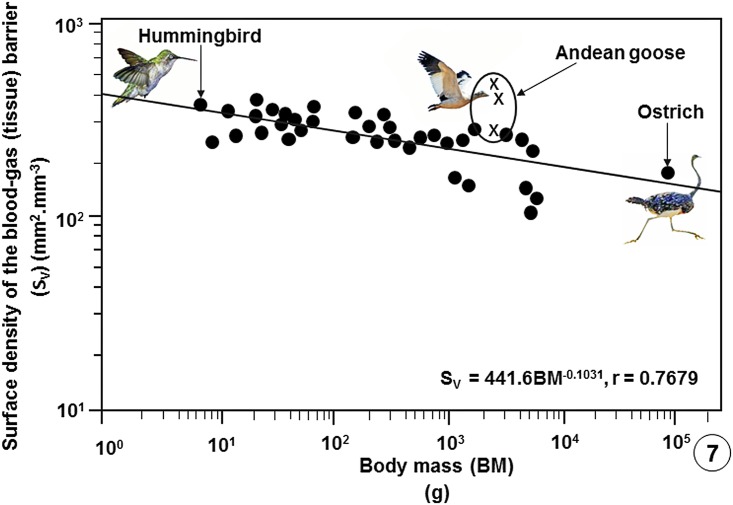
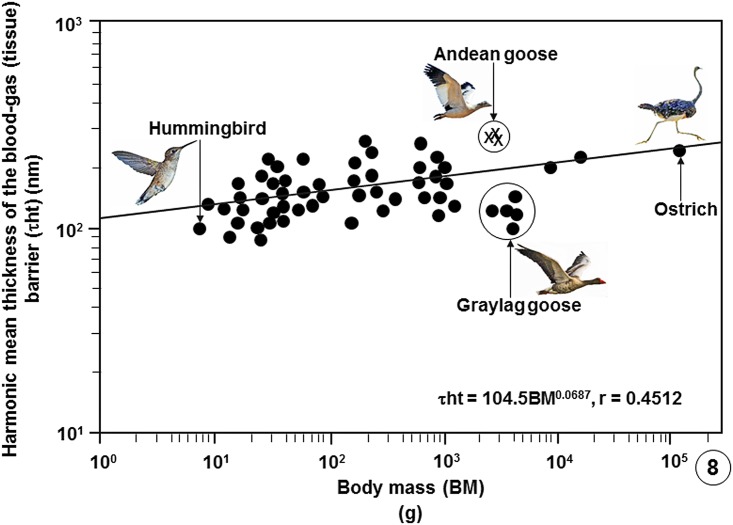
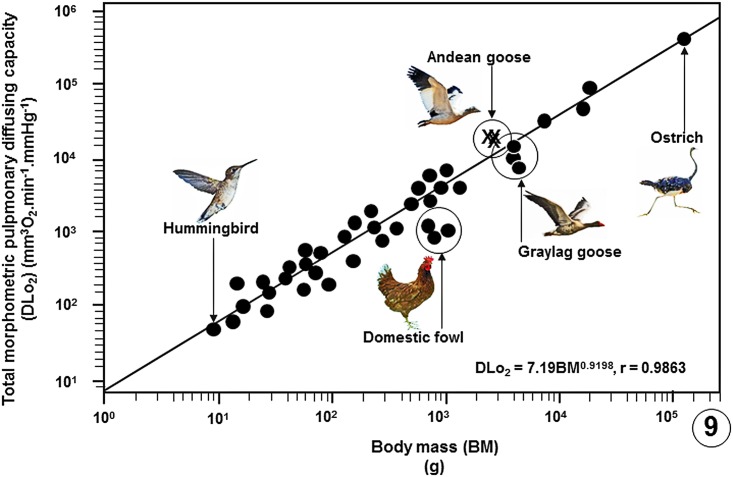
High altitude flight in rarefied, extremely cold and hypoxic air is a very challenging activity. Only a few species of birds can achieve it. Hitherto, the structure of the lungs of such birds has not been studied. This is because of the rarity of such species and the challenges of preparing well-fixed lung tissue. Here, it was posited that in addition to the now proven physiological adaptations, high altitude flying birds will also have acquired pulmonary structural adaptations that enable them to obtain the large amounts of oxygen (O2) needed for flight at high elevation, an environment where O2 levels are very low. The Andean goose (Chloephaga melanoptera) normally resides at altitudes above 3000 meters and flies to elevations as high as 6000 meters where O2 becomes limiting. In this study, its lung was morphologically- and morphometrically investigated. It was found that structurally the lungs are exceptionally specialized for gas exchange. Atypically, the infundibulae are well-vascularized. The mass-specific volume of the lung (42.8 cm3.kg-1), the mass-specific respiratory surface area of the blood-gas (tissue) barrier (96.5 cm2.g-1) and the mass-specific volume of the pulmonary capillary blood (7.44 cm3.kg-1) were some of the highest values so far reported in birds. The pulmonary structural specializations have generated a mass-specific total (overall) pulmonary morphometric diffusing capacity of the lung for oxygen (DLo2) of 0.119 mlO2.sec-1.mbar-1.kg-1, a value that is among some of the highest ones in birds that have been studied. The adaptations of the lung of the Andean goose possibly produce the high O2 conductance needed to live and fly at high altitude.


Conflict of interest statement

Competing Interests: The authors have declared that no competing interests exist.

Figures

Fig 1
Fig 1. Lung, parabronchi and interparabronchial septa of the lung of the Andean goose (Chloephaga melanoptera).
(A) Medial- and lateral (insert) views of the cone-shaped lung. •, costovertebral sulci; SB, secondary bronchi; circle, hilum. (B) Transverse slices of the lung showing large blood vessels (⋆), secondary bronchi (SB), a primary bronchus (Pr), paleopulmonic parabronchi (PP), neopulmonic parabronchi (NP) and a costovertebral sulcus (•). (C, D) Histological- (C) and scanning electron (D) micrographs showing parabronchial lumina (PL) that are surrounded by parenchyma (Pa). ⋆, interparabronchial blood vessels; *, intraparabronchial blood vessels; circle (O), areas where interparabronchial septa exist; square (□), areas where interparabronchial septa are missing. The area bounded by the dashed outline in D is enlarged on 2B. (E, F) Toluidine blue stained- (E) and scanning electron (F) micrographs showing interparabronchial septa (circle, O). Pa, parenchyma; ⋆, interparabronchial blood vessels; *, intraparabronchial blood vessels; •, air capillaries; ↑, blood capillaries; If, infundibulae.
Fig 2
Fig 2. Parabronchi, interparabronchial septa and infundibulae of the lung of the Andean goose (Chloephaga melanoptera).
(A, B) Histological- (A) and scanning electron (B) micrographs of the lung showing a secondary bronchus (Sb) giving rise to a parabroncus (Pb) (A) and an interparabronchial artery (⋆) giving rise to intraparabronchial arteries (*) (B). PL, parabronchial lumina; Pa, parenchyma; circle (O), areas where interparabronchial septa exist; square (□), areas where interparabronchial septa are missing; arrows, atria; open double sided arrow (B), area where adjacent parabronchi anastomose. The area shown in figure B is an enlargement of the dashed enclosed area in Fig 1D. (C-F) Histological- (C) and scanning electron (Figs D-F) micrographs showing the intense vascularization of the infundibulae (↑) (C-E) and dashed circles (F). PL (C), parabronchial lumen; ⋆ (C), intraparabronchial blood vessel; AM (D, F), atrial muscle; At (D, F), atria; ►, blood capillaries; •, air capillaries; Er (E), erythrocytes.
Fig 3
Fig 3. Infundibulae, air capillaries, blood capillaries and the blood-gas (tissue) barrier of the lung of the domestic fowl (Gallus gallus variant domesticus) and the Andean goose (Chloephaga melanoptera).
(A) A scanning electron micrograph showing an avascular infundibulum (dashed circle) of the lung of the domestic fowl. AM, atrial muscle. (B) Scanning electron micrograph of the lung of the Andean goose (Chloephaga melanoptera) showing an air capillary (* encircled by a dashed circle) which is surrounded by a single blood capillary (⋆). Er, erythrocytes. (C) Scanning electron micrograph showing lung parenchyma with extravasated erythrocytes (Er) that correspond in size (diameter) with those of the air capillaries (•). Some of the air capillaries are outlined with dashes lines. •, air capillaries; ►, blood capillaries. In the insert, an erythrocyte (Er) has slotted into an air capillary. (D, E) Low- (D) and high (E) magnification transmission electron micrographs showing air capillaries (*) and blood capillaries (⋆). In E, a blood capillary (⋆) is almost completely surrounded by air in the air capillaries (*). ↑, epithelial-epithelial cells connections; □, blood-gas (tissue) barrier; Er, erythrocytes; circle (O), blood capillary-blood capillary connection. (F) High magnification transmission electron micrograph showing the structure of the blood-gas (tissue) barrier. It [blood-gas (tissue) barrier] consists of an epithelial cell (Ep), an endothelial cell (En) and a basement membrane (BM). ⋆, blood capillary; *, air capillary. The insert shows a logarithmic scale that was used to determine the harmonic mean thickness of the blood-gas (tissue) barrier and that of the total barrier.
Fig 4
Fig 4. Regression line plotted on logarithmic x-y axes showing the correlation between the Volumes of the Lungs (VL) of birds on which data are available against Body Masses (BM).
The values of the three specimens of the Andean goose (Chloephaga melanoptera) that were investigated in this study lie above the common regression line of the bird population. The data on which the regression line was plotted are summarized in publications [33], [37], [39] and [–56] and are given in data supporting this paper (S8 Table).
Fig 5
Fig 5. Regression line plotted on logarithmic x-y axes showing the correlation between the surface areas of the blood-gas (tissue) barriers (St) of the lungs of birds on which data are available against Body Masses (BM).
The values of the three specimens of the Andean goose (Chloephaga melanoptera) that were investigated in this study lie above the regression line of the bird population. The data on which the regression line was plotted are summarized in publications [33], [37], [39] and [–56] and are given in data supporting this paper (S8 Table).
Fig 6
Fig 6. Regression line plotted on logarithmic x-y axes showing the correlation between the Pulmonary Capillary Blood Volume (PCBV) of the lungs of birds that have been studied against Body Masses (BM).
The values of the three specimens of the Andean goose (Chloephaga melanoptera) that were investigated in this study lie above the regression line of the bird population. The data on which the regression line was plotted are summarized in publications [33], [37], [39] and [–56] and are given in data supporting this paper (S8 Table).
Fig 7
Fig 7. Regression line plotted on logarithmic x-y axes showing the correlation between the surface densities of the blood-gas (tissue) barriers per unit volume of the lung parenchyma (SV) of the lungs of the birds that have been studied against Body Masses (BM).
The values of the three specimens of the Andean goose (Chloephaga melanoptera) investigated in this study lie above the common regression line of the bird population. The data on which the regression line was plotted are summarized in publications [33], [37], [39] and [–56] and given in data supporting this paper (S8 Table).
Fig 8
Fig 8. Regression line plotted on logarithmic x-y axes showing the correlation between the harmonic mean thicknesses of the blood-gas (tissue) barriers (τht) of the lungs of birds that have been studied against Body Masses (BM).
The values of the three specimens of the Andean goose (Chloephaga melanoptera) investigated in this study lie above the common regression line of the bird population. Showing that the tissue barrier of the Andean goose is not particularly thin, the tissue barrier of the relatively larger, low altitude dwelling greylag goose (Anser anser) is relatively much thinner. The data on which the regression line was plotted are summarized in publications [33], [37], [39] and [–56] and given in data supporting this paper (S8 Table).
Fig 9
Fig 9. Regression line plotted on logarithmic x-y axes showing the correlation between the total morphometric pulmonary diffusing capacities of the lungs for oxygen (DLo2) of the birds that have been studied against Body Masses (BM).
The values of the three specimens of the Andean goose (Chloephaga melanoptera) that were investigated in this study lie above the common regression line of the bird population. The data on which the regression line was plotted are summarized in publications [33], [37], [39] and [–56] and given in data supporting this paper (S8 Table).

Similar articles

Cited by

References

    1. Gehr P, Mwangi DK, Ammann A, Maloiy GMO, Taylor CR, Weibel ER. Design of the mammalian respiratory system: V. Scaling morphometric diffusing capacity to body mass: wild and domestic animals. Respir Physiol. 1981; 44:61–86. - PubMed
    1. Suarez RK, Darveau CA, Childress JJ. Metabolic scaling: a many-spleandoured thing. Comp Biochem Physiol B, Biochem Mol Biol. 2004; 139:531–541. 10.1016/j.cbpc.2004.05.001 - DOI - PubMed
    1. White CR, Kearney MR. Metabolic scaling in animals: methods, empirical results and theoretical explanations. Comp Physiol. 2014; 4:231–256. - PubMed
    1. Gillooly JF, Gomez JP, Mavrodiev EV, Rong Y, McLamore ES. Body mass scaling of passive oxygen diffusion in endotherms and ectotherms. Proc Natl Acad Sci, USA. 2016; 113:5340–5345. 10.1073/pnas.1519617113 - DOI - PMC - PubMed
    1. Black CP, Tenney SM. Oxygen transport during progressive hypoxia in high altitude and sea level water-fowl. Respir Physiol. 1980; 39:217–239. - PubMed