. 2018 Mar 14;35(1):79-119.
doi: 10.1093/imammb/dqw021.

The effects of interleukin-2 on immune response regulation

Affiliations

The effects of interleukin-2 on immune response regulation

Ryan S Waters et al. Math Med Biol. .

Abstract

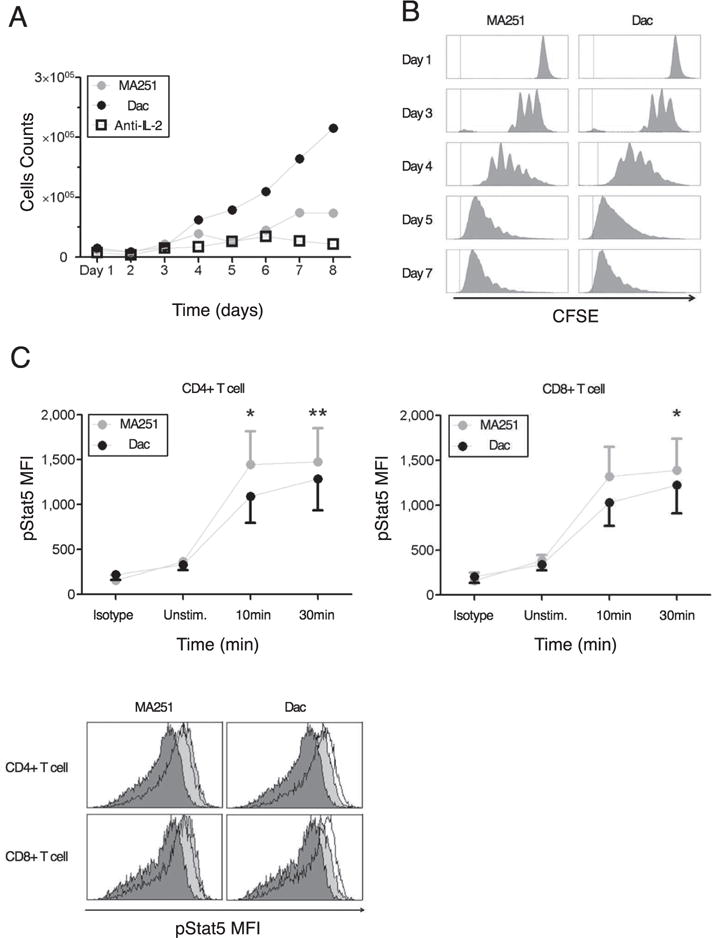
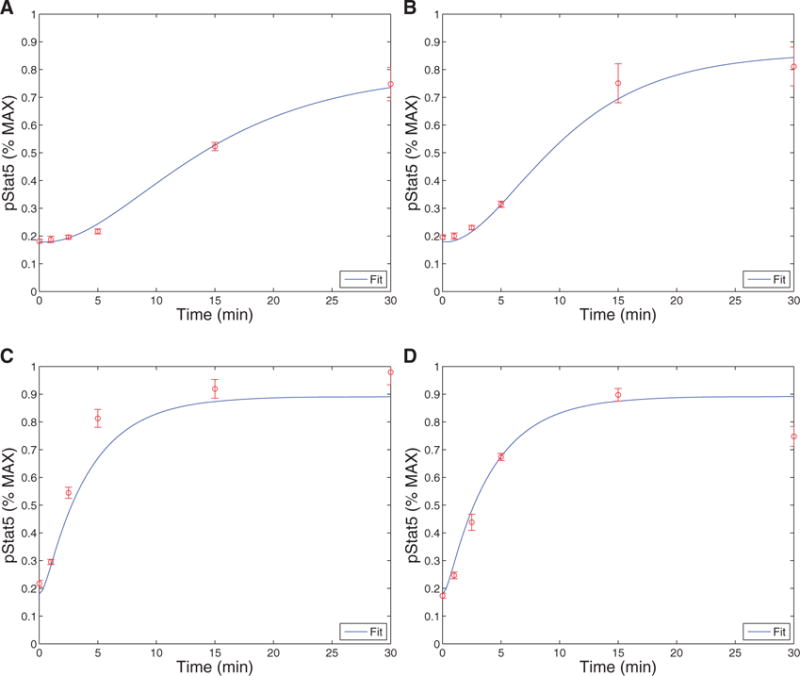
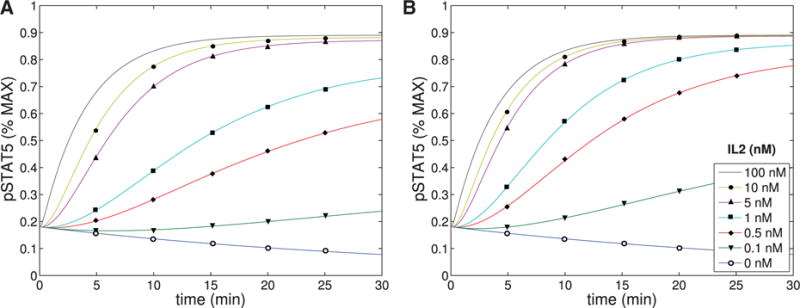
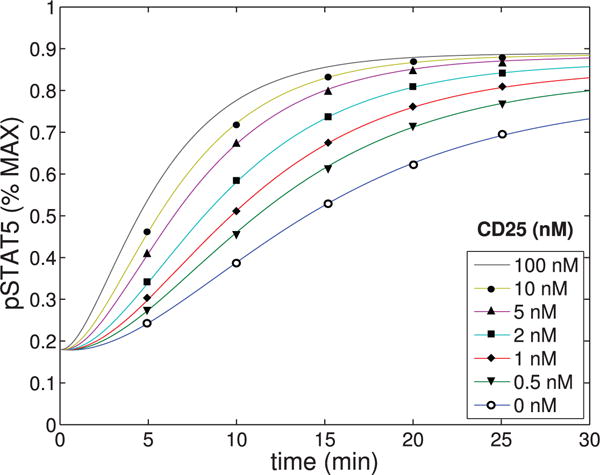
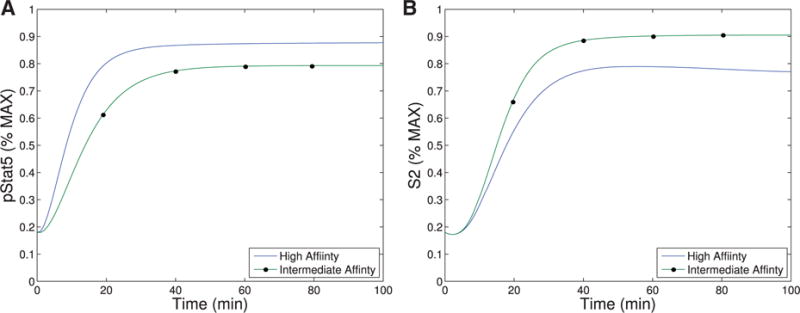
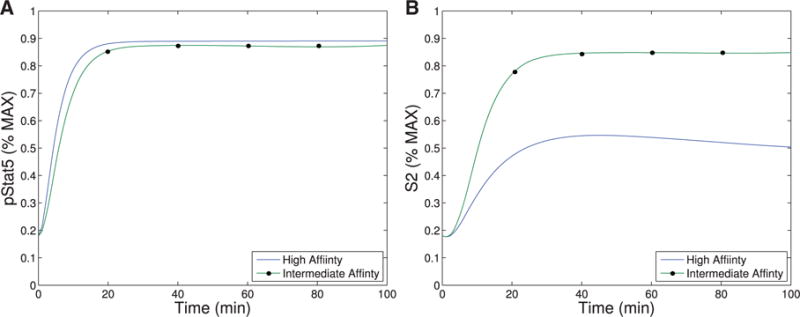
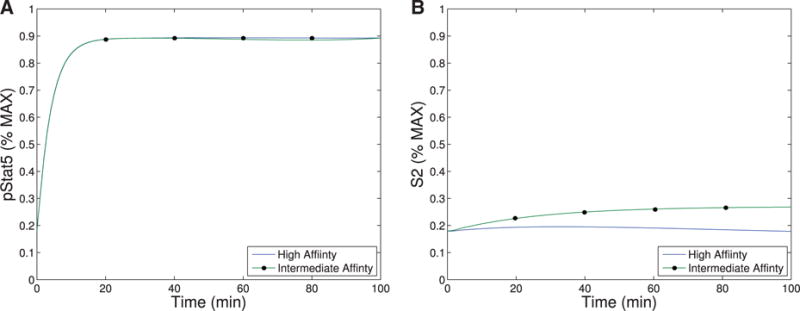
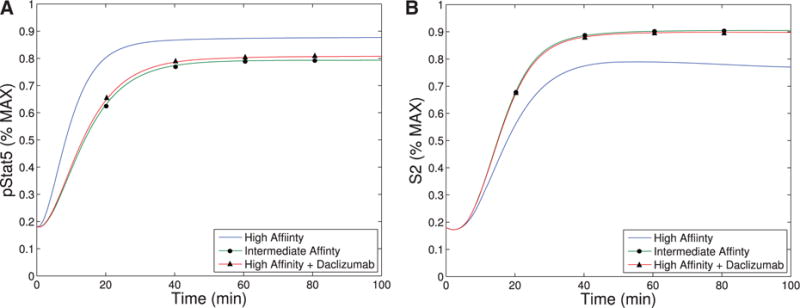
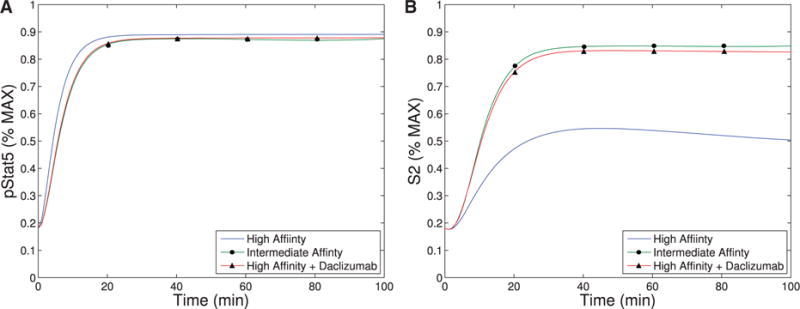
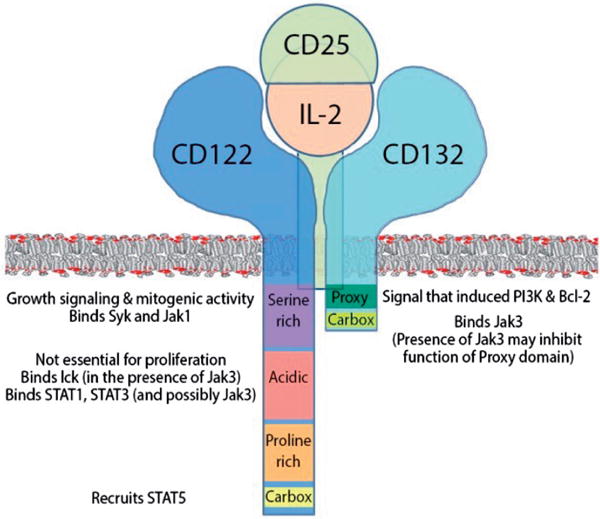
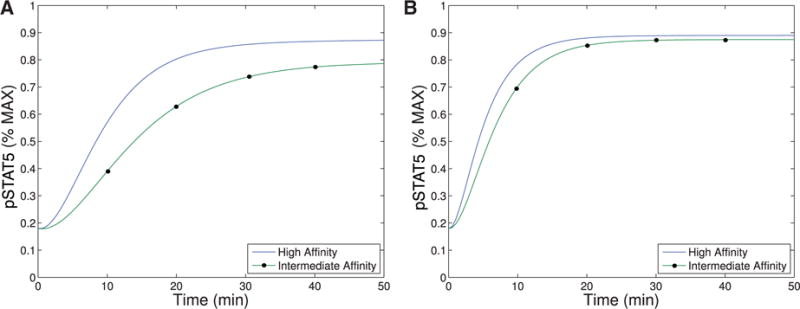
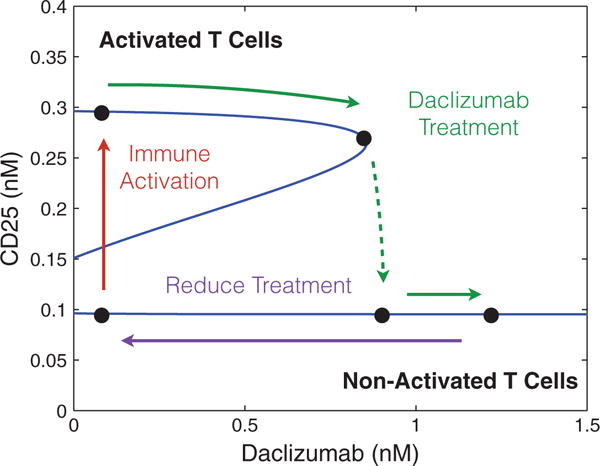
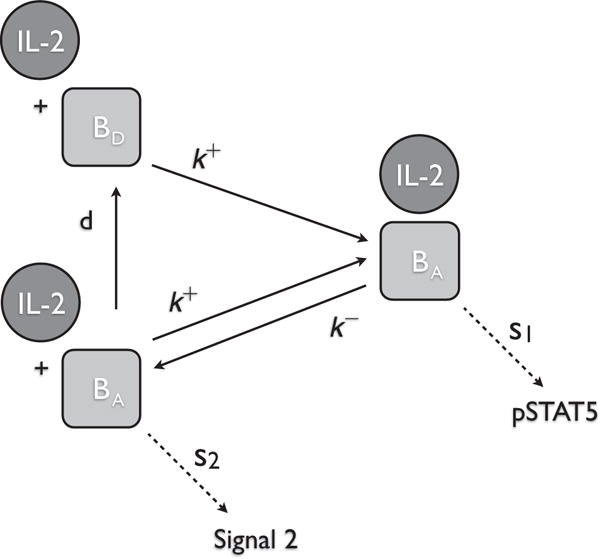
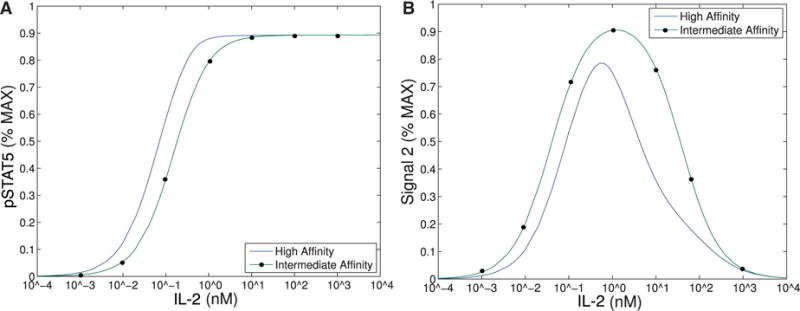
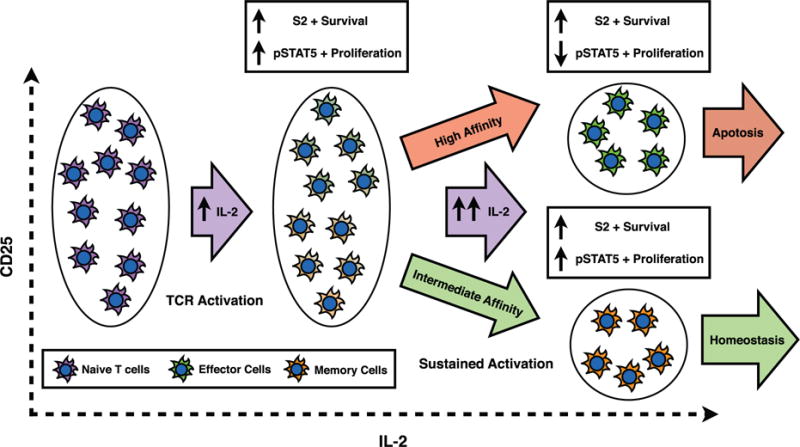
The immune system has many adaptive and dynamic components that are regulated to ensure appropriate, precise and rapid response to a foreign pathogen. A delayed or inadequate immune response can lead to prolonged disease, while an excessive or under-regulated response can lead to autoimmunity. The cytokine, interleukin-2 (IL-2) and its receptor IL-2R play an important role in maintaining this balance.The IL-2 receptor transduces pSTAT5 signal through both the intermediate and high affinity receptors, which differ from each other by the presence of CD25 chain in IL-2 receptor. We present experimental data on the kinetics of pSTAT5 signalling through both of the receptors and develop a model that captures this kinetics. We then use this model to parameterize key aspects of two additional models in which we propose and study two different mechanisms by which IL-2 receptor can transduce distinct signals leading to either an activated or a non-activated cell state. We speculate that this initial state differentiation, perhaps enhanced by downstream feedbacks, may eventually lead to differential cell fates.Our result shows that non-linear dynamical models can suggest resolution of a puzzling array of seemingly contradictory experimental results on IL-2 effect on proliferation and differentiation of T-cells.


Figures

Fig. A1
Fig. A1
Daclizumab does not inhibit proliferation of activated T cells, but prolongs their survival, while exerting little effect on IL-2 induced STAT5 phosphorylation. (A) Activated T cells were cultured with MA251 or Daclizumab (Dac) for 8 days. Absolute counts of cells were determined by flow cytometry. (B) CFSE-stained activated T cells were cultured for 7 days. Proliferation of activated T cells with high-affinity(MA251) or intermediate-affinity(Dac) IL-2R was determined by flow cytometry. (C) Phosphorylation of STAT5 by measuring mean fluorescent intensity (MFI) at 10 and 30 minutes after exogenous IL-2 is given.
Fig. A2
Fig. A2
Model fits to the data from Ring et al. (2012). The experiments were run in triplicate. The plots show the model curve (curve) plotted with the experimental data. Figures (A) and (B) show the production of pSTAT5 over time for cells with no CD25 in the case of low (1 nM) and high (500 nM) IL-2, respectively. Figures C and D also shows the production of pSTAT5 over time except for cells with CD25, again in the case of low (1 nM) and high (500 nM) IL-2. Note that 5 parameters and two initial conditions were estimated by fitting this data (R2 = 0.9588).
Fig. A3
Fig. A3
The concentration of pSTAT5 was plotted as a function of time for varying concentrations of IL-2 (0–100 nM) for both intermediate (A) and high (B) affinity receptors. The parameters shown in Tables A1–A4 were used.
Fig. A4
Fig. A4
The concentration of pSTAT5 was plotted as a function of time for varying concentrations of IL-2Rα. The parameters shown in Tables A1–A4 were used.
Fig. A5
Fig. A5
The figures represent different plots of f (x) (curve) and g(x) (line) for fixed V, three different values of C, and K chosen such that f (x) and g(x) intersect at the point of inflection of f (x). (A) shows the plots for a value of C satisfying (3.4) specifically as a strict inequality. (B) shows the plots for a value when (3.4) is satisfied as an equality. (C) represents a value of C that satisfies (3.5).
Fig. A6
Fig. A6
This figure plots f (x) (curve) and g(x) (in lines) for different values of K. (A) Notice that when (3.4) is satisfied there is only one equilibrium for all values of K. (B) Alternately when (3.5) is satisfied, then we see bistability for some values of K.
Fig. A7
Fig. A7
The Hill functions, given by 3.2, were fitted to data generated by Model I for fixed concentration of IL-2 and CD122 at 0.1 nM. The data generated from Model I was the equilibrium concentration of bound receptors as a function of increased concentration of CD25. Each curve represents a different fixed concentration of Daclizumab.
Fig. A8
Fig. A8
The Hill curves in Figure A7 are produced at different concentration of Daclizumab and differ by the value of K0. Here we plot the values of K0 as a function of Daclizumab, along with the quadratic line of best fit (least squares) of these values.
Fig. A9
Fig. A9
For low levels of IL-2 concentration, difference in concentration of S2, (B), for the intermediate-affinity versus high-affinity receptor (~12%) does not provide a significant advantages over the difference in pSTAT5 signalling, (A), between these receptors (~9%).
Fig. A10
Fig. A10
For moderate levels of IL-2 concentration, the difference in concentration of S2, (B), for the intermediate-affinity versus high-affinity receptor (~33%) provides a significant advantages over the difference in pSTAT5 signalling, (A), between these receptors (~1%).
Fig. A11
Fig. A11
For high levels of IL-2 concentration, the difference in concentration of S2, (B), for the intermediate-affinity versus high-affinity receptor remains ~10% while the difference in pSTAT5 signalling, (A), between these receptors is virtually indistinguishable.
Fig. A12
Fig. A12
This figure plots the pSTAT5 signal (A) and S2 signal (B) for cells with CD25, which will demonstrate primarily high-affinity signalling (curve without circle or triangle), cells without CD25 (which can only have intermediate affinity signalling) with circle, and cells with CD25, but that have had their high affinity signalling blocked by Daclizumab (triangle). All three cases are for extracellular concentrations of IL-2 of 1 nM.
Fig. A13
Fig. A13
This figure plots the pSTAT5 signal (A) and S2 signal (B) for IL-2 concentration of 5 nM for cells with CD25 (without circle or triangle), cells without CD25 (circle) and cells with CD25 treated with Daclizumab (triangle).
Fig. 1
Fig. 1
Schematic depiction of IL-2R chains, their intracellular domains and their putative function, assembled based on the literature review. The IL-2R complex is not pre-assembled before IL-2 binding: CD25, IL-2 or CD122 alone (without bound IL-2) have no measurable affinity for CD132; instead, IL-2 is required for the assembly of signalling complex. IL-2 can bind CD25 (low-affinity IL-2R; Kd ≈ 10nM) and CD122 (Kd ≈ 100nM), which, associated with CD132 upon IL-2 binding, form an intermediate affinity IL-2R (Kd ≈ 1nM). When CD25 associated with CD122, it increases IL-2 binding to CD122 approximately 100 fold and this tertiary complex then recruits CD132 to form high affinity IL-2R (Kd 10-50pM) (Wang & Smith, 1987). In the quaternary IL-2R structure, IL-2 makes separate contacts with IL-2Rα (CD25), -β (CD122) and common γ -chain (CD132). CD25 makes no contact with either CD122 or CD132.
Fig. 2
Fig. 2
This figure shows qualitative matches to data presented in Fig. A1.C. In particular, Figure (A)plots the production of pSTAT5 for high and intermediate affinity IL-2 receptors for cells treated with 1 nM IL-2. Notice that there is delayed production of pSTAT5 associated with the intermediate affinity receptor with the equilibrium concentration being only slightly lower (< 10%). Figure (B) shows the prediction of the model if we instead treat with a moderate levels of IL-2 (5 nM). In this case, the differences in equilibrium concentration decrease significantly (< 2%) and the kinetic differences become very small as well.
Fig. 3
Fig. 3
(A) shows the regions of parameter values of V and C where bistability is possible for different values of n. As n is increase, the size of the region expands. This figure does not show the effect of the parameter K on the size of the region of bistability. (B) shows the regions of parameter space in IL-2 and CD122 from Model I satisfying (A3.16) for different values of n. In particular, values to the left and below the curves represent values of CD122 and IL-2 where bistability is possible for different fixed values of n. Specifically, the curves plotted are for n = {0.5, 1, 1.5, 2, 2.5, 3}, as labelled on the legend.
Fig. 4
Fig. 4
The figure demonstrates a saddle node bifurcation caused by adjusting the concentration of Daclizumab in the system for specific values of IL-2 and CD122 (0.1 nM of each). Values for V0, C0, K0 and n were determined by fitting data produced by Model I. Additionally, rsds and dαpαpS were chosen to ensure the model demonstrated bistability when the concentration of Daclizumab was zero.
Fig. 5
Fig. 5
When IL-2 is bound to CD122 (either in the form of high- or intermediate-affinity receptor) as shown for the intermediate-affinity receptor, then the complex will preferentially produce pSTAT5. Alternately, when CD122 is ‘activated’, but IL-2 is not bound, then the complex will preferentially produce Signal 2.
Fig. 6
Fig. 6
This figure demonstrates the range of IL-2 that could support bistability based solely on intracellular signal, pSTAT5 (Model II), versus both intracellular signals, pSTAT5 and Signal 2 (Model III). (A) Bistability in Model II can only occur where the difference between intermediate- and high-affinity signals are distinguishable, that is approximately in range 10−3–10 nM. See text for detailed explanation. (B) Signal 2 shows difference between intermediate and high affinity receptor over a much larger range of IL-2 that extends to much larger concentrations of IL-2.
Fig. 7
Fig. 7
Human naive T cells, other than T-regs, are generally CD25 negative, but fully activated T cells have a broad range of initial CD25 concentrations (Feinerman et al., 2010), perhaps because during the TCR activation, DCs transpresent CD25 and may provide different CD25 support to different cells (Wuest et al., 2011). As the immune response continues, cytokines will be produced by both T cells and B cells. Depending on the initial concentration of CD25 as well as the level of TCR stimulation, each individual cell will receive different levels of high- versus intermediate-affinity signalling. While cytokine signalling is still at moderate levels, all cell types will receive both proliferation and survival signals (pSTAT5 and S2). However, as activation is sustained and the levels of IL-2 continue to increase, the response signals will change. At higher levels of IL-2, cells receiving primarily intermediate affinity signalling will still be receiving both proliferation and survival signals, while those cells receiving mostly high affinity signalling will no longer receive the survival signals (See Fig. 6). Ultimately, this will lead to homeostasis in cells receiving intermediate affinity signalling, while those cells receiving high-affinity signalling will be prone to apoptosis.

References

    1. Batchelor E, Caroline M, Loewer A, Lahav G. Stimulus-dependent dynamics of p53 in single cells. Mol Syst Biol. 2011;7:488. doi: 10.1038/msb.2011.20. - DOI - PMC - PubMed
    1. Bielekova B. Daclizumab therapy for multiple sclerosis. Neurotherapeutics. 2013;10:55–67. - PMC - PubMed
    1. Bielekova B, Catalfamo M, Reichert-Scrivner S, Packer A, Cerna M, Waldmann TA, McFarland H, Henkart PA, Martin R. Regulatory cd56(bright) natural killer cells mediate immunomodulatory effects of il-2ralpha-targeted therapy (daclizumab) in multiple sclerosis. Proc Natl Acad Sci USA. 2006;103:5941–5946. - PMC - PubMed
    1. Bielekova B, Richert N, Herman ML, Ohayon J, Waldmann TA, McFarland H, Martin R, Blevins G. Intrathecal effects of daclizumab treatment of multiple sclerosis. Neurology. 2011;77:1877–1886. - PMC - PubMed
    1. Bielekova B, Richert N, Howard T, Blevins G, Markovic-Plese S, McCartin J, Frank JA, Wurfel J, Ohayon J, Waldmann TA, McFarland HF, Martin R. Humanized anti-cd25 (daclizumab) inhibits disease activity in multiple sclerosis patients failing to respond to interferon beta. Proc Natl Acad Sci USA. 2004;101:8705–8708. - PMC - PubMed

Publication types

MeSH terms

LinkOut - more resources