. 2017 Jul 1;19(7):951-964.
doi: 10.1093/neuonc/now297.

VDAC1 is a molecular target in glioblastoma, with its depletion leading to reprogrammed metabolism and reversed oncogenic properties

Affiliations

VDAC1 is a molecular target in glioblastoma, with its depletion leading to reprogrammed metabolism and reversed oncogenic properties

Tasleem Arif et al. Neuro Oncol. .

Erratum in

  • Corrigenda.
    [No authors listed] [No authors listed] Neuro Oncol. 2017 Nov 29;19(12):1701. doi: 10.1093/neuonc/nox102. Neuro Oncol. 2017. PMID: 28655211 Free PMC article. No abstract available.

Abstract

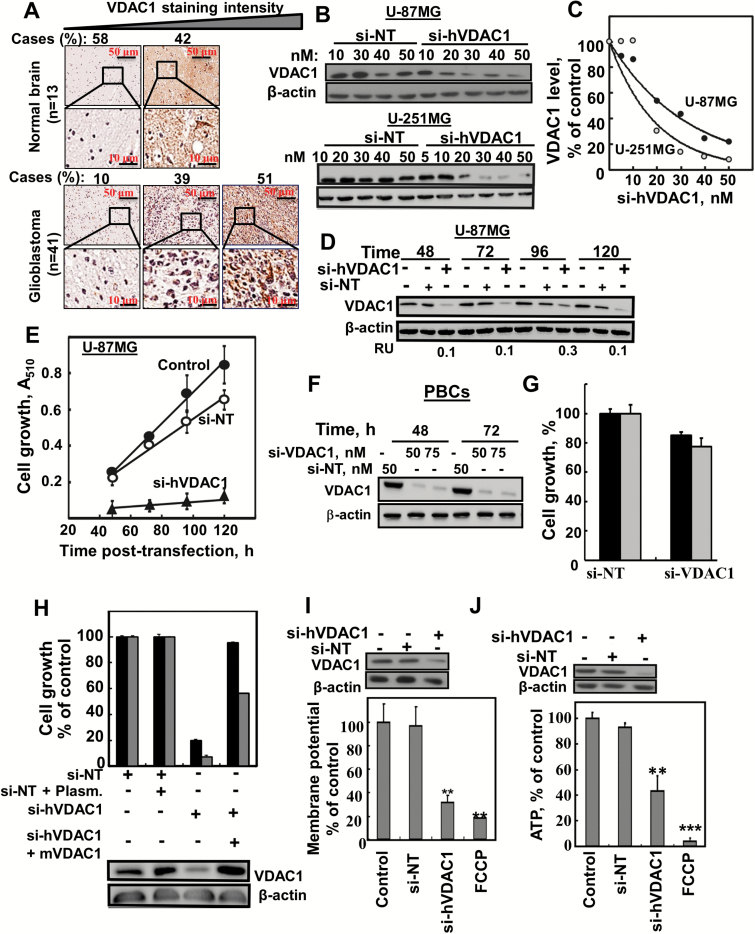
Background: Glioblastoma (GBM), an aggressive brain tumor with frequent relapses and a high mortality, still awaits an effective treatment. Like many cancers, GBM cells acquire oncogenic properties, including metabolic reprogramming, vital for growth. As such, tumor metabolism is an emerging avenue for cancer therapy. One relevant target is the voltage-dependent anion channel 1 (VDAC1), a mitochondrial protein controlling cell energy and metabolic homeostasis.

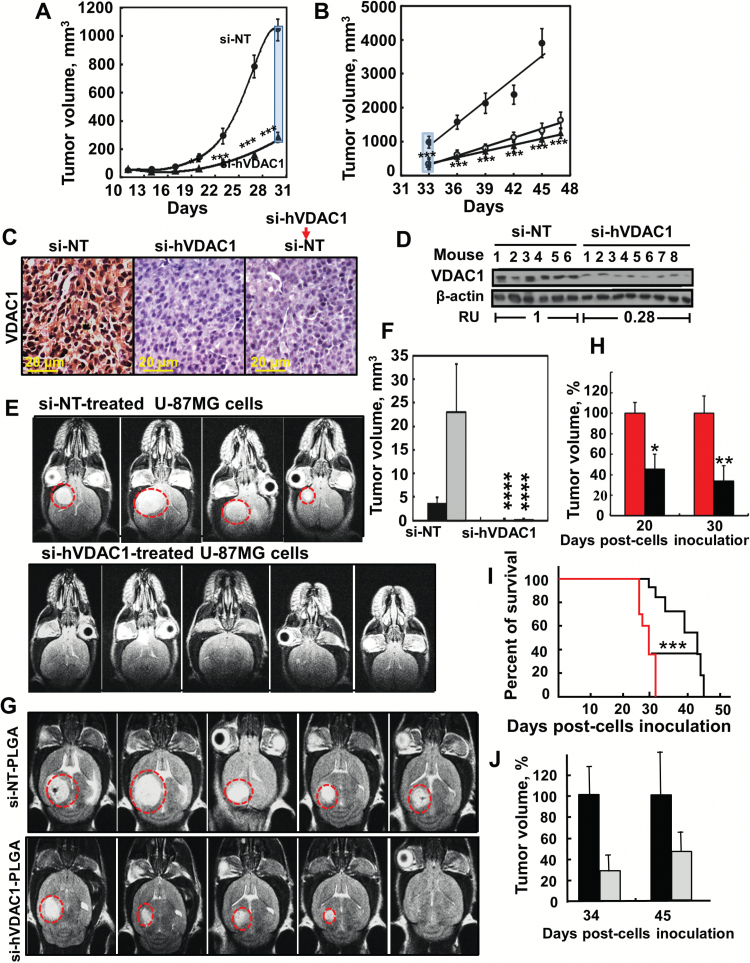
Methods: We used VDAC1-specific short interfering (si)RNA (si-VDAC1) to treat GBM cell lines and subcutaneous or intracranial-orthotopic GBM xenograft mouse models. Tumors were monitored using MRI, immunohistochemistry, immunoblotting, immunofluorescence, quantitative real-time PCR, transcription factor expression, and DNA microarray analyses.

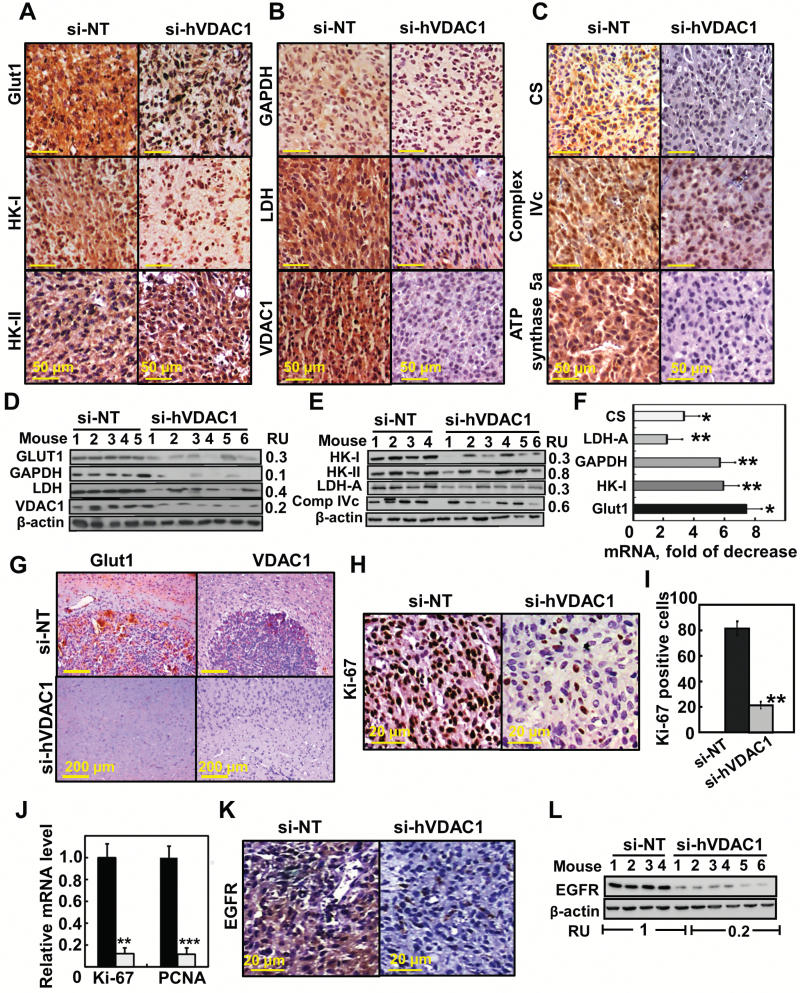
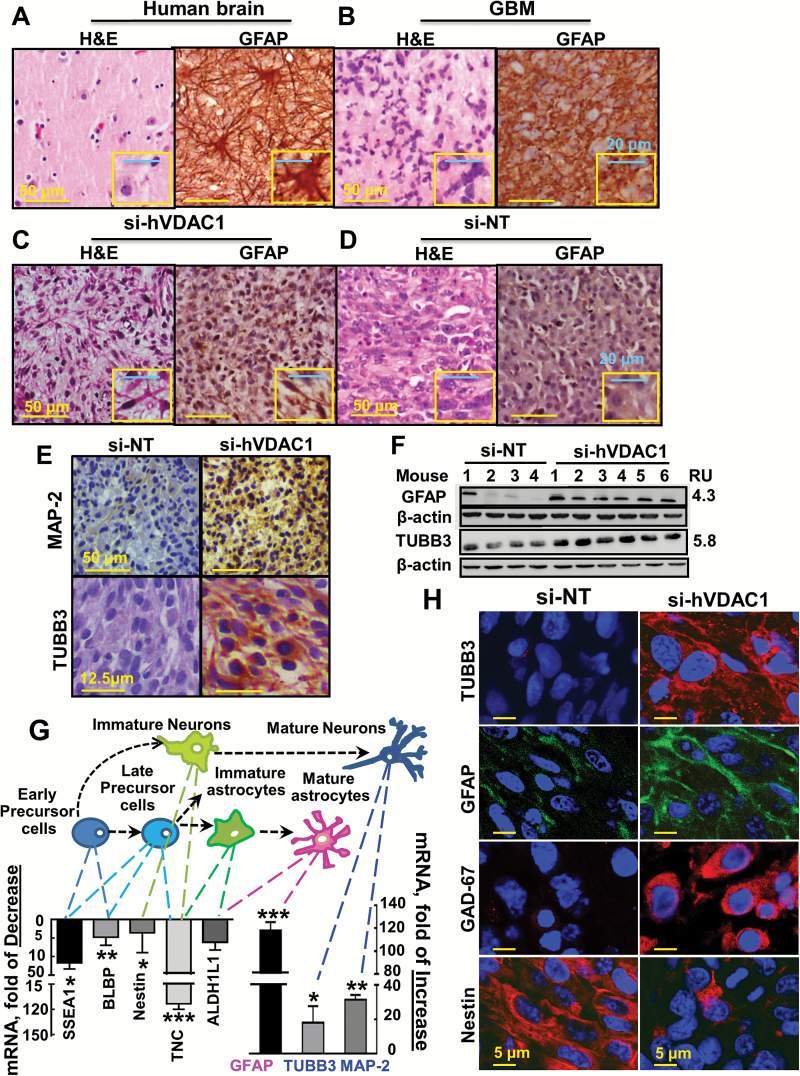
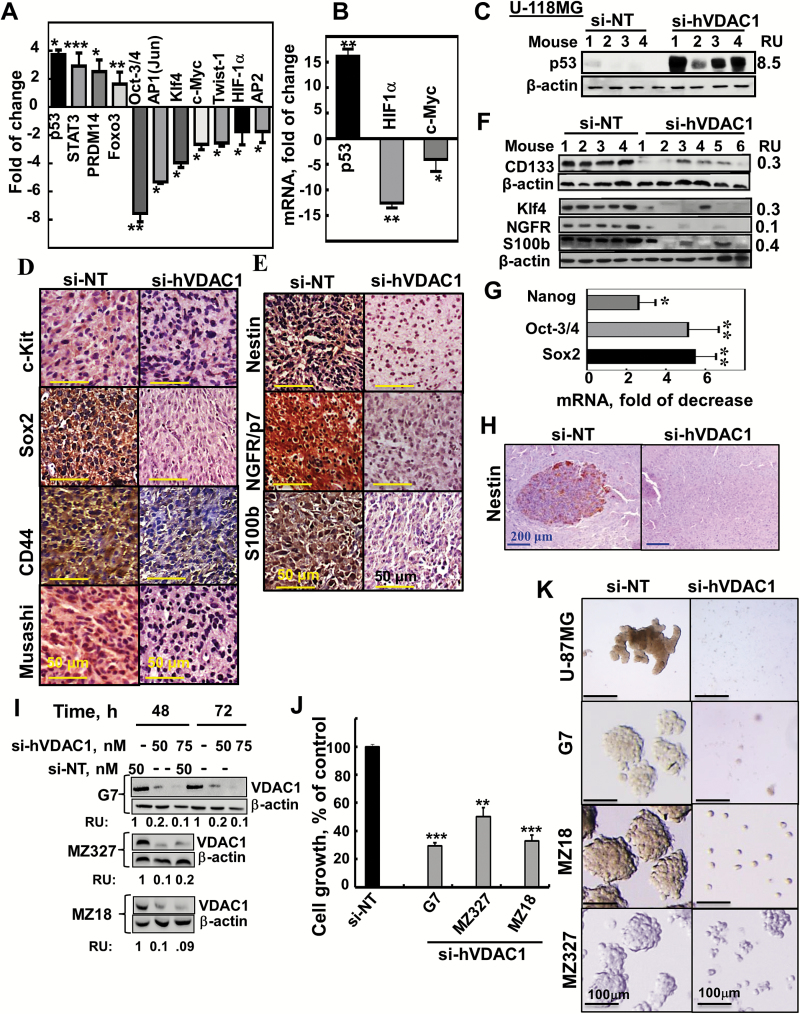
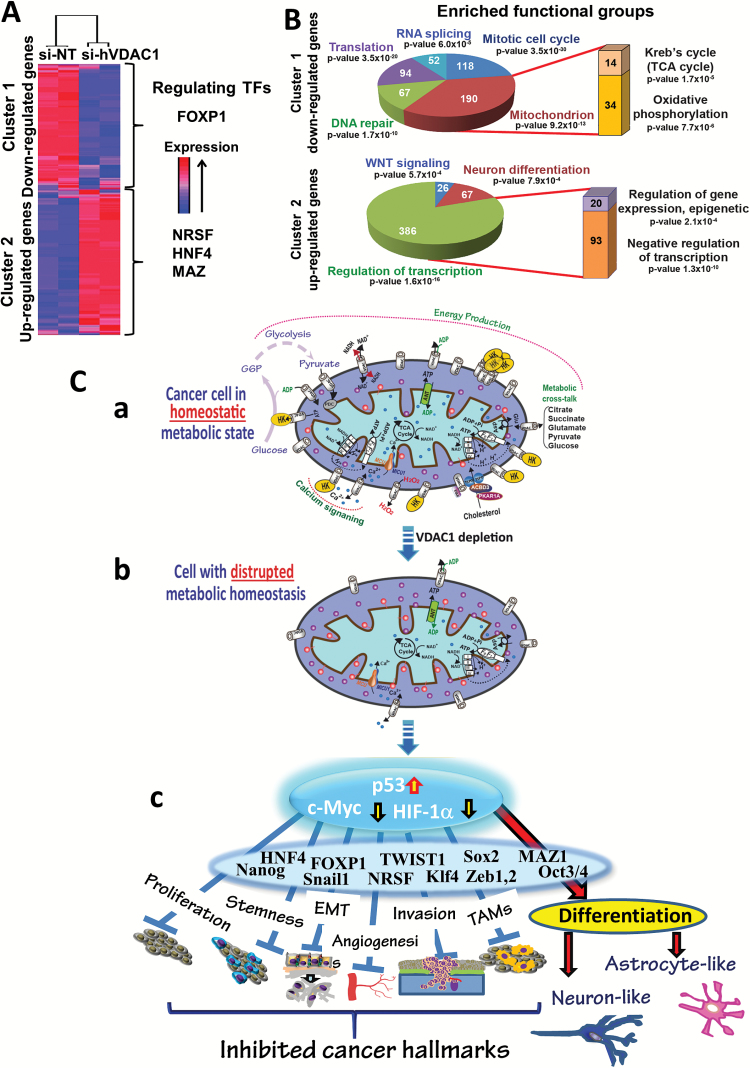
Results: Silencing VDAC1 expression using si-VDAC1 in 9 glioblastoma-related cell lines, including patient-derived cells, led to marked decreases in VDAC1 levels and cell growth. Using si-VDAC1 in subcutaneous or intracranial-orthotopic GBM models inhibited tumor growth and reversed oncogenic properties, such as reprogrammed metabolism, stemness, angiogenesis, epithelial-mesenchymal transition, and invasiveness. In cells in culture, si-VDAC1 inhibits cancer neurosphere formation and, in tumors, targeted cancer stem cells, leading to their differentiation into neuronal-like cells. These VDAC1 depletion-mediated effects involved alterations in transcription factors regulating signaling pathways associated with cancer hallmarks.

Conclusion: VDAC1 offers a target for GBM treatment, allowing for attacks on the interplay between metabolism and oncogenic signaling networks, leading to tumor cell differentiation into neuron- and astrocyte-like cells. Simultaneously attacking all of these processes, VDAC1 depletion overcame GBM heterogeneity and can replace several anticancer drugs that separately target angiogenesis, proliferation, or metabolism.

Keywords: glioblastoma; metabolism; mitochondria; siRNA; voltage-dependent anion channel.


Figures

Fig. 1
Fig. 1
si-hVADC1 inhibited cell growth and reduced energy production in GBM cell lines. (A) IHC staining of VDAC1 of human normal brain (n = 13) or GBM (n = 41) in tissue microarray slides (Biomax). Percentages of sections stained at the intensity indicated are shown. (B, C) U-87MG and U-251MG cells were treated for 48 h with si-NT or si-hVDAC1 and analyzed for VDAC1 levels by immunoblotting. (D, E) U-87MG cells were treated with si-NT or si-hVDAC1 (50 nM) and at the indicated time were analyzed for VDAC1 levels (D) or for cell growth using a sulforhodamine B assay (E). (F, G) Mouse primary brain cells (PBCs) were incubated (48 and 72h) with si-NT or si-VDAC1(M/H) and analysed for VDAC1 levels (F) and cell growth (G) (n = 3). (H) U-87MG (black bars) and U-251MG (gray bars) cells were treated with si-NT or si-hVDAC1, transfected 24 h later with pcDNA4/TO, either empty or encoding mVDAC1, and 2 h later, cell growth was analyzed (n = 3). Δ Ψ (I) and ATP (J) levels were analyzed in U-87MG cells (n = 3). FCCP (carbonyl cyanide-4-(trifluoromethoxy)phenylhydrazone), **P ≤ .01; ***P ≤ .001 (25 μM) served as control for decreasing Δ Ψ and ATP levels. RU = relative unit.
Fig. 2
Fig. 2
si-hVADC1 inhibition of tumor growth in vivo. (A) U-87MG cells were s.c. inoculated into nude mice. On day 13, the mice were divided into 2 groups and xenografts were injected every 3 days with si-NT (●, 8 mice) or si-hVDAC1 (▲, 16 mice) to a final concentration of 50–60nM (***P≤ .0001). (B) On day 33, the si-hVDAC-treated mice were subdivided into 2 groups (8 mice each). One group (▲) continued si-hVDAC1 treatment, the other switched to si-NT (○) treatment. si-NT-TTs and si-hVDAC1-TTs sections stained for VDAC1 by IHC (C) or immunoblot (D). RU = average relative units. (E) Orthotopic GBM, MRI of brains 33 days post-engraftment with U-87MG cells treated with si-NT or si-VDAC1. (F) Calculated tumor volume after 22 (black bars) and 33 days (gray bars). Results = mean ± SEM (n = 4–5), ****P ≤ .0001. (G) MRI of brains engrafted with U-87MG cells, 22 days after cell engraftment and treatment start. Two days post-engraftment, the mice were divided into 2 groups (6 mice each) and injected i.v. every 3 days with 100 μL of si-NT- or si-hVDAC-encapsulated-PLGA nanoparticles (400 nM siRNA). (H) Calculated tumor volume after 20 and 30 days. Red and black bars representing tumor volume of mice treated with si-NT- or si-hVDAC-encapsulated PLGA nanoparticles, respectively. Results = mean ± SEM (n = 6), *P ≤ .05; **P ≤ .01. (I) Mice survival over time of si-NT-PLGA- (red line) and si-hVDAC1-PLGA nanoparticle (black line) treated mice is presented in the cumulative Kaplan–Meier survival curves. ***P ≤ .001. (J) Orthotopic MZ-18 cells (10 × 104) (PDX) were engrafted into mice brains and 2 days later, the mice were divided into 2 groups (6 mice each) and injected i.v. every 3 days with si-NT- (black bars) or si-hVDAC (gray bars)-encapsulated PLGA-PEI nanoparticles (400 nM siRNA). Tumor volume was calculated from MRI taken 34 days post cell engraftment, and then 10 days after treatment termination (day 45).
Fig. 3
Fig. 3
Reversal of the U-87MG tumor cell reprogrammed metabolism by si-hVDAC1 treatment. (A–C) IHC of s.c. si-NT-TTs or si-hVDAC1-TTs stained for the indicated antibodies. (D, E) Immunoblot of selected proteins. RU = relative unit. (F) Levels of mRNA of metabolic enzymes in si-hVDAC1-TTs relative to those in si-NT-TTs. Results = mean ± SEM (n = 3–5), *P ≤ .05; **P ≤ .01. (G) Representative IHC sections from brains engrafted with si-NT- or si-hVDAC1–treated U-87MG cells, 22 days after cell grafting, stained for Glut1 and VDAC1. (H, I) IHC of s.c. si-NT-TTs and si-hVDAC1-TTs stained for Ki-67; positive cells were counted over several fields. (J) Analysis by qRT-PCR of Ki-67 and proliferating cell nuclear antigen (PCNA) mRNA levels in si-NT- (black bars) and si-hVDAC1 (gray bars)-TTs. Results = mean ± SEM (n = 3–5), **P ≤ .01; ***P ≤ .001). (K, L) IHC and immunoblot analyses of epidermal growth factor receptor.
Fig. 4
Fig. 4
U-87MG cells in si-hVDAC1-TTs: morphological changes and expression of neuronal markers. Human normal (A), GBM brains (B), or hVDAC1-TTs (C) or si-NT-TTs (s.c.) (D) stained with H&E or anti-GFAP antibodies. (E) si-hVDAC1-TTs or si-NT-TTs sections stained with anti–Map-2 or anti-TUBB3 antibodies. (F) Immunoblot of GFAP and TUBB3 in si-NT-TTs and si-hVDAC1-TTs. RU = relative units. (G) Schematic presentation of early precursor cell differentiation into mature astrocytes via several possible intermediate states: late precursor cells, immature astrocytes, or neurons via immature neurons. Levels of mRNA markers specific for each state in s.c. si-hVDAC1-TTs relative to those in si-NT-TTs are presented. Results are the mean±SEM (n = 3–5); *P ≤ .05; **P ≤ .01; ***P ≤ .001. (H) Immunofluorescent staining of si-NT-TT– and si-hVDAC1-TT–derived sections for nestin, GFAP, TUBB3, and GAD67.
Fig. 5
Fig. 5
TF levels and stem cell marker expression are altered in si-hVDAC1-TTs and inhibition of cancer neurosphere formation. (A) Stem cell TF activation profiling was analyzed in s.c. U-87MG si-NT- or si-hVDAC1-TTs. (B) Analysis by qRT-PCR of p53, c-Myc, and HIF-1α mRNA levels in si-hVDAC1-TTs, relative to si-NT-TTs. Results = mean±SEM (n=3–5); *P ≤ .05; **P ≤ .01. (C) Immunoblot of p53 in si-NT-TTs and si-hVDAC1-TTs derived from U-118MG cells. (D, E) IHC and immunoblot (F) staining for stem cell markers and qRT-PCR analysis of Sox2, Oct3/4, and Nanog (G) of si-NT- or si-hVDAC1-TTs sections. Results = mean ± SEM (n = 3–5), *P ≤ .05; **P ≤ .01. (H) Nestin-stained sections from brains 22 days post-grafting treated with si-NT– or si-hVDAC1–treated U-87MG cells. (I–K) G7, MZ-18, and MZ327 cells were treated with si-NT or si-hVDAC1 and after 48 and 72 h, the cells were analyzed for VDAC1 levels (I) or cell growth using a sulforhodamine B assay (J). Results are the mean ± SEM (n = 3); **P ≤.01; ***P ≤.001. (K) Neurosphere formation in si-NT– or si-hVDAC1–treated U-87, G7, MZ-18 and MZ-327 cells in stem cell–specific medium.
Fig. 6
Fig. 6
VDAC1-depletion and metabolic reprogramming leading to alterations in key TF levels and biological processes: a reversal of oncogenic properties and cell differentiation. (A, B) DNA microarray and bioinformatics analyses of si-hVDAC1- and si-NT-TTs (s.c.) reveal alterations in key TF levels and biological processes. RNA isolated from U-87MG si-hVDAC1- and si-NT-TTs was subjected to Affymetrix DNA microarray analysis. (A) Clustering of the 4493 differentially expressed genes: blue to red colors indicate expression levels. Promoter analysis indicates binding sites enrichment for FOXP1 (367 genes, P = 3.4 × 10⁻²⁰) in cluster 1, and NRSF (1310 genes, P = 1.3 × 10−84), HNF4 (1161 genes, P = 5.8 × 10−38), and MAZ (678 genes, P = 1.2 × 10⁻²²) in cluster 2. (B) Functional analysis of clusters 1 and 2 based on the Gene Ontology system. The number of genes associated with the indicated function is presented. (C) A schematic presentation of mitochondria in cancer cell VDAC1 depletion and metabolic reprogramming leading to a reversal of oncogenic properties and cell differentiation. Before treatment with si-hVDAC1, cancer cells maintain homeostatic energy and metabolic states, with HK bound to VDAC1, accelerating glycolysis and mitochondrial function to allow sufficient ATP and metabolite precursor levels to support cell growth and survival (a). VDAC1 depletion leads to dramatic decreases in energy and metabolite generation (b). This leads to changes in master metabolism regulator (p53, HIF1-α, and c-Myc) expression levels, which alter the expression of TFs associated with the oncogenic properties of stemness, EMT, cell proliferation, invasion, TAMs, and angiogenesis, while leading to differentiation into astrocyte- or neuron-like cells (c).

References

    1. Bai RY, Staedtke V, Riggins GJ. Molecular targeting of glioblastoma: drug discovery and therapies. Trends Mol Med. 2011;17(6):301–312. - PMC - PubMed
    1. Singh SK, Hawkins C, Clarke ID, et al. Identification of human brain tumour initiating cells. Nature. 2004;432(7015):396–401. - PubMed
    1. Chen J, Li Y, Yu TS, et al. A restricted cell population propagates glioblastoma growth after chemotherapy. Nature. 2012;488(7412):522–526. - PMC - PubMed
    1. Sottoriva A, Spiteri I, Piccirillo SG, et al. Intratumor heterogeneity in human glioblastoma reflects cancer evolutionary dynamics. Proc Natl Acad Sci U S A. 2013;110(10):4009–4014. - PMC - PubMed
    1. Hanahan D, Weinberg RA. Hallmarks of cancer: the next generation. Cell. 2011;144(5):646–674. - PubMed

Substances