. 2017 Oct 1;32(10):1645-1655.
doi: 10.1093/ndt/gfx005.

Cisplatin-induced renal inflammation is ameliorated by cilastatin nephroprotection

Affiliations

Cisplatin-induced renal inflammation is ameliorated by cilastatin nephroprotection

Blanca Humanes et al. Nephrol Dial Transplant. .

Abstract

Background: Cisplatin is a potent chemotherapeutic drug whose nephrotoxic effect is a major complication and a dose-limiting factor for antitumoral therapy. There is much evidence that inflammation contributes to the pathogenesis of cisplatin-induced nephrotoxicity. We found that cilastatin, a renal dehydropeptidase-I inhibitor, has protective effects in vitro and in vivo against cisplatin-induced renal damage by inhibiting apoptosis and oxidation. Here, we investigated the potential use of cilastatin to protect against cisplatin-induced kidney injury and inflammation in rats.

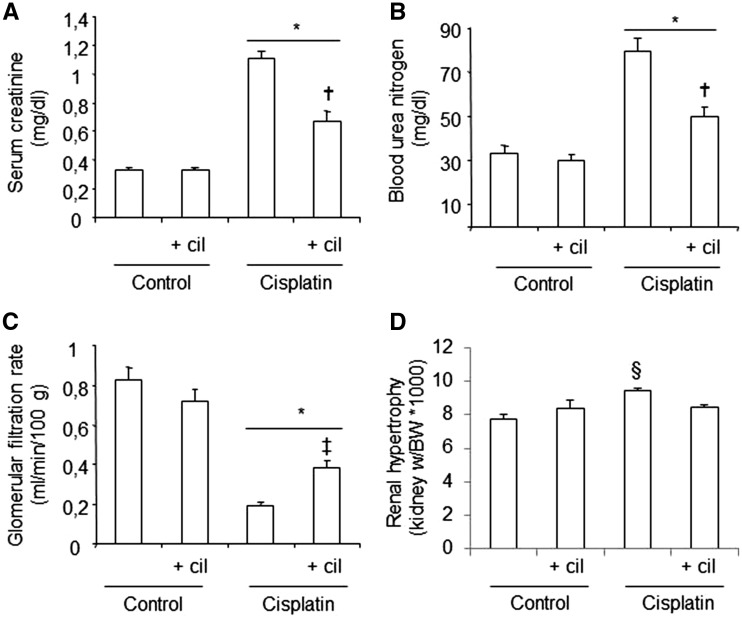
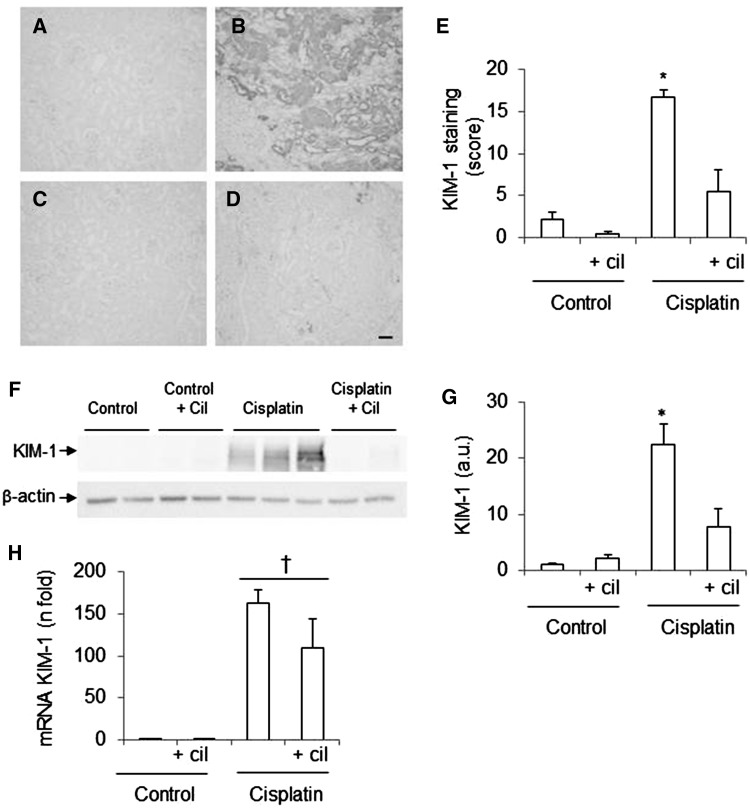
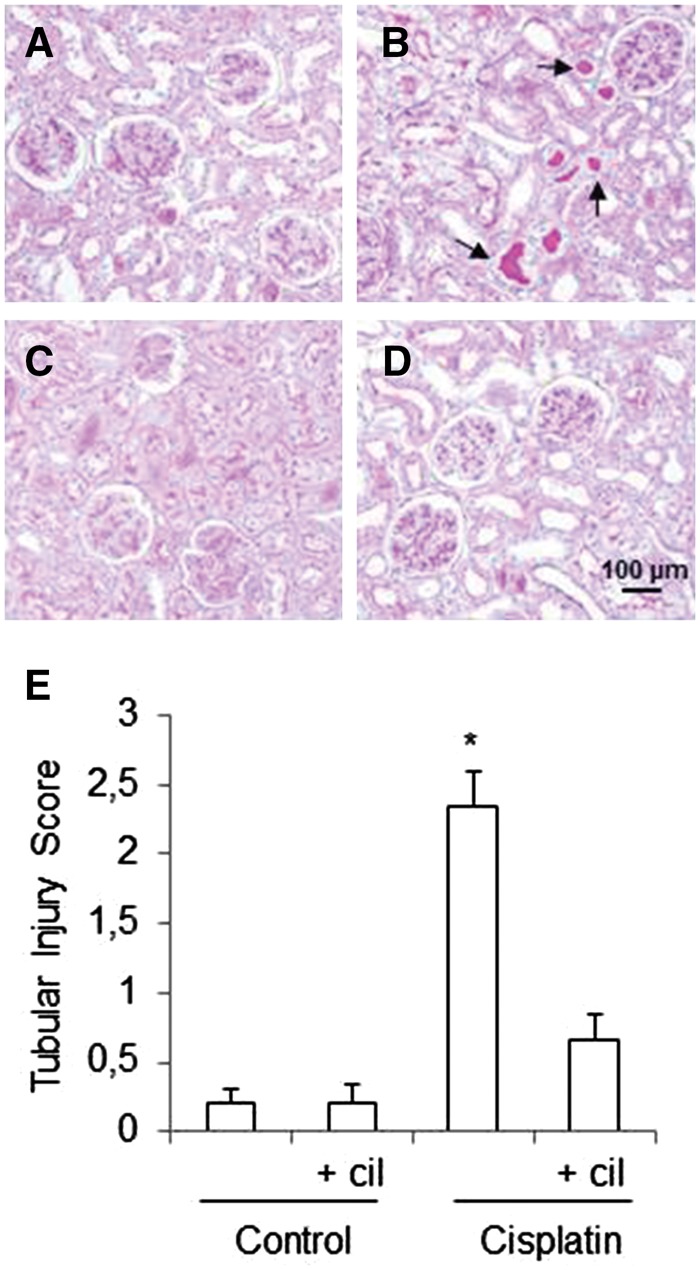
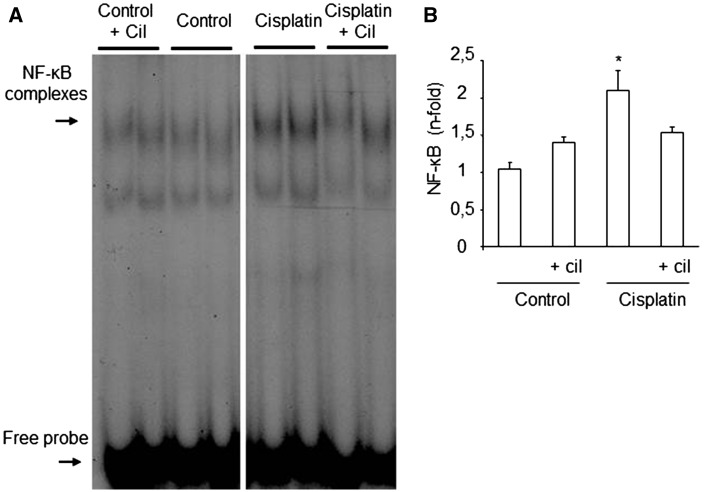
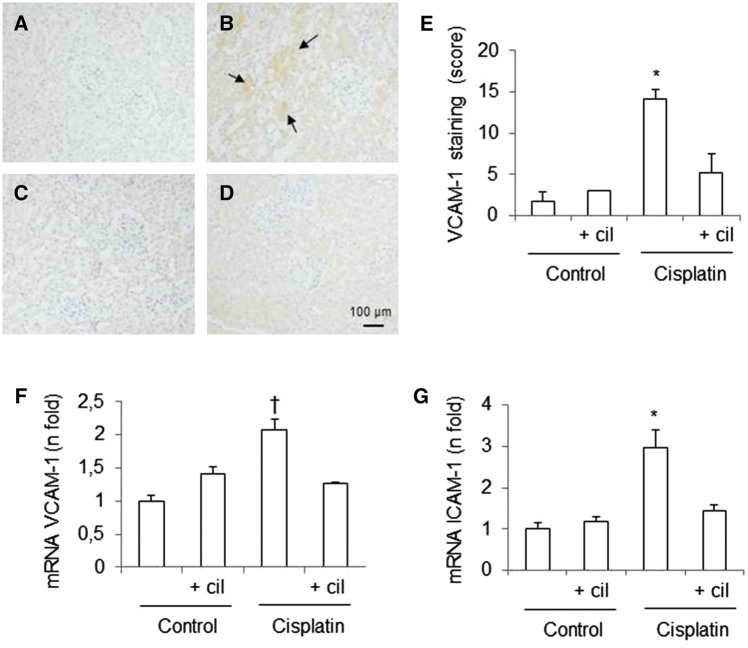
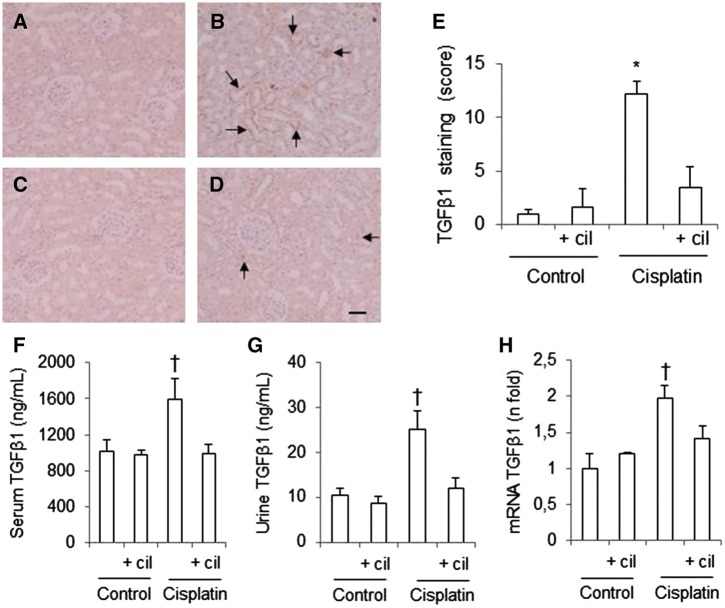
Methods: Male Wistar rats were divided into four groups: control, cilastatin-control, cisplatin and cilastatin-cisplatin. Nephrotoxicity was assessed 5 days after administration of cisplatin based on blood urea nitrogen, creatinine, glomerular filtration rate (GFR), kidney injury molecule (KIM)-1 and renal morphology. Inflammation was measured using the electrophoretic mobility shift assay, immunohistochemical studies and evaluation of inflammatory mediators.

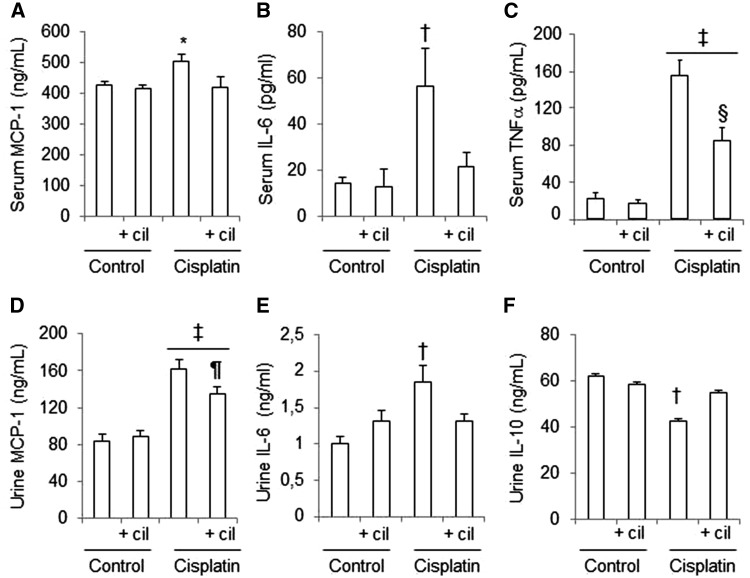
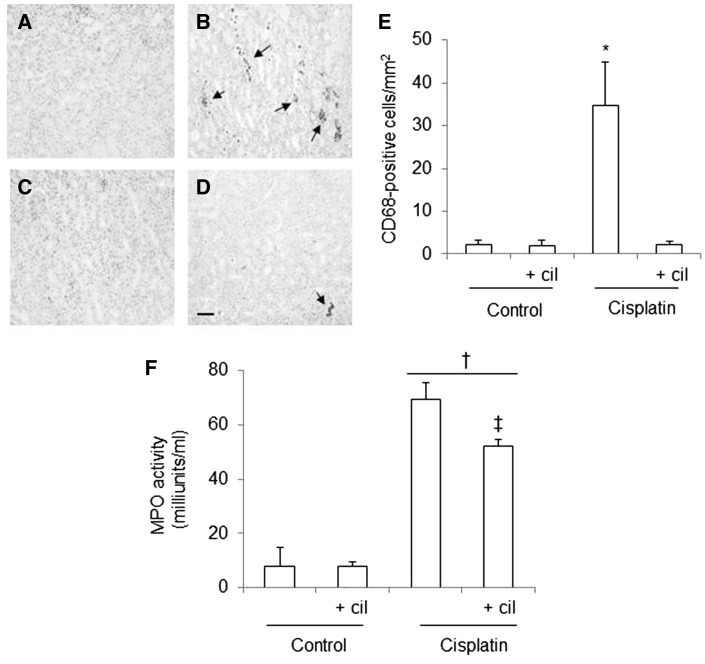
Results: Compared with the control rats, cisplatin-administered rats were affected by significant proximal tubule damage, decreased GFR, increased production of inflammatory mediators and elevations in urea, creatinine and tissue KIM-1 levels. Cilastatin prevented these changes in renal function and ameliorated histological damage in cisplatin-administered animals. Cilastatin also reduced pro-inflammatory cytokine levels, activation of nuclear factor-κB and CD68-positive cell concentrations.

Conclusions: Cilastatin reduces cisplatin-induced nephrotoxicity, which is associated with decreased inflammation in vivo. Although the exact role of decreased inflammation in nephroprotection has not been fully elucidated, treatment with cilastatin could be a novel strategy for the prevention of cisplatin-induced acute kidney injury.

Keywords: acute kidney injury; cilastatin; cisplatin; inflammation; nephroprotection.


Figures

FIGURE 1
FIGURE 1
Effects of cilastatin on cisplatin-induced nephrotoxicity in rats. Parameters of renal function on day 5 after administration of cisplatin. (A) Serum creatinine, (B) blood urea nitrogen, (C) glomerular filtration rate, (D) renal hypertrophy. Cisplatin administration increases serum creatinine, blood urea nitrogen and renal hypertrophy, and reduces glomerular filtration rate, compared with control groups. Cilastatin significantly improved all the parameters. Results are expressed as mean ± SEM; n = 7–8 animals per group. cil, cilastatin; kidney w/BW, kidney weight:body weight. *P < 0.05 versus control groups; P ≤ 0.0001 versus cisplatin group; P < 0.05 versus cisplatin group; §P < 0.02 versus all groups.
FIGURE 2
FIGURE 2
Effects of cisplatin and cilastatin in acute kidney injury biomarkers. (AD) Localization of kidney injury molecule (KIM)-1 in kidney sections. (A) Control, (B) cisplatin, (C) control + cilastatin, (D) cisplatin + cilastatin (magnification 10×), bar = 100 µm. (E) Densitometric analysis of immunohistochemistry of KIM-1. (F) Representative western blot of KIM-1 in renal cortex. (G) Densitometric analysis of western blot of KIM-1. (H) Renal mRNA expression of KIM-1. Cilastatin significantly reduced the increase of protein but not mRNA expression of KIM-1 induced by cisplatin. Data are expressed as mean ± SEM; n = 7–8 animals per group. cil, cilastatin; a.u., arbitrary units. *P < 0.001 versus all groups; P ≤ 0.05 versus control groups.
FIGURE 3
FIGURE 3
Effects of cilastatin on cisplatin-induced tubular injury. Representative images of the renal pathology (periodic acid–Schiff staining, magnification 20×) on day 5 after administration of cisplatin. (A) Control rats, (B) cisplatin, (B) control + cilastatin, (D) cisplatin + cilastatin. Control groups show normal renal structure; cisplatin-injected kidneys show marked injury with blebbing of apical membranes, epithelial necrosis, protein casts formation and vacuolization in the proximal tubules (arrows). These changes were significantly reduced by treatment with cilastatin. (E) Semiquantitative tubular injury score. Results are expressed as mean ± SEM; n = 7–8 animals per group. cil, cilastatin. *P < 0.01 versus all groups.
FIGURE 4
FIGURE 4
Effects of cilastatin on cisplatin-induced renal nuclear factor (NF)-κB activation. (A) Representative electrophoretic mobility shift assay experiment from renal tissue. (B) Densitometric analysis of electrophoretic mobility shift assay on kidney tissue. Administration of cisplatin increases NF-κB activity on renal tissue. Cilastatin significantly reduced the increase of NF-κB activity induced by cisplatin. All results are expressed as mean  ±  SEM; n  =  7–8 animals per group. cil, cilastatin. *P  <  0.02 versus all groups.
FIGURE 5
FIGURE 5
Effects of cisplatin and cilastatin on urine and serum cytokines. Serum and urine cytokine levels in studied groups. (A) Serum MCP-1, (B) serum IL-6, (C) serum TNFα, (D) urine MCP-1, (E) urine IL-6, (F) urine IL-10. Administration of cisplatin increased serum and urine levels of MCP-1 and IL-6, and serum levels of TNFα. Thus, cisplatin diminished urine levels of IL-10. These changes where significantly improved with cilastatin treatment. All results are expressed as mean ± SEM; n = 7–8 animals per group. cil, cilastatin. *P ≤ 0.02 versus all groups; P ≤ 0.05 versus all groups; P ≤ 0.05 versus control groups; §P< 0.01 versus cisplatin; P ≤ 0.05 versus cisplatin.
FIGURE 6
FIGURE 6
Effects of cilastatin on cisplatin-induced inflammatory cell infiltration. Localization of CD68 (monocyte/macrophage) in kidney sections of (A) control rats, (B) cisplatin, (C) control + cilastatin and (D) cisplatin + cilastatin. Note increased staining in cisplatin-injected rats (arrows) compared with cisplatin + cilastatin and control rats (magnification 20×); bar = 100 µm. (E) Quantification of CD68 immunostaining in renal cells. (F) Serum myeloperoxidase (MPO) activity in the groups of rats studied. Administration of cisplatin increased systemic MPO activity. This change was significantly improved with cilastatin. All results are expressed as mean ± SEM; n = 7–8 animals per group. cil, cilastatin. *P < 0.05 versus all groups; P ≤ 0.01 versus control groups; P < 0.05 versus cisplatin group.
FIGURE 7
FIGURE 7
Effects of cisplatin and cilastatin on renal expression of intercellular adhesion molecule (ICAM)-1 and vascular cell adhesion molecule (VCAM)-1. Localization of VCAM-1 in kidney sections of (A) control rats, (B) cisplatin, (C) control  +  cilastatin and (D) cisplatin  +  cilastatin. Note increased renal staining in cisplatin-injected rats (arrows) compared with cisplatin  +  cilastatin and control groups (magnification 20×). (E) Semiquantification of VCAM-1 immunostaining in renal cells. (F) Renal mRNA expression of VCAM-1. (G) Renal mRNA expression of ICAM-1. Cilastatin significantly reduced the increase of both VCAM-1 and ICAM-1 mRNA expression induced by cisplatin. All results are expressed as mean  ±  SEM; n  =  7–8 animals per group. cil, cilastatin. *P  ≤  0.001 versus all groups; P  <  0.05 versus all groups.
FIGURE 8
FIGURE 8
Effects of cilastatin on the increase of cisplatin-induced transforming growth factor β1 (TGFβ1). Localization of TGFβ1 in kidney sections of (A) control rats, (B) cisplatin, (C) control + cilastatin and (D) cisplatin + cilastatin. Note increased tubular staining in cisplatin-injected rats (arrows) compared with cisplatin + cilastatin and control rats (magnification 20×); bar = 100 µm. (E) Semiquantification of TGFβ1 immunostaining in renal cells. (F) Serum TGFβ1 levels. (G) Urine TGFβ1 levels. (H) Renal mRNA expression of TGFβ1. Administration of cisplatin increased levels of TGFβ1 in kidney tissue, as well as serum and urine concentration. Also, cisplatin elevated TGFβ1 mRNA expression. These changes where significantly improved with cilastatin. All results are expressed as mean ± SEM; n = 7–8 animals per group. cil, cilastatin. *P < 0.001 versus all groups; P ≤ 0.05 versus all groups.

Similar articles

Cited by

References

    1. Pabla N, Dong Z.. Cisplatin nephrotoxicity: mechanisms and renoprotective strategies. Kidney Int 2008; 73: 994–1007 - PubMed
    1. Wang D, Lippard SJ.. Cellular processing of platinum anticancer drugs. Nat Rev Drug Discov 2005; 4: 307–320 - PubMed
    1. Ries F, Klastersky J.. Nephrotoxicity induced by cancer chemotherapy with special emphasis on cisplatin toxicity. Am J Kidney Dis 1986; 8: 368–379 - PubMed
    1. Schrier RW. Cancer therapy and renal injury. J Clin Invest 2002; 110: 743–745 - PMC - PubMed
    1. Yao X, Panichpisal K, Kurtzman N. et al. Cisplatin nephrotoxicity: a review. Am J Med Sci 2007; 334: 115–124 - PubMed

MeSH terms