. 2017 Mar 24;14(1):65.
doi: 10.1186/s12974-017-0843-4.

NOX2 deficiency alters macrophage phenotype through an IL-10/STAT3 dependent mechanism: implications for traumatic brain injury

Affiliations

NOX2 deficiency alters macrophage phenotype through an IL-10/STAT3 dependent mechanism: implications for traumatic brain injury

James P Barrett et al. J Neuroinflammation. .

Abstract

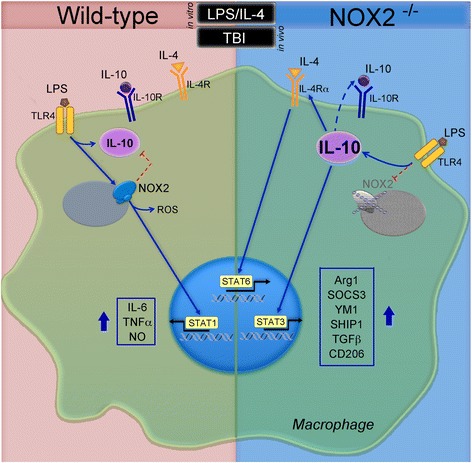
Background: NADPH oxidase (NOX2) is an enzyme system that generates reactive oxygen species (ROS) in microglia and macrophages. Excessive ROS production is linked with neuroinflammation and chronic neurodegeneration following traumatic brain injury (TBI). Redox signaling regulates macrophage/microglial phenotypic responses (pro-inflammatory versus anti-inflammatory), and NOX2 inhibition following moderate-to-severe TBI markedly reduces pro-inflammatory activation of macrophages/microglia resulting in concomitant increases in anti-inflammatory responses. Here, we report the signaling pathways that regulate NOX2-dependent macrophage/microglial phenotype switching in the TBI brain.

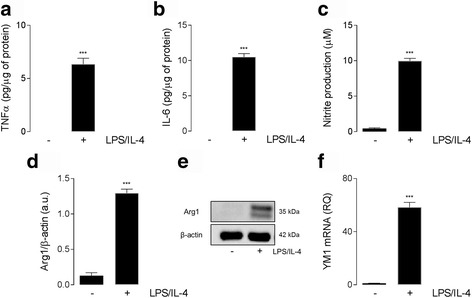
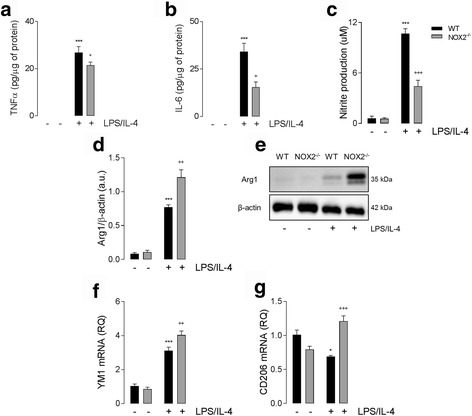
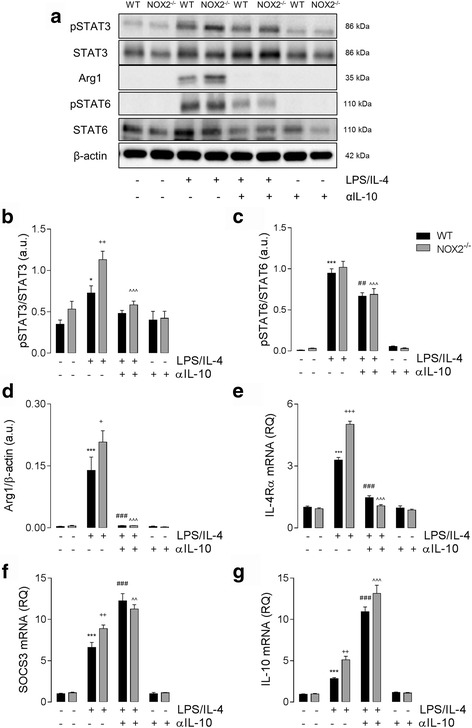
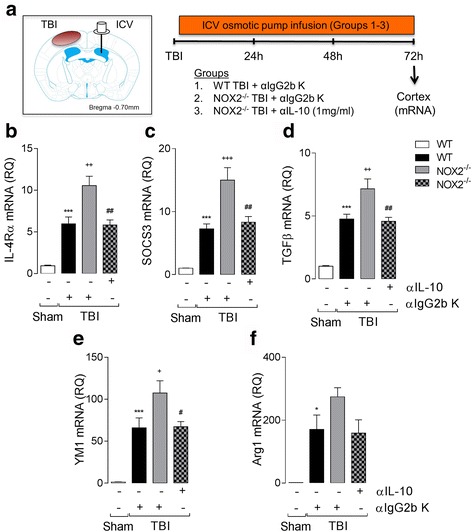
Methods: Bone marrow-derived macrophages (BMDMs) prepared from wildtype (C57Bl/6) and NOX2 deficient (NOX2-/-) mice were treated with lipopolysaccharide (LPS; 10 ng/ml), interleukin-4 (IL-4; 10 ng/ml), or combined LPS/IL-4 to investigate signal transduction pathways associated with macrophage activation using western immunoblotting and qPCR analyses. Signaling pathways and activation markers were evaluated in ipsilateral cortical tissue obtained from adult male wildtype and NOX2-/- mice that received moderate-level controlled cortical impact (CCI). A neutralizing anti-IL-10 approach was used to determine the effects of IL-10 on NOX2-dependent transitions from pro- to anti-inflammatory activation states.

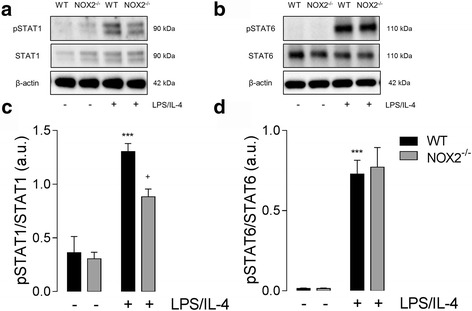
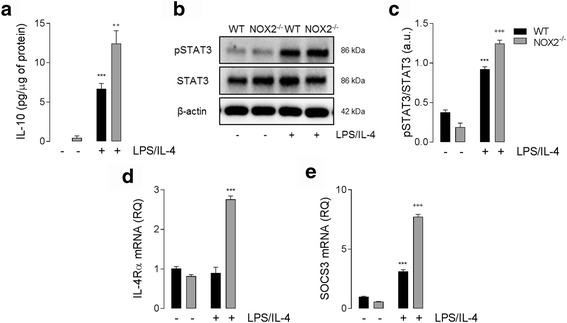
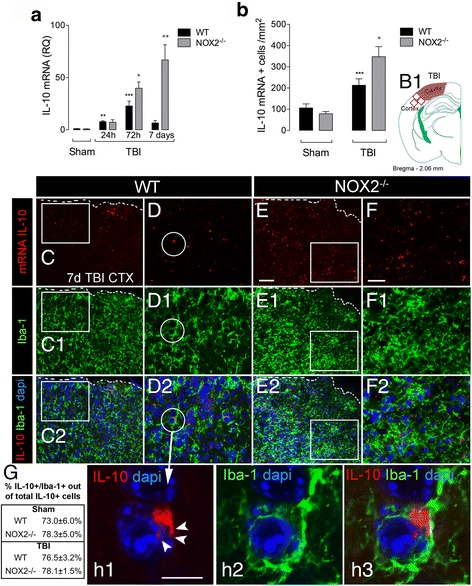
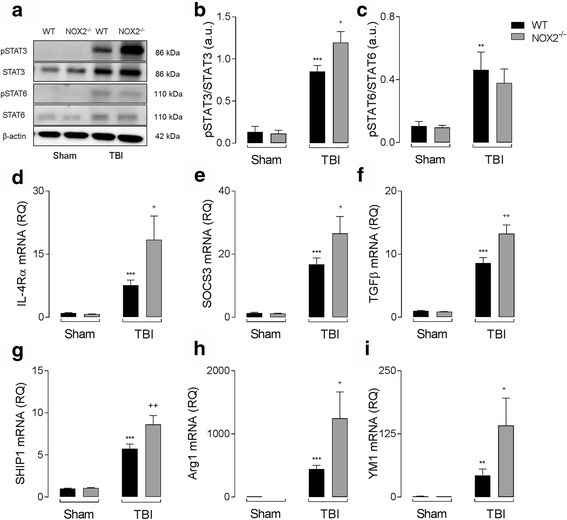
Results: Using an LPS/IL-4-stimulated BMDM model that mimics the mixed pro- and anti-inflammatory responses observed in the injured cortex, we show that NOX2-/- significantly reduces STAT1 signaling and markers of pro-inflammatory activation. In addition, NOX2-/- BMDMs significantly increase anti-inflammatory marker expression; IL-10-mediated STAT3 signaling, but not STAT6 signaling, appears to be critical in regulating this anti-inflammatory response. Following moderate-level CCI, IL-10 is significantly increased in microglia/macrophages in the injured cortex of NOX2-/- mice. These changes are associated with increased STAT3 activation, but not STAT6 activation, and a robust anti-inflammatory response. Neutralization of IL-10 in NOX2-/- BMDMs or CCI mice blocks STAT3 activation and the anti-inflammatory response, thereby demonstrating a critical role for IL-10 in regulating NOX2-dependent transitions between pro- and anti-inflammatory activation states.

Conclusions: These studies indicate that following TBI NOX2 inhibition promotes a robust anti-inflammatory response in macrophages/microglia that is mediated by the IL-10/STAT3 signaling pathway. Thus, therapeutic interventions that inhibit macrophage/microglial NOX2 activity may improve TBI outcomes by not only limiting pro-inflammatory neurotoxic responses, but also enhancing IL-10-mediated anti-inflammatory responses that are neuroprotective.

Keywords: Interleukin-10; Macrophage; NADPH oxidase; NOX2; Neuroinflammation; Traumatic brain injury.


Figures

Fig. 1
Fig. 1
LPS/IL-4 induces a mixed phenotype in BMDMs. (a-f) LPS/IL-4 (both 10 ng/ml; 24 h) stimulation significantly increased the production of TNFα (a), IL-6 (b), and Nitrite (b) in BMDMs from WT mice (*** P< 0.001; Student’s t test). LPS/IL-4 increased Arg1 (d) protein expression (representative western immunoblot shown (e)) and YM1 (f) mRNA expression in BMDMs (*** P < 0.001; Student’s t test). All data are expressed as means (±SEM; n = 3)
Fig. 2
Fig. 2
NOX2 deficiency alters macrophage response to LPS/IL-4. LPS/IL-4 (both 10 ng/ml; 24 h) stimulation significantly increased the release of TNFα (a), IL-6 (b), and Nitrite (c) in WT and NOX2−/− BMDMs (*** P < 0.001; ANOVA). LPS/IL-4-induced increase in pro-inflammatory markers was significantly reduced in and NOX2−/− BMDMs compared with WT BMDMs (++ P < 0.01, +++ P < 0.001, WT LPS/IL-4 vs. NOX2−/− LPS/IL-4; ANOVA). LPS/IL-4 increased Arg1 (d) protein expression (representative western immunoblot shown (e)) and YM1 (f) mRNA expression in WT and NOX2−/− (*** P < 0.001; ANOVA). Expression of anti-inflammatory markers was significantly increased in NOX2−/− BMDMs compared with WT BMDMs (++ P < 0.01, +++ P < 0.001, WT LPS/IL-4 vs. NOX2−/− LPS/IL-4; ANOVA). LPS/IL-4 significantly decreased CD206 mRNA expression in WT BMDMs (* P < 0.05; ANOVA; g), while CD206 mRNA expression was significantly increased in NOX2−/− BMDMs following LPS/IL-4 stimulation (+++ P < 0.001, NOX2−/− con vs. NOX2−/− LPS/IL-4; ANOVA). All data are expressed as means (±SEM; n = 6)
Fig. 3
Fig. 3
STAT1 activation is attenuated in NOX2−/− BMDMs, whereas STAT6 activation is unchanged. (a, b) Protein expression of phosphorylated STAT1 and phosphorylated STAT6 in response to LPS/IL-4 stimulation was assessed by western immunoblotting. (c) LPS/IL-4 (both 10 ng/ml; 24 h) increased pSTAT1 expression (** P * < 0.001, ANOVA) in WT BMDMs. In contrast, LPS/IL-4-induced increase in pSTAT1 was significantly reduced in NOX2−/− BMDMs (+ P < 0.05, WT LPS/IL-4 vs. NOX2−/− LPS/IL-4; ANOVA). (d) LPS/IL-4 significantly increased pSTAT6 (*** P < 0.001; ANOVA) in WT and NOX2−/− BMDMs, but no genotype related differences were observed. All data are expressed as means (± SEM n = 5)
Fig. 4
Fig. 4
IL-10 production and downstream effectors are elevated in NOX2−/− BMDMs in response to LPS/IL-4. (a) LPS/IL-4 (both 10 ng/ml; 24 h) stimulation significantly increased IL-10 protein concentration in WT and NOX2−/− BMDMs (*** P < 0.001; ANOVA). The LPS/IL-4-induced increase in IL-10 concentration was significantly increased in NOX2−/− BMDMs compared with WT BMDMs (+++p < 0.001, WT LPS/IL-4 vs. NOX2−/− LPS/IL-4; ANOVA). (b, c) Protein expression of phosphorylated STAT3 was significantly increased in WT and NOX2−/− BMDMs following LPS/IL-4 stimulation (*** P < 0.001; ANOVA; representative western immunoblot shown in b). LPS/IL-4-induced pSTAT3 expression was significantly increased in NOX2−/− BMDMs compared with WT BMDMs (+++ P < 0.001, WT LPS/IL-4 vs. NOX2−/− LPS/IL-4; ANOVA). (d) LPS/IL-4 significantly increased IL-4Rα mRNA expression NOX2−/− BMDMs (*** P < 0.001; ANOVA). (e) SOCS3 mRNA expression was significantly increased in WT and NOX2−/− BMDMs following LPS/IL-4 stimulation (*** P < 0.001; ANOVA). LPS/IL-4-induced SOCS3 expression was significantly increased NOX2−/− BMDMs compared with WT BMDMs (+++ P < 0.001, WT LPS/IL-4 vs. NOX2−/− LPS/IL-4; ANOVA). All data are expressed as means (± SEM, n = 6)
Fig. 5
Fig. 5
Increased anti-inflammatory activation in NOX2−/− BMDMs is mediated through IL-10. (a) Representative immunoblots for pSTAT3, STAT3, Arg1, pSTAT6, STAT6, and β-actin. (b) LPS/IL-4 (both 10 ng/ml; 24 h) increased the expression of pSTAT3 in WT BMDMs (* P < 0.05, vs. control; ANOVA), and LPS/IL-4-induced pSTAT3 expression was significantly increased in NOX2−/− BMDMs (++ P < 0.01, WT LPS/IL-4 vs. NOX2−/− LPS/IL-4; ANOVA). Co-incubation of BMDMs with neutralizing anti-IL-10 (αIL-10) attenuated the LPS/IL-4-induced increase in pSTAT3 in NOX2−/− BMDMs (^^^ P < 0.001, NOX2-/- LPS/IL-4 vs. NOX2-/- LPS/IL-4 + αIL-10; ANOVA). (c) αIL-10 attenuated the LPS/IL-4-induced increase pSTAT6 expression (*** P < 0.001, control vs. LPS/IL-4; ## P < 0.01, WT LPS/IL-4 vs. WT LPS/IL-4 + αIL-10; ^^^ P < 0.001, NOX2−/− LPS/IL-4 vs. NOX2−/− LPS/IL-4 + αIL-10; ANOVA), and no genotype-related changes were observed. (d, e) LPS/IL-4 induced an increase in Arg1 (d) protein expression, and IL-4Rα (e) mRNA expression in WT and NOX2−/− BMDMs (*** P < 0.001, vs. control; ANOVA); these effects were significantly increased in NOX2−/− BMDMs (+ P < 0.05, +++ P < 0.001, WT LPS/IL-4 vs. NOX2−/− LPS/IL-4; ANOVA). The LPS/IL-4 mediated effects on Arg1 and IL-4Rα expression were significantly reduced in the presence of αIL-10 (^^^p < 0.001, NOX2−/− LPS/IL-4 vs. NOX2−/− LPS/IL-4; ###p < 0.001, WT LPS/IL-4 vs. WT LPS/IL-4 + αIL-10; ANOVA). (f, g) SOCS3 and IL-10 mRNA expression was significantly increased in WT and NOX2−/− BMDMs following LPS/IL-4 stimulation (* P < 0.05, *** P < 0.001, vs. control; ANOVA); the LPS/IL-4 effect was significantly increased in NOX2−/− BMDMs compared with WT BMDMs (* P < 0.05, WT LPS/IL-4 vs. NOX2−/− LPS/IL-4; ANOVA). SOCS3 and IL-10 expression levels were significantly increased in the presence of αIL-10 (^^ P < 0.01, ^^^ P < 0.001, NOX2−/− LPS/IL-4 vs. NOX2−/− LPS/IL-4 + αIL-10; ### P < 0.001, WT LPS/IL-4 vs. WT LPS/IL-4 + αIL-10; ANOVA). All data are expressed as means (± SEM, n = 6)
Fig. 6
Fig. 6
IL-10 is increased in the cortex of NOX2−/− TBI mice. (A) IL-10 mRNA expression was assessed in the ipsilateral cortex of WT and NOX2−/− sham and TBI mice at 24, and 72 h and 7 days post-injury. TBI increased IL-10 mRNA at all time points (** P < 0.01, [24 h], *** P < 0.001 [72 h], vs. sham; ANOVA). IL-10 expression was significantly increased in NOX2−/− TBI mice at 72 h and 7 days (+ P < 0.05, ++\P < 0.01, WT TBI vs. NOX2−/− TBI; ANOVA). All data are expressed as means (± SEM, n=5). (B) Quantification of IL-10 mRNA positive cells in the ipsilateral cortex of WT and NOX2−/− sham and TBI mice at 7 days post-injury. TBI increased IL-10 expression when compared to sham (*** P < 0.001; ANOVA), and this effect was significantly greater in NOX2−/− TBI mice (+ P < 0.05, WT TBI vs. NOX2−/− TBI; ANOVA). All data are expressed as means (± SEM, n = 5). (B1) Schematic representation of the injured coronal brain section, the red squares indicate the fields that were examined in this study. (CH) Representative images from the ipsilateral cortex of WT (CD2) and NOX2−/− (E F2) TBI mice at 7 days post-injury. Images show reduced IL-10 positive cells (red) in the injured cortex of WT TBI (C, inset in D) compared to NOX2−/− TBI mice (E, inset in F). IL-10 was predominantly expressed in microglia/macrophages detected by immunohistochemistry (Iba-1, green) and nuclei (dapi, blue) in both groups; WT (C1 C2, insets in D D2) and in NOX2−/− TBI mice (E1 E2, insets in F2 F3). A white striped line delineates the cavity and the perilesional cortex (CC2 and EE2). (G) Table illustrating quantification analysis of %IL-10/Iba-1+ cells in the ipsilateral cortex of WT and NOX2−/− sham and TBI mice. (H) High magnification (inset circle in DD2) of a representative image for IL-10 positive (h1) microglia/macrophage (h2h3, Iba-1 in green, dapi in blue) showing cytoplasmic and perinuclear IL-10 mRNA expression with puncta spike that represents a single IL-10 mRNA transcript (white arrowheads in h1). Scale bars 75 μm for CC2 and EE2; F2; 50 μm DD2, FF2; and 20 μm for h1h3
Fig. 7
Fig. 7
Increased expression of anti-inflammatory markers in the cortex of NOX2−/− TBI mice is associated with enhanced IL-10/STAT3 signaling. (a) Protein expression of phosphorylated STAT3 and phosphorylated STAT6 was assessed by western immunoblotting in the ipsilateral cortex of WT and NOX2−/− sham and TBI mice at 72 h post-injury. (b) pSTAT3 expression was significantly increased in WT and NOX2−/− TBI mice (*** P < 0.001, vs. sham; ANOVA). pSTAT3 expression was significantly increased in the cortex of NOX2−/− TBI mice when compared to WT TBI mice (+ P < 0.05, WT TBI vs. NOX2−/− TBI; ANOVA). (c) TBI significantly increased pSTAT6 expression in the cortex of WT and NOX2−/− mice (*** P < 0.001, vs. sham; ANOVA); there was no genotype-related differences in pSTAT6 expression following TBI. (d-i) TBI significantly increased IL-4Rα (d), SOCS3 (e), TGFβ (f), SHIP1 (g), Arg1 (h), and YM1 (i) mRNA expression in the ipsilateral cortex of WT and NOX2−/−mice at 72 h post-injury (*** P < 0.001, vs. sham; ANOVA). The expression of each anti-inflammatory marker was significantly increased in NOX2−/− TBI mice when compared to WT TBI mice (+ P < 0.05, ++ P < 0.01, WT TBI vs. NOX2−/− TBI; ANOVA; d-i). All data are expressed as means (±SEM; n = 5)
Fig. 8
Fig. 8
IL-10 promotes an anti-inflammatory environment in cortex of NOX2−/− TBI mice. (a) Neutralizing anti-IL-10 (αIL-10; 1 mg/ml, i.c.v.) or control αIgG2b K was administered to WT or NOX2−/− TBI mice for 72 h, and ipsilateral cortex tissue was collected for mRNA analysis. (b-f) TBI increased IL-4Rα (b), SOCS3 (c), TGFβ (d), YM1 (e), and Arg1 (f) mRNA expression in the ipsilateral cortex of WT and NOX2−/−mice (*** P < 0.001, vs. sham; ANOVA). TBI effect on anti-inflammatory marker expression was significantly increased in NOX2−/− TBI mice when compared to WT TBI mice (+ P < 0.05, ++ P < 0.01, +++ P < 0.001, WT αIgG2b K TBI vs. NOX2−/− αIgG2b K TBI; ANOVA). αIL-10 treatment significantly reduced the expression of all anti-inflammatory markers in NOX2−/− TBI mice (# P < 0.05, ## P < 0.01, NOX2−/− αIgG2b K TBI vs. NOX2−/− αIL-10 TBI; ANOVA). All data are expressed as means (±SEM; n = 6)
Fig. 9
Fig. 9
Schematic of NOX2 regulation of macrophage activation. Activation of TLR4 initiates a signaling cascade that leads to activation of NOX2 and increased ROS production; this in turn induces the activation of STAT1, which leads to an increase in the production of pro-inflammatory mediators. TLR4 signaling also induces the production of IL-10, which acts in autocrine fashion to regulate TLR4-induced changes. In NOX2−/− cells, TLR4-induced changes are significantly different; NOX2-deficiency is associated with a decrease in pro-inflammatory markers and significantly greater IL-10 production. This increase in IL-10 leads to a robust increase in STAT3 signaling, which in conjunction with STAT6 activation, leads to increased expression of anti-inflammatory markers

References

    1. Sica A, Mantovani A. Macrophage plasticity and polarization: in vivo veritas. J Clin Invest. 2012;122:787–795. doi: 10.1172/JCI59643. - DOI - PMC - PubMed
    1. Loane DJ, Kumar A. Microglia in the TBI brain: the good, the bad, and the dysregulated. Exp Neurol. 2016;275(Pt 3):316–327. doi: 10.1016/j.expneurol.2015.08.018. - DOI - PMC - PubMed
    1. Murray PJ, Allen JE, Biswas SK, Fisher EA, Gilroy DW, Goerdt S, Gordon S, Hamilton JA, Ivashkiv LB, Lawrence T, et al. Macrophage activation and polarization: nomenclature and experimental guidelines. Immunity. 2014;41:14–20. doi: 10.1016/j.immuni.2014.06.008. - DOI - PMC - PubMed
    1. Gordon S, Martinez FO. Alternative activation of macrophages: mechanism and functions. Immunity. 2010;32:593–604. doi: 10.1016/j.immuni.2010.05.007. - DOI - PubMed
    1. Ohmori Y, Hamilton TA. Requirement for STAT1 in LPS-induced gene expression in macrophages. J Leukoc Biol. 2001;69:598–604. - PubMed

Publication types

MeSH terms