. 2017 Mar 24;18(1):55.
doi: 10.1186/s13059-017-1182-6.

MeDeCom: discovery and quantification of latent components of heterogeneous methylomes

Affiliations

MeDeCom: discovery and quantification of latent components of heterogeneous methylomes

Pavlo Lutsik et al. Genome Biol. .

Abstract

It is important for large-scale epigenomic studies to determine and explore the nature of hidden confounding variation, most importantly cell composition. We developed MeDeCom as a novel reference-free computational framework that allows the decomposition of complex DNA methylomes into latent methylation components and their proportions in each sample. MeDeCom is based on constrained non-negative matrix factorization with a new biologically motivated regularization function. It accurately recovers cell-type-specific latent methylation components and their proportions. MeDeCom is a new unsupervised tool for the exploratory study of the major sources of methylation variation, which should lead to a deeper understanding and better biological interpretation.

Keywords: Cell heterogeneity; DNA methylation; DNA methylome; Deconvolution; Epigenetics; Matrix factorization.


Figures
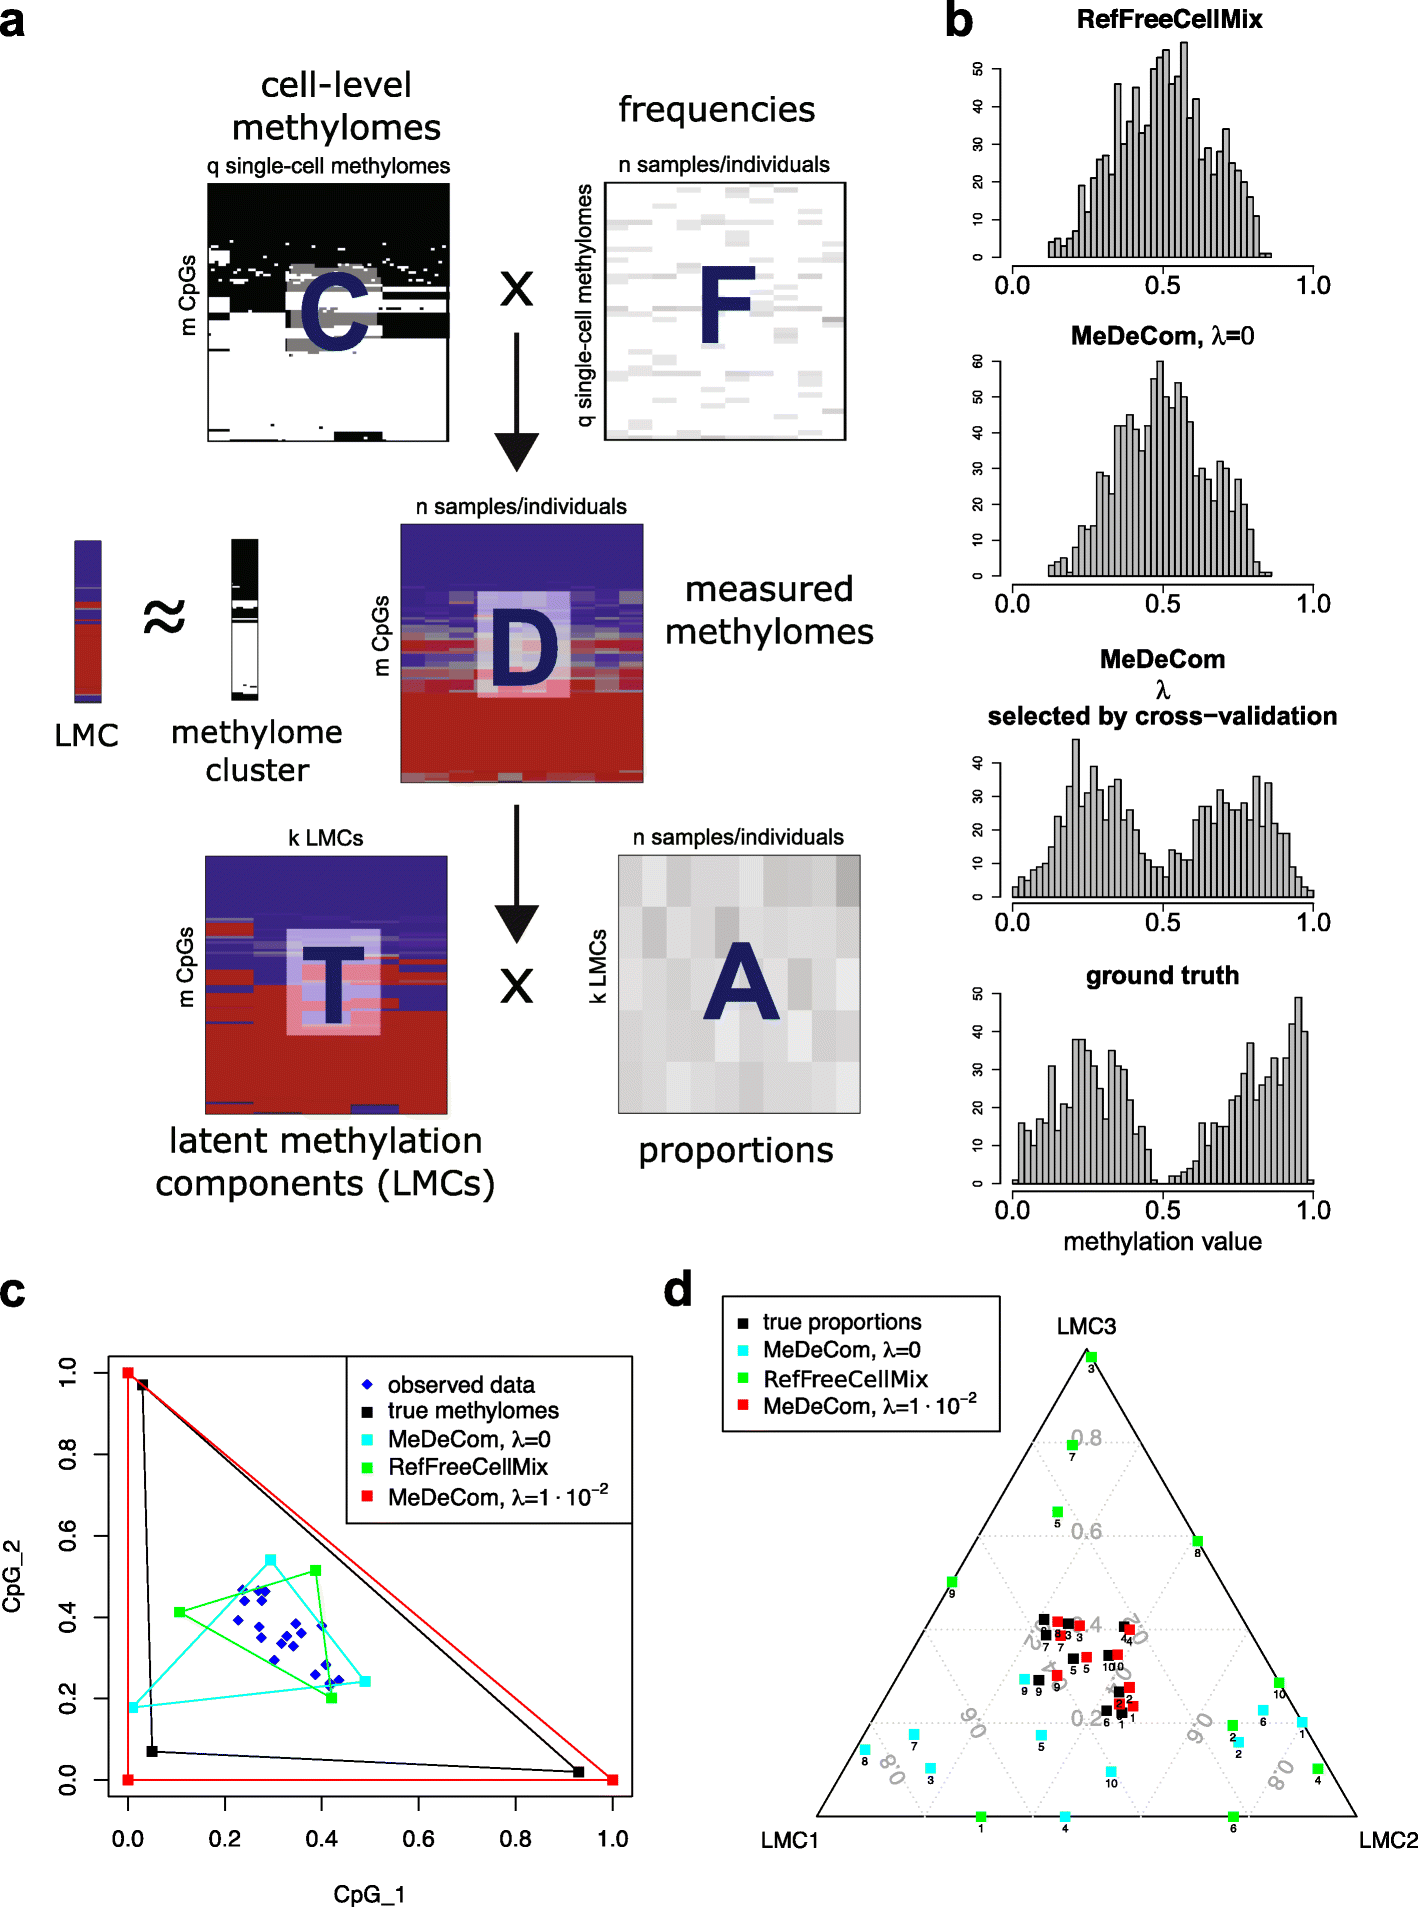
Fig. 1
Fig. 1
Computational framework of MeDeCom. a The conceptional background of MeDeCom. The measured methylomes (e.g., as 450K data, shown in the center) can be seen as a composition of binary single-cell methylome signatures (C) with their frequencies in each sample (F). Single-cell signatures of a particular cell type form a cell-type specific cluster in C. MeDeCom decomposes the measured methylation data into a matrix T, representing latent methylation components (LMCs), which in turn correspond to the averaged cell methylomes of a cell-type-specific cluster in C, and into A, the relative proportions of LMCs (respectively, cell types) in the sample. b Histograms of the values in the estimated T matrices for the 500 most varying CpG sites for the cell reconstruction experiment of neuronal cells (see text). We observe that both MeDeCom with no regularization (λ=0), and RefFreeCellMix are unable to match the distribution of the reference profiles (ground truth), which is biased towards zero and one. However, MeDeCom with our regularizer (parameter λ is chosen by cross-validation) biases the entries of the LMCs towards zero (unmethylated) and one (methylated). Thus, the distribution of the entries of the estimated LMCs matches approximately the ground truth leading to a significantly better estimation of T as well as A. c-d Geometric intuition about the different methods for a fully synthetic example of two CpGs (n=30, k=3). Each LMC corresponds to a column of T and, thus, is a point in [0,1]2. c shows the estimated LMCs (squares) of RefFreeCellMix and MeDeCom with λ=0 and λ=10−2, and the ground truth (black squares) together with the data (blue dots). The data points are mixtures of the ground truth points and, thus, lie in the convex hull of the latter. Factorization problem (2) (see “Methods”) is ill-posed as the solution is not unique. MeDeCom with appropriate regularization estimates T (red squares) very accurately as the solution is biased towards zero or one, whereas RefFreeCellMix and MeDeCom with λ=0 are unable to find the correct LMCs. This also leads to huge errors in the estimation of the proportions as visualized by the ternary plot for ten randomly selected data points (d). In contrast, MeDeCom with appropriate regularization estimates A very accurately
Fig. 2
Fig. 2
Testing MeDeCom on simulated and artificial cell mixture data. af Results for the simulated data example with five methylation components, moderately variable mixing proportions, and medium noise level. a Selection of parameters k and λ by cross-validation. b Matching of the recovered LMCs to the true underlying profiles. The dendrogram visualizes the agglomerative hierarchical clustering analysis with correlation-based distance measure and average linkage. cf Recovery of the mixing proportions. Truth stands for true mixing proportions and regression denotes the reference-based proportion estimation as described in “Methods.” In each line plot, the synthetic samples are sorted by ascending true mixing proportion. g, h Results for the ArtMixN data set. g Selection of parameters k and λ by cross-validation. h Recovery of mixing proportions (only NeuN + is shown) for MeDeCom and RefFreeCellMix. RefFreeCellMix misinterprets the most extreme mixtures as pure cell types and, thus, estimates T (see Fig. 1b) as well as the proportions in A wrongly. Notation is the same as in cf
Fig. 3
Fig. 3
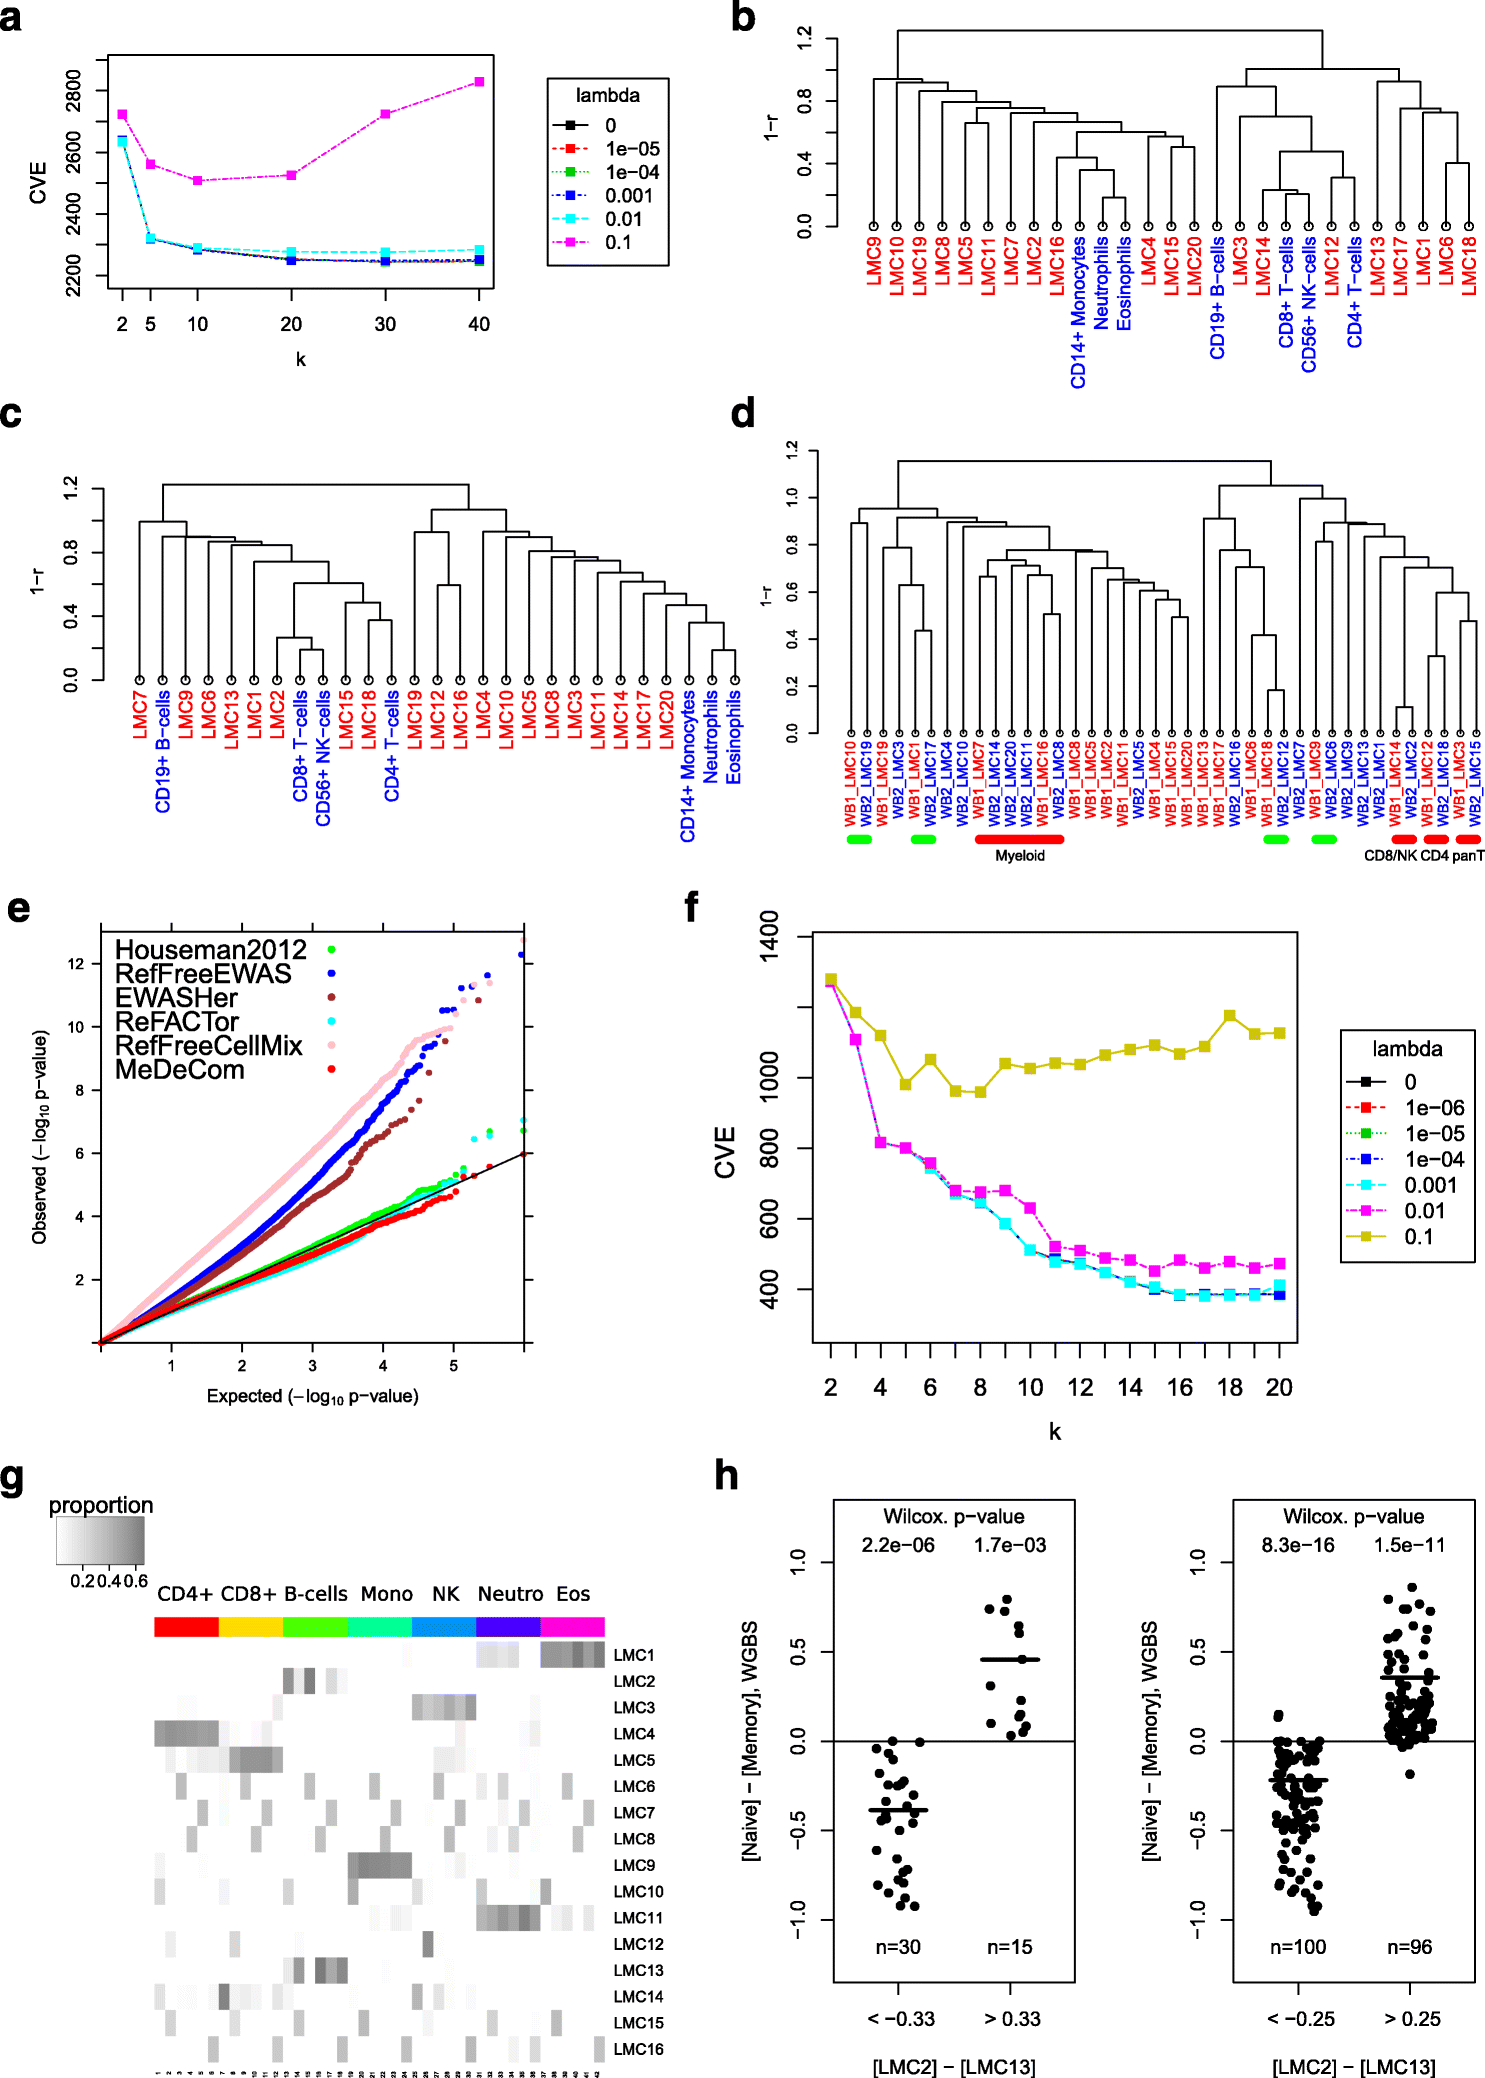
Results for blood cell methylomes. ae WB1 data set. a Selection of parameters k and λ by cross-validation. b Matching the WB1 LMCs to PureBC methylomes (k=20, λ=0.001). Here and below the dendrogram visualizes agglomerative hierarchical clustering analysis with a correlation-based distance measure and average linkage. c Matching the LMCs from the WB2 data set (k=20, λ=0.001) to the PureBC methylomes. d Matching the WB1 and WB2 LMCs to each other. Pairs of reproducible LMCs also matching to the reference profiles are highlighted by red segments. Green segments mark reproducible LMCs that do not directly match any of the reference profiles. e Adjustment of the association analysis for rheumatoid arthritis in the full Liu et al. data set [35]. Each curve is a Q-Q plot of P values observed in the corresponding analysis versus the expected P values sampled from a uniform distribution. fh PureBC data. f Selection of parameters k and λ by cross-validation. g Heat map of recovered proportions in PureBC data (k=15, λ=0.001). Rows represent LMCs while columns correspond to individual purified samples. The order of blood donors is the same within column sets, corresponding to one cell type. h Methylation differences in naive versus memory B cells at CpGs differentially methylated between LMC2 and LMC13 from the PureBC data set. WGBS methylation profiles of naive and memory B cells were obtained from BLUEPRINT. The value for memory B cells is an average of three WGBS samples. A Wilcoxon ranked sum test was used to test the null hypothesis that WBGS methylation calls are the same in naive and memory cells at their respective CpG positions
Fig. 4
Fig. 4
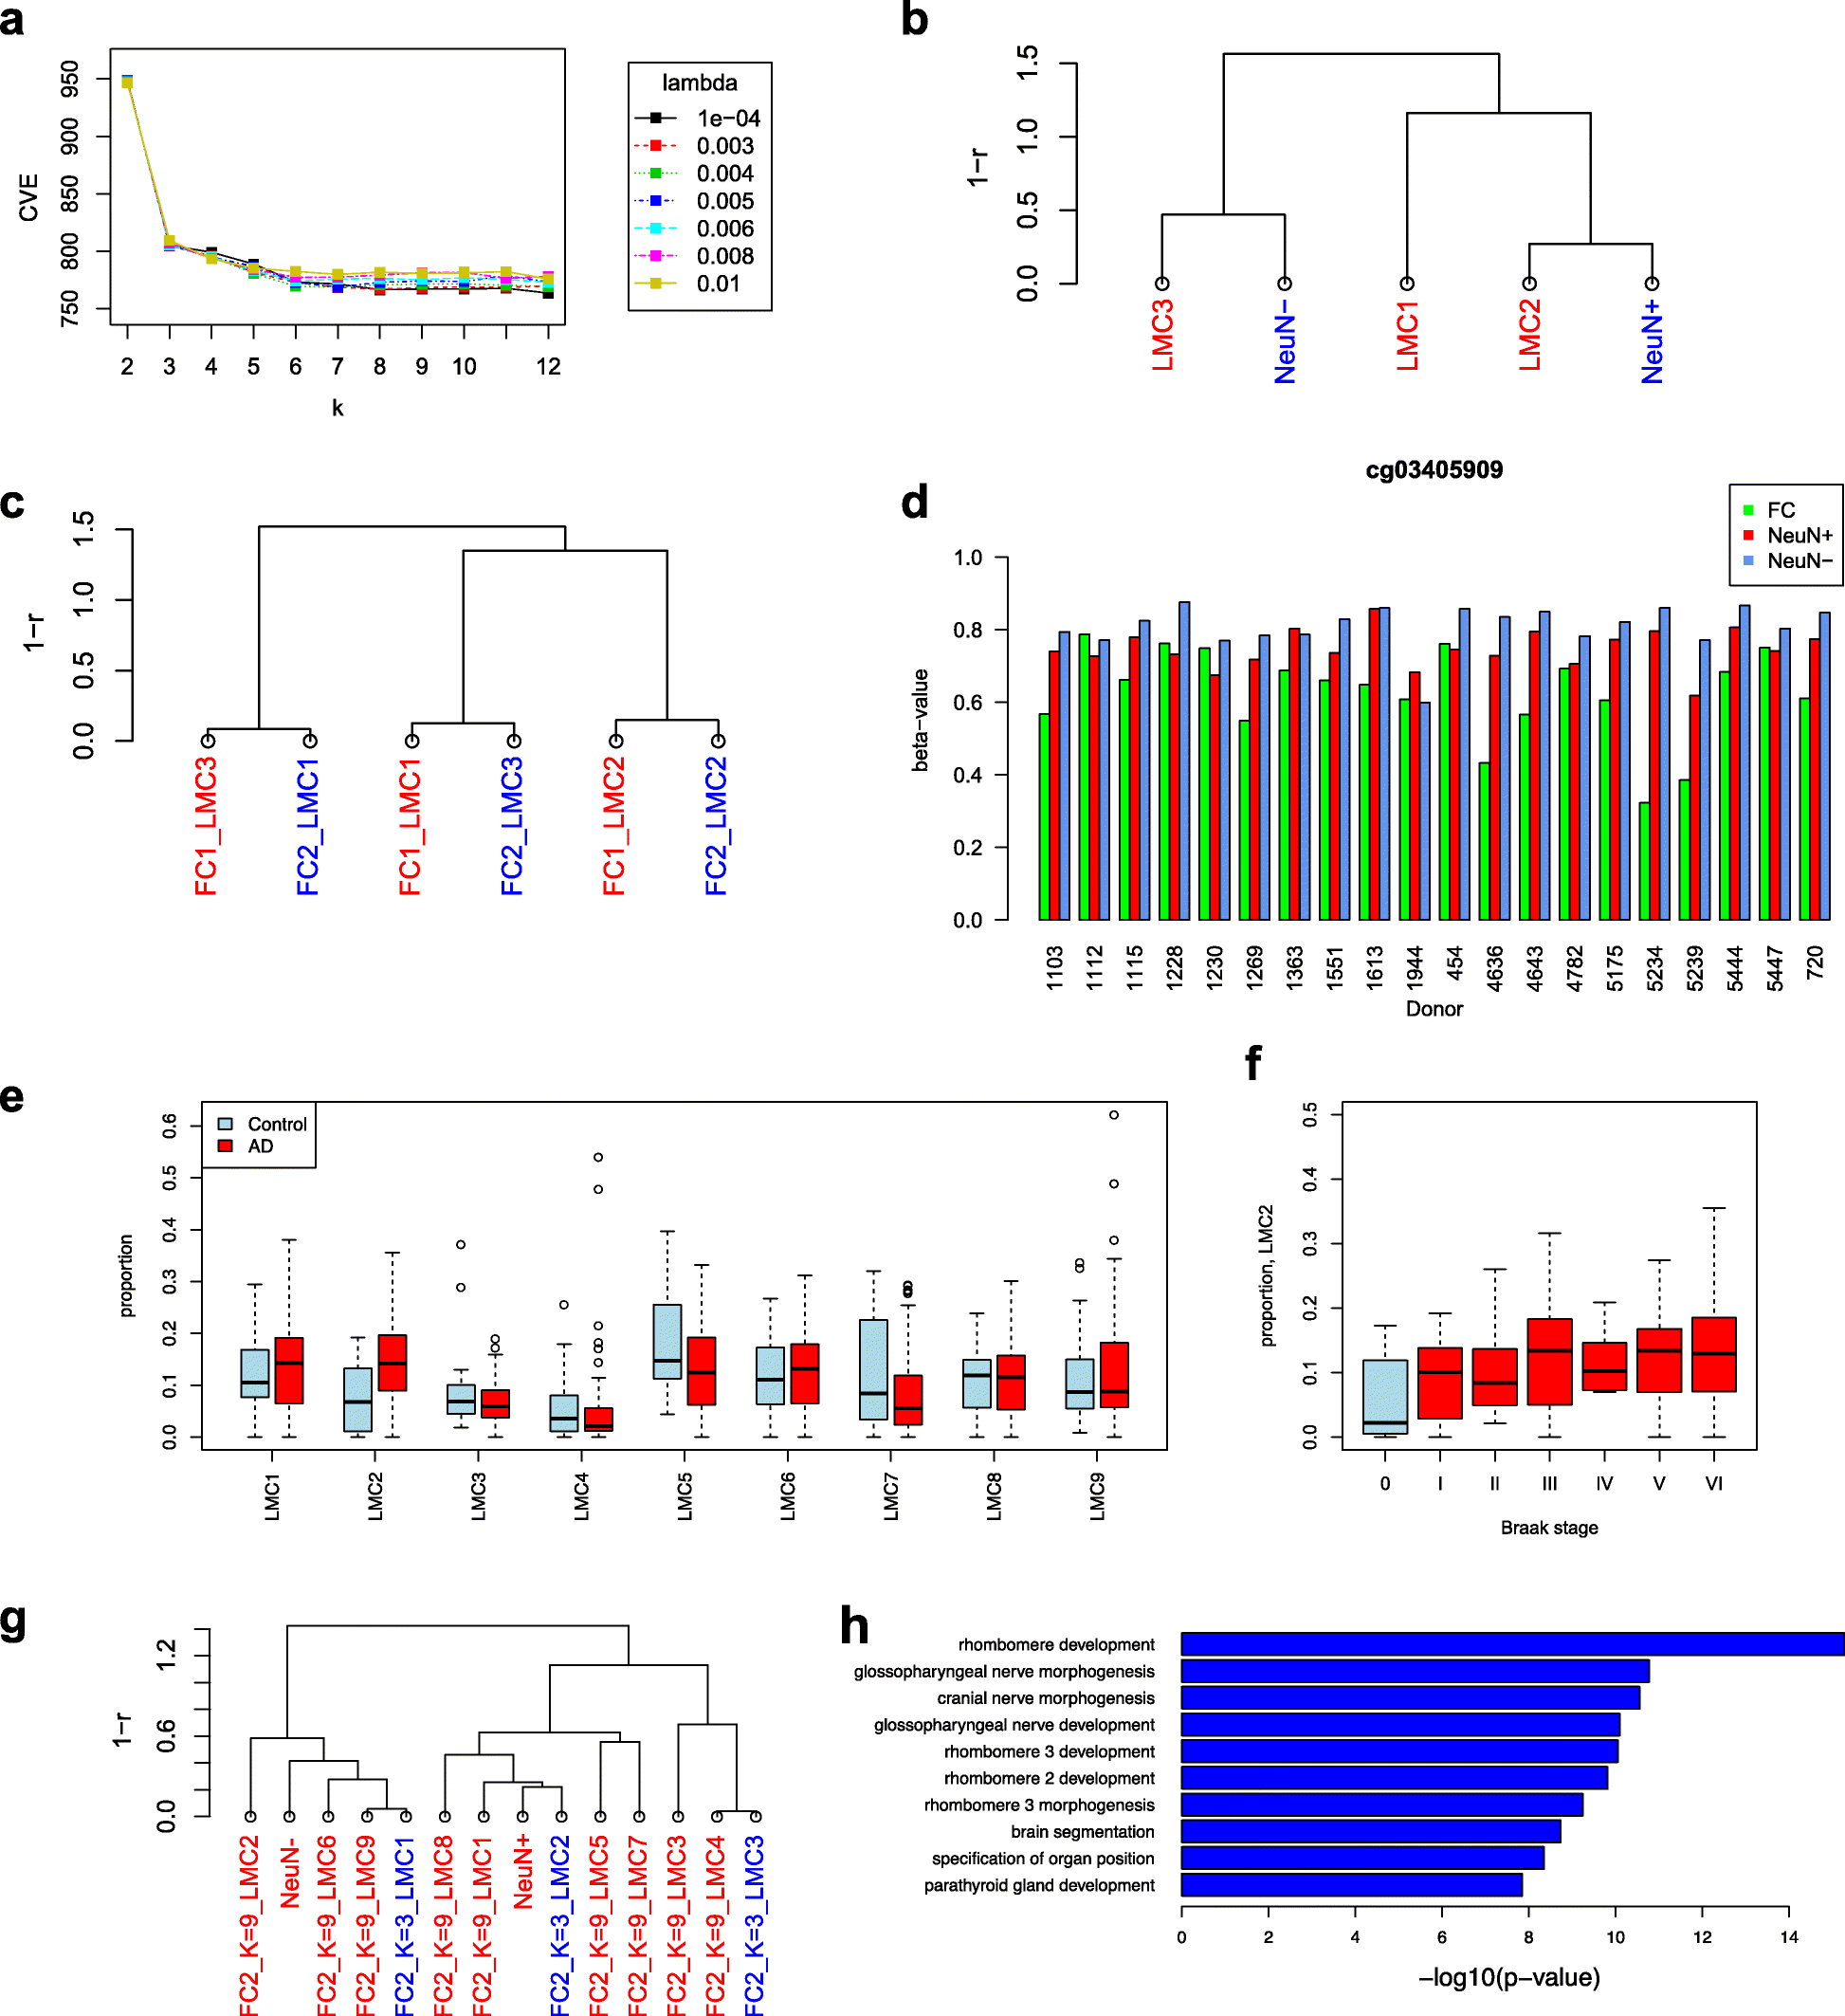
Results for brain methylomes. ad Decomposition of the FC1 data set. a Selection of parameters k and λ by cross-validation. b Matching frontal cortex LMCs to the reference NeuN +/− profiles. The dendrogram visualizes agglomerative hierarchical clustering analysis with a correlation-based distance measure and average linkage. c Matching of LMCs between FC1 and FC2. d Example of an LMC1-specific CpG (k=3) in the PAX6 locus. e, f AD-associated LMCs in the FC2 data set. e LMC2 is associated with the AD phenotype (Wilcoxon rank sum test P=3.1×10⁻⁴). f LMC2 is also significantly associated with the Braak stage (P=4.8×10⁻³, T test of the linear regression coefficient). g Clustering of the recovered LMCs for k=9 with the LMCs for k=3 and reference profiles. LMC2 belongs to the NeuN -associated cluster. h Most significant gene ontology terms from the biological process category for the LMC2-associated hypermethylated genes

References

    1. Schübeler D. Function and information content of DNA methylation. Nature. 2015;517(7534):321–6. doi: 10.1038/nature14192. - DOI - PubMed
    1. Pelizzola M, Ecker JR. The DNA methylome. FEBS Lett. 2011;585(13):1994–2000. doi: 10.1016/j.febslet.2010.10.061. - DOI - PMC - PubMed
    1. Roadmap Epigenomics Consortium. Kundaje A, Meuleman W, Ernst J, Bilenky M, Yen A, et al. Integrative analysis of 111 reference human epigenomes. Nature. 2015;518(7539):317–30. doi: 10.1038/nature14248. - DOI - PMC - PubMed
    1. Reik W, Dean W, Walter J. Epigenetic reprogramming in mammalian development. Science. 2001;293(5532):1089–93. doi: 10.1126/science.1063443. - DOI - PubMed
    1. Baron U, Türbachova I, Hellwag A, Eckhardt F, Berlin K, Hoffmuller U, et al. DNA methylation analysis as a tool for cell typing. Epigenetics. 2006;1(1):55–60. doi: 10.4161/epi.1.1.2643. - DOI - PubMed

Publication types