. 2017 Apr 3;214(4):959-972.
doi: 10.1084/jem.20170193. Epub 2017 Mar 24.

Proliferation of latently infected CD4+ T cells carrying replication-competent HIV-1: Potential role in latent reservoir dynamics

Affiliations

Proliferation of latently infected CD4+ T cells carrying replication-competent HIV-1: Potential role in latent reservoir dynamics

Nina N Hosmane et al. J Exp Med. .

Abstract

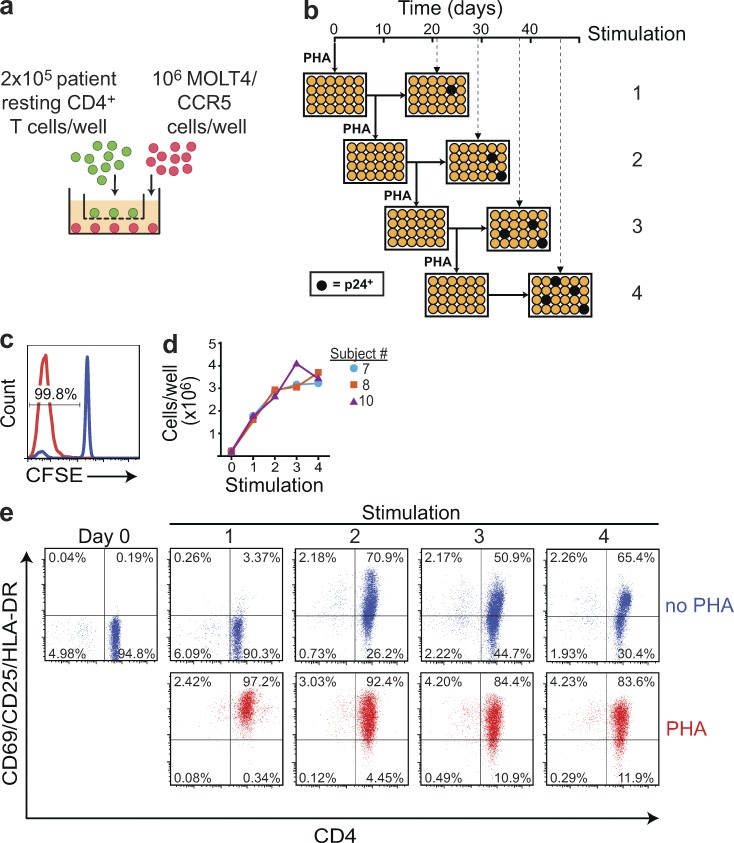
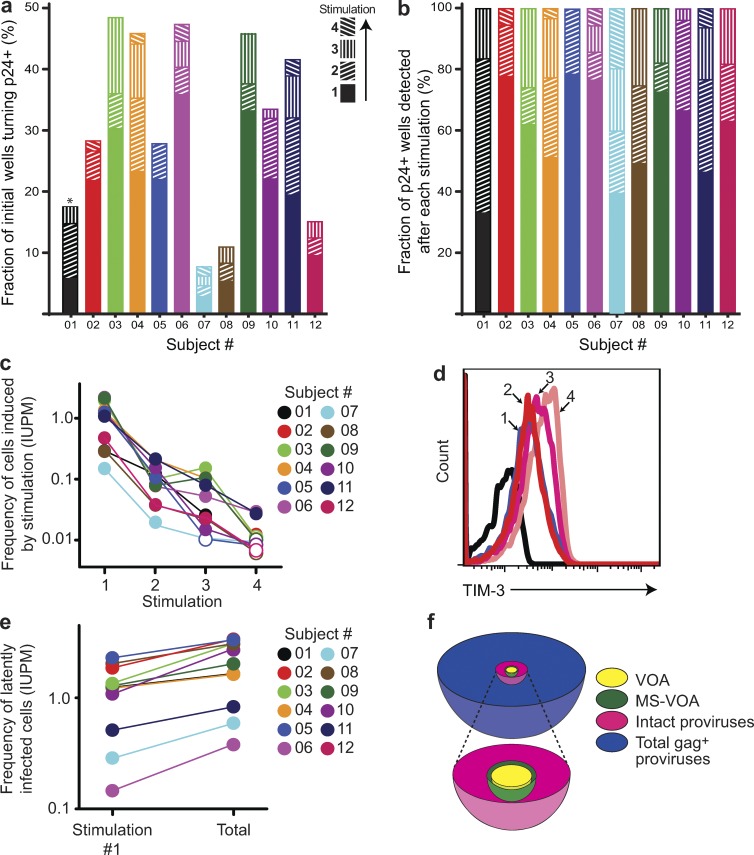
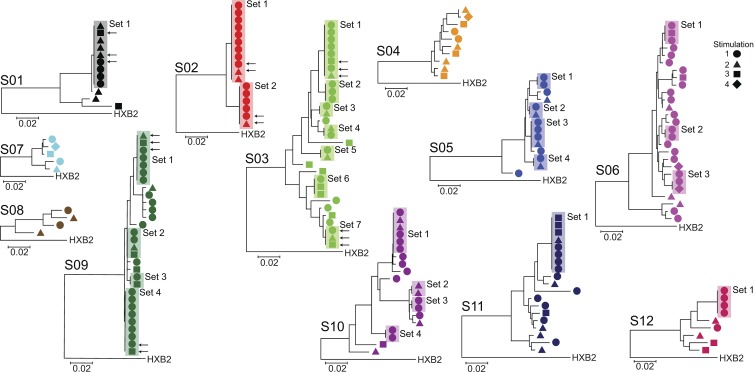
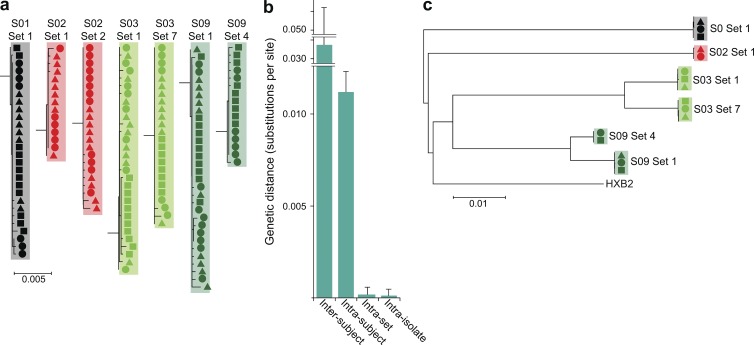
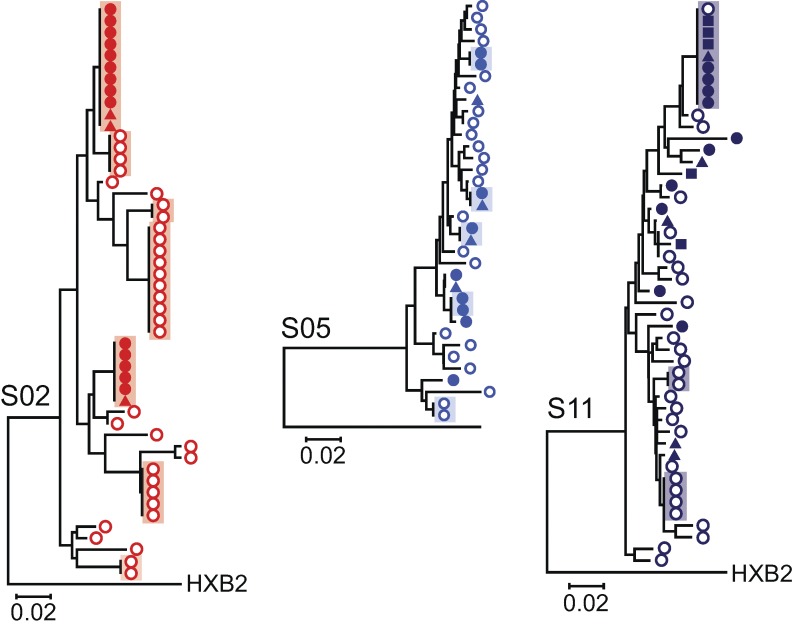
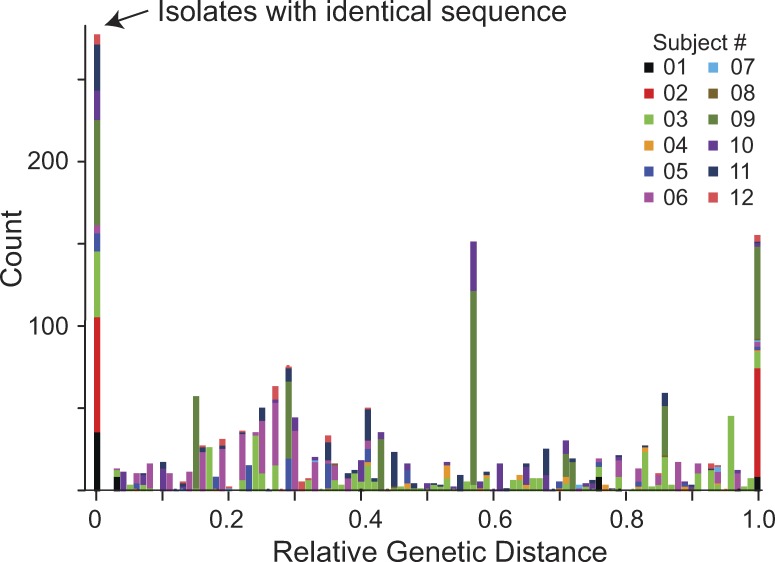
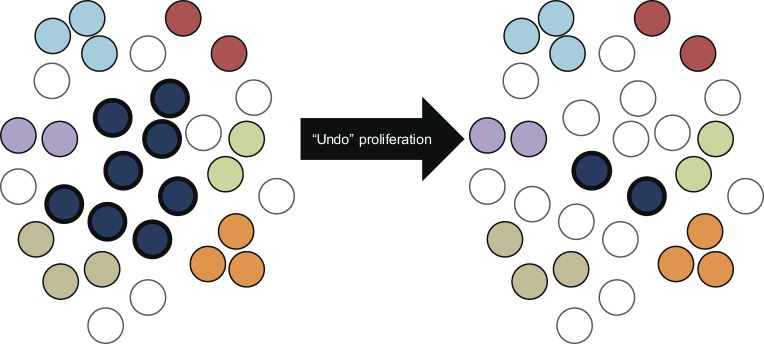
A latent reservoir for HIV-1 in resting CD4+ T lymphocytes precludes cure. Mechanisms underlying reservoir stability are unclear. Recent studies suggest an unexpected degree of infected cell proliferation in vivo. T cell activation drives proliferation but also reverses latency, resulting in productive infection that generally leads to cell death. In this study, we show that latently infected cells can proliferate in response to mitogens without producing virus, generating progeny cells that can release infectious virus. Thus, assays relying on one round of activation underestimate reservoir size. Sequencing of independent clonal isolates of replication-competent virus revealed that 57% had env sequences identical to other isolates from the same patient. Identity was confirmed by full-genome sequencing and was not attributable to limited viral diversity. Phylogenetic and statistical analysis suggested that identical sequences arose from in vivo proliferation of infected cells, rather than infection of multiple cells by a dominant viral species. The possibility that much of the reservoir arises by cell proliferation presents challenges to cure.


Figures

Figure 1.
Figure 1.
MS-VOA. (a) A transwell co-culture system (Ho et al., 2013) was used to allow separate manipulation of patient CD4+ T cells (green) and MOLT4/CCR5 cells (red). Purified resting CD4+ T cells from subjects on ART were plated at a limiting dilution for viral outgrowth and stimulated with PHA and irradiated allogeneic PBMCs (not depicted) as previously described (Finzi et al., 1997, 1999; Siliciano et al., 2003; Laird et al., 2016). After 24 h, PHA was removed, and 106 MOTL4/CCR5 cells were added. Outgrowth in this system is equivalent to standard co-cultures (Ho et al., 2013). (b) Assay time course. At 8 d after the initial PHA stimulation, half the volume from the top and bottom chambers of each transwell was transferred to a new set of transwell plates for a second round of PHA stimulation. The initial plates were cultured without further stimulation for a total of 21 d. The restimulated plates were cultured for 8 d after the second round of PHA stimulation and then split as above to generate a third set of plates, which received a third round of stimulation. Similarly, these plates were split 8 d later to generate the fourth set of plates, which received a fourth round of stimulation. A p24 ELISA was performed 21 d after each respective round of PHA stimulation to quantify viral outgrowth (dashed lines). In this hypothetical example, each round of PHA stimulation induced outgrowth from an additional well (black circles). (c) PHA stimulation induces uniform proliferation of resting CD4+ T cells. Immediately before the first PHA stimulation, an aliquot of resting CD4+ T cells was stained with CFSE. CFSE dilution was quantitated by flow cytometry 7 d after stimulation to determine the fraction of cells that had proliferated (red histogram). Cells that did not receive PHA stimulation served as controls (blue histograms). The histogram is representative of CFSE dilution from three subjects. (d) Increase in cell number after each round of stimulation. Results for three representative subjects are shown. (e) Activation marker expression induced by each round of PHA stimulation. Cells were stained with antibodies to CD4 (x axis) and the activation markers CD25, CD69, and HLA-DR (y axis) 7 d after the indicated round of PHA stimulation (red dot plots). Cells that did not receive the most recent round of PHA stimulation were analyzed in parallel (blue dot plots). Results are shown for subject 10 and are representative of two other subjects analyzed.
Figure 2.
Figure 2.
Further rounds of T cell activation induce additional proviruses to produce replication-competent virus. (a) Fraction of initially seeded wells becoming p24+ after each of four consecutive stimulations with PHA. For each subject (n = 12), a total of 64–72 wells were initially seeded. The asterisk indicates that cells from subject 1 only received three rounds of PHA stimulation. (b) Fraction of total p24+ wells from each subject (n = 12) that were detected for each round of PHA stimulation. The denominator is the total number of initially seeded wells. (c) Frequency of cells in the culture at the time of stimulation that are induced to produce replication-competent virus by the indicated round of stimulation. Frequency in infectious units per million (IUPM) cells was determined for each subject (n = 12) from mean cell counts before each stimulation and the number of wells turning p24+ after stimulation using a maximum likelihood estimation of infected cell frequency (Rosenbloom et al., 2015). (d) Expression of TIM-3 before stimulation (black line) and 7 d after the indicated round of stimulation. Results are presentative of exhaustion marker analysis in three subjects. (e) Frequency of latently infected cells among the initially plated cells from each subject (n = 12) as detected after a single round of PHA stimulation and after a total of four consecutive rounds of stimulation. (f) Schematic representation of the relative frequency of infected resting CD4+ T cells detected by different assays. The VOA result presents the mean frequency detected after a single round of PHA stimulation in cultures from 12 subjects studied here. The MS-VOA result represents the mean frequency among the initially plated cells of latently infected cells as detected by a total of four consecutive rounds of PHA stimulation. The frequencies of cells with intact (nondefective) proviruses and the total frequency of infected cells as measured by PCR with gag primers were estimated from the VOA results and the ratios described by Bruner et al. (2016). The true frequency of latently infected cells is between the frequency measured in the MS-VOA and the frequency of cells with intact proviruses.
Figure 3.
Figure 3.
Many independent isolates of replication-competent HIV-1 have identical sequences. Phylogenetic trees of env sequences of independent isolates of replication-competent virus from each subject (n = 12). Sequencing was performed on genomic viral RNA in supernatants of p24+ wells. Cultures were established at limit dilution for viral outgrowth. Isolates containing more than a single sequence as indicated by double peaks at one or more positions in the chromatograms were not further analyzed. Symbols indicate the number of PHA stimulations after which the isolate was obtained. Sets of isolates with identical env sequences are boxed. Representative isolates obtained after different numbers of stimulations (arrows) from randomly selected sets were subjected to full-length sequencing at the single-genome level (see Fig. 4).
Figure 4.
Figure 4.
Full-genome analysis of isolates with identical env sequences. (a) Full-genome sequences of isolates with identical env sequences. Randomly selected isolates (arrows in Fig. 3) belonging to sets of isolates with identical env sequence were subjected to full-length sequencing. Sequencing was performed on single HIV-1 genomic RNA molecules present in the supernatants of p24+ cultures after reverse transcription and nested PCR amplification performed at limiting dilution. Two overlapping half-genome fragments were amplified. To minimize errors, PCR products were directly sequenced without cloning. For each isolate, 6–12 limiting 5′ sequences and 6–12 3′ sequences were obtained. Neighbor joining phylogenetic trees demonstrated that all sequences from a given set of isolates with identical env sequences co-clustered. The minimal differences (one to four nucleotides) likely reflect mutations expected to arise during the 3-wk outgrowth culture. Symbols indicate the PHA stimulation after which the isolates were detected, as in Fig. 3. Results are shown for the 5′ half-genome sequences. Similar results were obtained for the 3′ half-genome sequences. (b) Genetic distance (mean ± SD) between single-genome sequences from a single isolate (intra-isolate), between single-genome sequences from different isolates belonging to a set of isolates with identical env sequences (intra-set), between single-genome sequences from different sets from the same study subject (intra-subject), and between single genome sequences from different patients. For each set of two to three isolates from a given subject, 6–12 sequences were used for intra-isolate and intra-set comparisons. Then, all sequences were used for intra-subject and inter-subject comparisons. (c) Phylogenetic tree of full-genome consensus sequences. The 6–12 single half-genome sequences from each isolate were condensed to half-genome consensus sequences, which were joined to produce full-genome sequences. Set 2 from subject 2 is not depicted because of failure of the 3′ half-genome reaction as a result of primer mismatch.
Figure 5.
Figure 5.
Isolates with identical sequence are part of more complex proviral populations reflecting diversification over time during chronic infection. Limiting dilution analysis of proviruses present in resting CD4+ T cells was performed on cells from three representative patients from whom sets of identical isolates of replication-competent virus were obtained. The V3-V4 region of env was sequenced, and the resulting sequences (open circles) were used in phylogenetic analysis along with the replication-competent isolates (closed symbol; shapes reflect the number of PHA stimulation as in Fig. 3). Sets of identical independent sequences are boxed.
Figure 6.
Figure 6.
Distribution of genetic distances between isolates of replication-competent virus from individual subjects (n = 12) does not support infection of a large number of cells by a dominant viral population. Composite histogram showing the distribution of intra-subject genetic distances between isolates of replication-competent virus. To account for differing degrees of genetic divergence over time in different subjects, distances are normalized by the largest observed intra-subject distance. Analysis is based on the highly variable V3-V4 region of the env gene obtained as described in Fig. 3. The large peak at the origin reflects the zero branch lengths between independent identical isolates of replication-competent virus obtained from 9 of 12 patients.
Figure 7.
Figure 7.
Schematic illustration of a statistical test based on coalescent theory to explore the possibility that the high degree of sequence identity observed could be explained merely by rounds of viral replication in which no mutation occurred. The left side of the figure represents the sample from participant 03 as analyzed by sequencing of the env gene in supernatant HIV-1 RNA from clonal p24+ wells (see Fig. 3). A total of 31 independent isolates were obtained, including one set with eight isolates (dark blue cells), six smaller sets (other colors), and eight unique isolates (singletons). The right side imagines a sample of the same size that would have been collected had no clonal proliferation occurred. The large clone is reduced to the size that maximizes likelihood under a neutral coalescent, and singletons are added to keep the total sample the same size. Because reducing the large clone essentially adds a parameter, a likelihood ratio test can be done. As shown in Table 1, p-values for all subjects tested in this manner were <0.05, indicating that mutation-free viral replication is an insufficient explanation for the data.

Comment in

  • HIV: Persistence through division.
    Cohn LB, Nussenzweig MC. Cohn LB, et al. J Exp Med. 2017 Apr 3;214(4):875-876. doi: 10.1084/jem.20170463. Epub 2017 Mar 27. J Exp Med. 2017. PMID: 28348204 Free PMC article.

Similar articles

Cited by

References

    1. Abram M.E., Ferris A.L., Shao W., Alvord W.G., and Hughes S.H.. 2010. Nature, position, and frequency of mutations made in a single cycle of HIV-1 replication. J. Virol. 84:9864–9878. 10.1128/JVI.00915-10 - DOI - PMC - PubMed
    1. Anderson A.C., Joller N., and Kuchroo V.K.. 2016. Immunity. 44:989–1004. 10.1016/j.immuni.2016.05.001 - DOI - PMC - PubMed
    1. Archin N.M., Liberty A.L., Kashuba A.D., Choudhary S.K., Kuruc J.D., Crooks A.M., Parker D.C., Anderson E.M., Kearney M.F., Strain M.C., et al. . 2012. Administration of vorinostat disrupts HIV-1 latency in patients on antiretroviral therapy. Nature. 487:482–485. 10.1038/nature11286 - DOI - PMC - PubMed
    1. Bailey J.R., Sedaghat A.R., Kieffer T., Brennan T., Lee P.K., Wind-Rotolo M., Haggerty C.M., Kamireddi A.R., Liu Y., Lee J., et al. . 2006. Residual human immunodeficiency virus type 1 viremia in some patients on antiretroviral therapy is dominated by a small number of invariant clones rarely found in circulating CD4+ T cells. J. Virol. 80:6441–6457. 10.1128/JVI.00591-06 - DOI - PMC - PubMed
    1. Banga R., Procopio F.A., Noto A., Pollakis G., Cavassini M., Ohmiti K., Corpataux J.M., de Leval L., Pantaleo G., and Perreau M.. 2016. PD-1+ and follicular helper T cells are responsible for persistent HIV-1 transcription in treated aviremic individuals. Nat. Med. 22:754–761. 10.1038/nm.4113 - DOI - PubMed

Publication types

Associated data