. 2017 May;206(1):105-118.
doi: 10.1534/genetics.116.190660. Epub 2017 Mar 24.

Estimating Seven Coefficients of Pairwise Relatedness Using Population-Genomic Data

Affiliations

Estimating Seven Coefficients of Pairwise Relatedness Using Population-Genomic Data

Matthew S Ackerman et al. Genetics. 2017 May.

Abstract

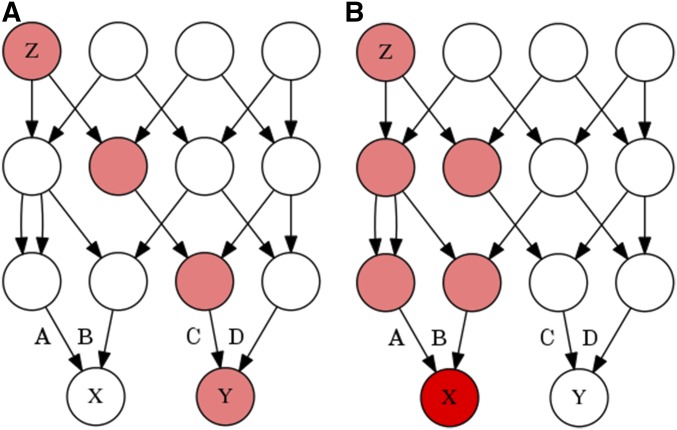
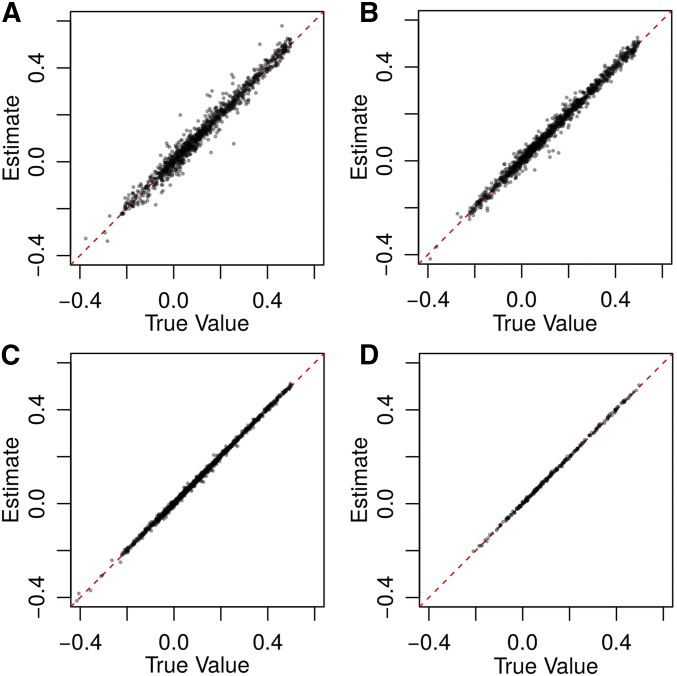
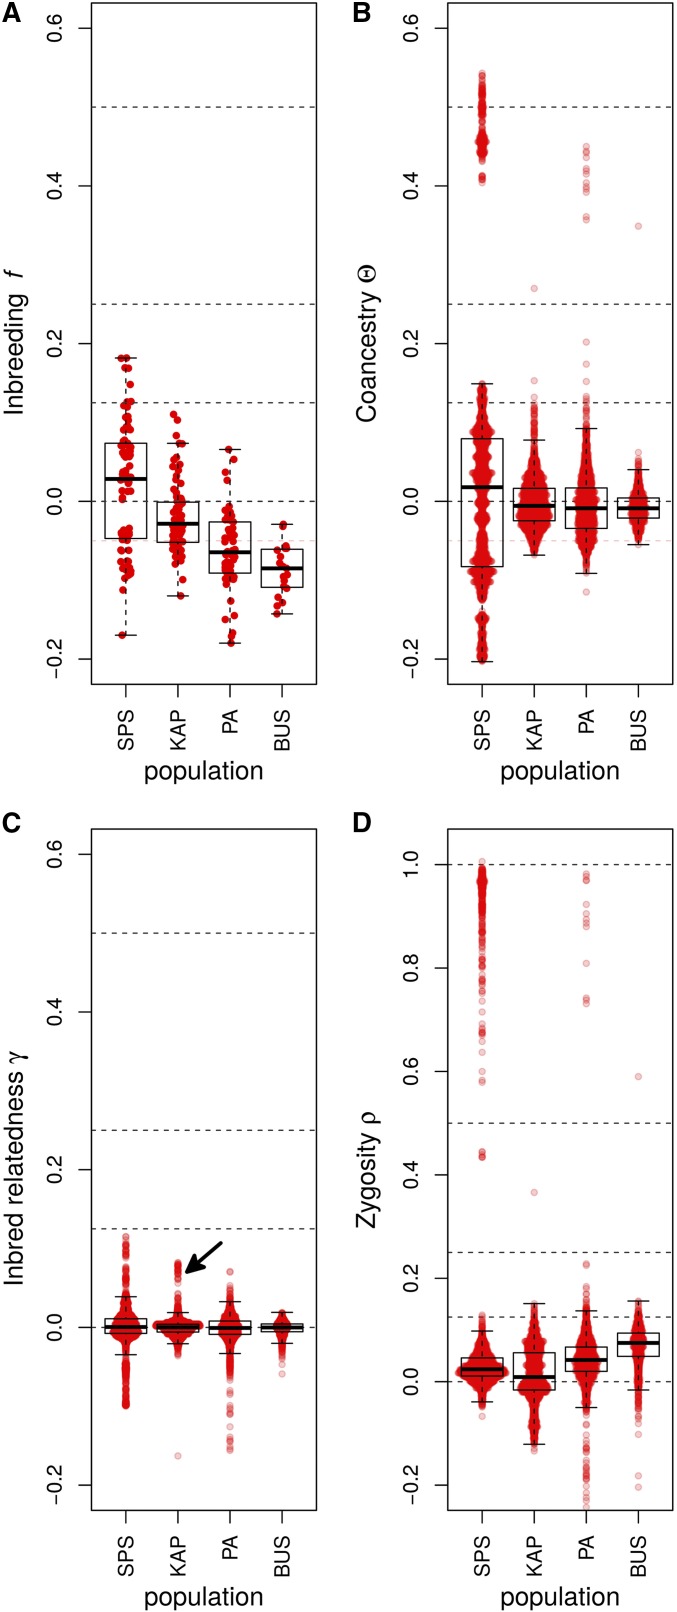
Population structure can be described by genotypic-correlation coefficients between groups of individuals, the most basic of which are the pairwise relatedness coefficients between any two individuals. There are nine pairwise relatedness coefficients in the most general model, and we show that these can be reduced to seven coefficients for biallelic loci. Although all nine coefficients can be estimated from pedigrees, six coefficients have been beyond empirical reach. We provide a numerical optimization procedure that estimates all seven reduced coefficients from population-genomic data. Simulations show that the procedure is nearly unbiased, even at 3× coverage, and errors in five of the seven coefficients are statistically uncorrelated. The remaining two coefficients have a negative correlation of errors, but their sum provides an unbiased assessment of the overall correlation of heterozygosity between two individuals. Application of these new methods to four populations of the freshwater crustacean Daphnia pulex reveal the occurrence of half siblings in our samples, as well as a number of identical individuals that are likely obligately asexual clone mates. Statistically significant negative estimates of these pairwise relatedness coefficients, including inbreeding coefficients that were typically negative, underscore the difficulties that arise when interpreting genotypic correlations as estimations of the probability that alleles are identical by descent.

Keywords: coancestry; identity by descent; population genomics; population structure; relatedness.


Figures

Figure 1
Figure 1
Two genealogies of identical structure which illustrate the stochastic model of genotypic correlations. In both of these genealogies a mutation is present in ancestor Z, making Z heterozygous for some trait (pink). The allele is then transmitted to Z’s offspring with a probability of 1/2 for each, and thus gamete A has a probability of 1/4, and (A) B and C each have a probability of 1/8 of carrying the mutant allele. If only one individual in the second generation receives the mutant allele, as in (A), then individuals X and Y cannot both receive the mutant allele. However, if in the second generation two individuals possess the mutant allele, as in (B), then A has a probability of 1/2, and B and C each have a probability of 1/4 of carrying the mutant allele. The coefficient of identity between X and Y is calculated depending on whether the probability of the gamete carrying the mutant allele A, B, or C is conditioned merely on Z being heterozygous, or on the genotypes of individuals in generations following Z.
Figure 2
Figure 2
Results from 10,000 simulations using (A) 3× and (B) 10× coverage at 5000 loci; and (C) 3× and (D) 10× coverage at 100,000 loci. Allele frequencies were drawn from a triangular distribution as described and reported without error. All seven genotypic-correlation coefficients are graphed jointly. A summary of biases and MSEs can be found in Table S3 in File S1.
Figure 3
Figure 3
Violin plots of the errors (ε) of allele-frequency estimates from the programs mapgd and VCFtools. The horizontal width of the red bars represents the frequency of observations with the corresponding values of ε. The black box shows the median (heavy black line), boundaries of the upper and lower quartile (so that 50% of all errors are contained within the box), and the whiskers denote observations within 1.5 interquartile range of the upper and lower quartiles. Results from 10,000 estimates of a population of 98 individuals with 3× coverage. Alleles are drawn from a neutral spectrum. Allele frequencies in VCFtools are calculated by the VCFtools –freq command.
Figure 4
Figure 4
Box plots of the genotypic-correlation coefficients of (A) inbreeding (f), (B) coancestry (Θ), (C) inbred relatedness (γ), and (D) zygosity (ρX¨Y¨) estimated in the four Daphnia populations. The arrow in (C) indicates a group of nine individuals analyzed in more detail in Figure S1B. The individual pairwise estimates are shown as red points. Because Θ, γ, and ρ are pairwise estimators, 4500 comparisons exist in each population for these coefficients, while only 95 estimates exist for f. Dashed lines are placed at 1, 0.5, 0.25, 0.125, and 0 to allow easier assignment of relationship status. SPS, Spring Pond South.

References

    1. Abney M., McPeek M. S., Ober C., 2000. Estimation of variance components of quantitative traits in inbred populations. Am. J. Hum. Genet. 66: 629–650. - PMC - PubMed
    1. Anderson A. D., Weir B. S., 2007. A maximum-likeihood method for the estimation of pairwise relatedness in structured populations. Genetics 176: 421–440. - PMC - PubMed
    1. Browning B. L., Browning S. R., 2013. Improving the accuracy and efficiency of identity-by-descent detection in population data. Genetics 194: 459–471. - PMC - PubMed
    1. Cockerham C., 1971. Higher order probability functions of identity of alleles by descent. Genetics 69: 235–246. - PMC - PubMed
    1. Cockerham C., 1983. Covariances of relatives from self-fertilization. Crop Sci. 23: 1177–1180.

Publication types

LinkOut - more resources