. 2017 May;206(1):389-406.
doi: 10.1534/genetics.116.196972. Epub 2017 Mar 24.

Rapid Adaptation of a Polygenic Trait After a Sudden Environmental Shift

Affiliations

Rapid Adaptation of a Polygenic Trait After a Sudden Environmental Shift

Kavita Jain et al. Genetics. 2017 May.

Abstract

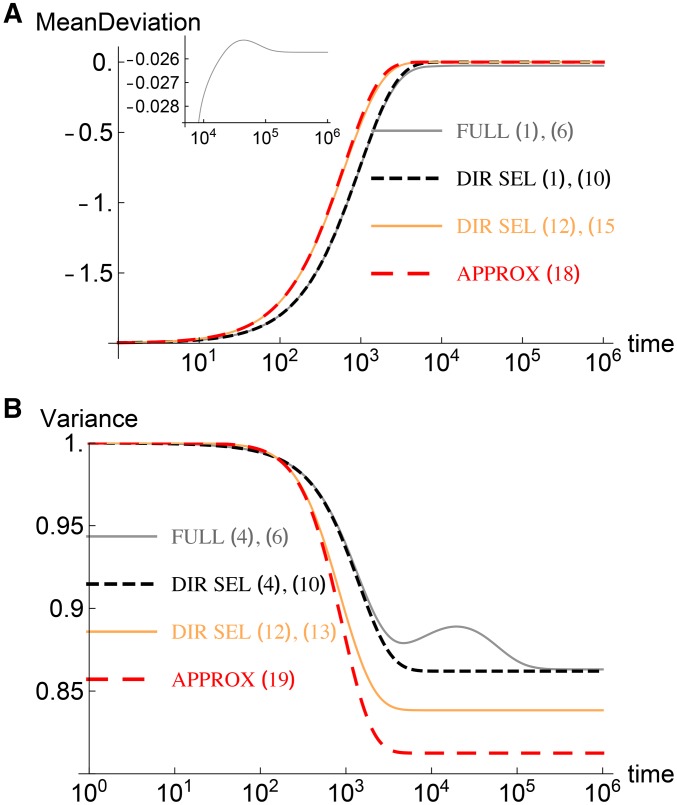
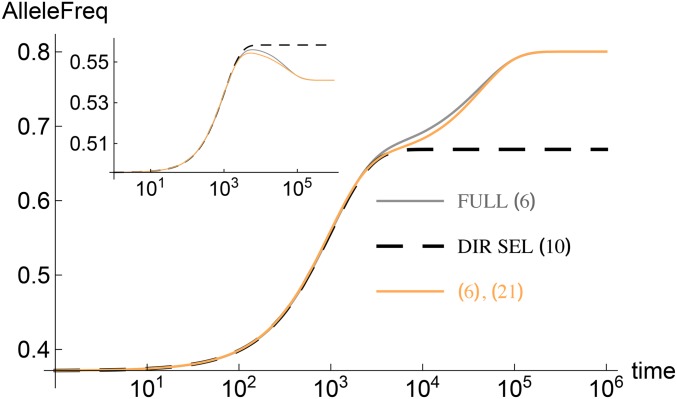
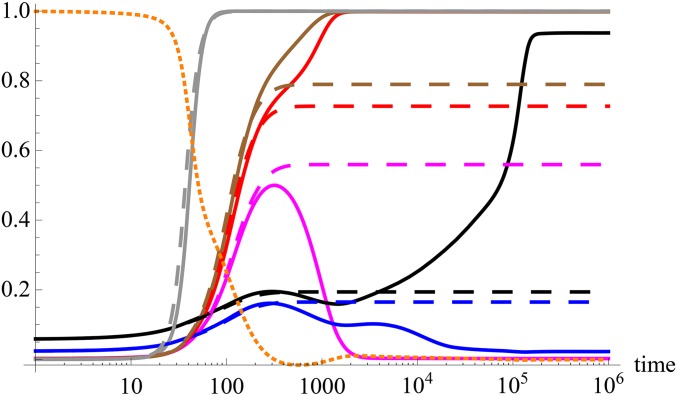
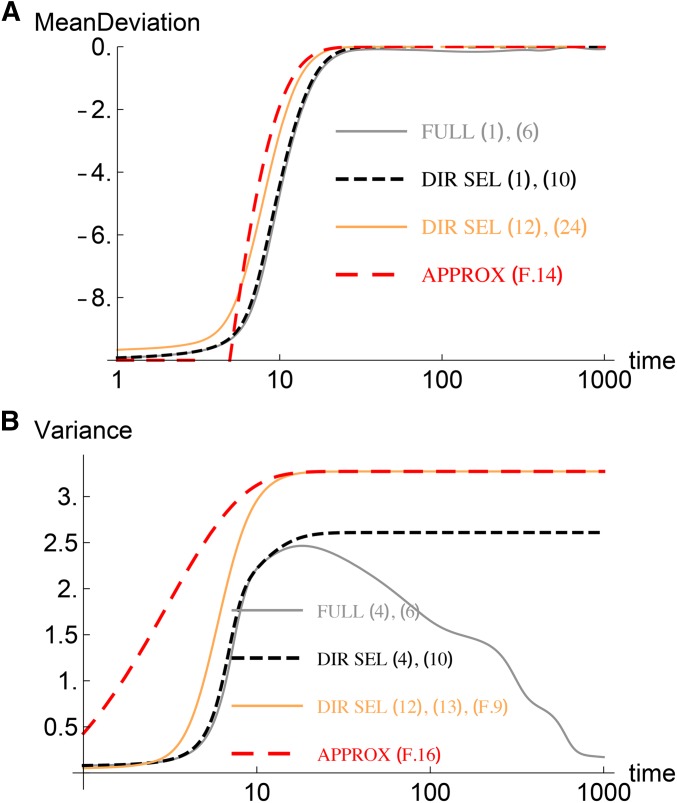
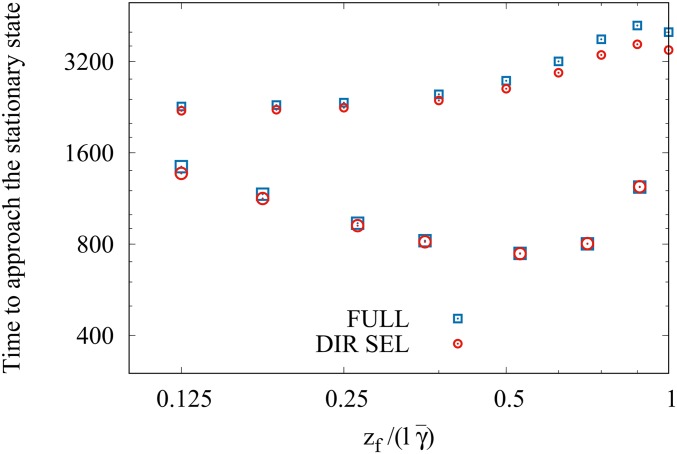
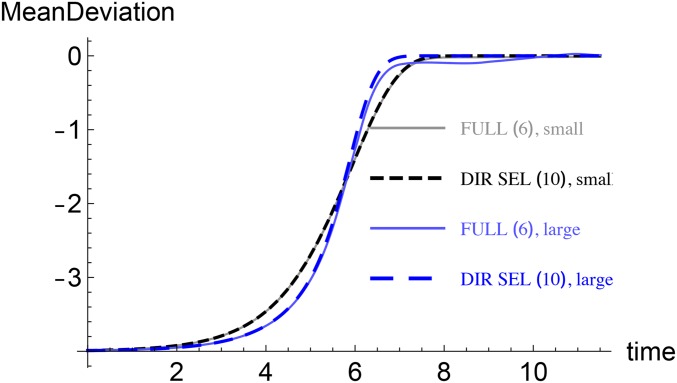
Although a number of studies have shown that natural and laboratory populations initially well adapted to their environment can evolve rapidly when conditions suddenly change, the dynamics of rapid adaptation are not well understood. Here a population genetic model of polygenic selection is analyzed to describe the short-term response of a quantitative trait after a sudden shift of the phenotypic optimum. We provide explicit analytical expressions for the timescales over which the trait mean approaches the new optimum. We find that when the effect sizes are small relative to a scaled mutation rate, small to moderate allele frequency changes occur in the short-term phase in a synergistic fashion. In contrast, selective sweeps, i.e., dramatic changes in the allele frequency, may occur provided the size of the effect is sufficiently large. Applications of our theoretical results to the relationship between QTL and selective sweep mapping and to tests of fast polygenic adaptation are discussed.

Keywords: polygenic selection; rapid adaptation; unequal effects.


Figures

Figure 1
Figure 1
Most effects are small: Dynamics of the (A) mean deviation and (B) variance (relative to its initial value) for γ^3.2γ¯=0.128 and zf=γ¯/4=2. The other parameters are s=5×10³,μ=105, and γ¯=0.04. The inset in (A) shows the mean deviation in the full model at large times. The gray and black curves are obtained for a single realization of effects in which 197 out of =200 loci have effects smaller than the mean. The orange and red curves, on the other hand, are averaged over the distribution of effects. The results from the two procedures match when the number of loci is very large as explained in Discussion.
Figure 2
Figure 2
Most effects are small: Dynamics of the allele frequency for locus with effect γi=0.121 (main) and γi=0.024 (inset). All the parameters are the same as in Figure 1. Note that while the initial allele frequency in the inset is closely approximated by (8), the allele trajectory starts at a value much lower than one half in the main panel as the effect size is close to γ^0.126. In the latter case, the corrections to (8) are substantial and given by (B2) of de Vladar and Barton (2014).
Figure 3
Figure 3
Selective sweeps when most effects are large: Dynamics of the scaled absolute mean deviation |Δc1(t)|/zf (dotted, orange) and allele frequency (solid and dashed curves) for some loci that satisfy the necessary condition γi<2Δc1(0), where Δc1(0)=2.99 and zf=3. The numerical solution of the full model (6) (solid) and directional selection model (10) (dashed) are shown for the effect size γi=1,,6=0.776 (gray), 0.340 (brown), 0.319 (red), 0.272 (magenta), 0.092 (blue), and 0.060 (black). The other parameters are s=0.1,μ=104,γ¯=0.2, and =20. Except for the locus with effect γ4, the allele frequency for the directional selection model exceeds one half at loci whose allele frequency for the full model sweeps. The allele frequency for the locus with effect γ6 also increases nearly to fixation, but at very long times where the directional selection model is not valid. Because this frequency increase is relatively slow, a genomic signature similar to a selective sweep cannot be expected.
Figure 4
Figure 4
Most effects are large: Dynamics of the (A) mean deviation and (B) variance for γ^0.028,γ¯=10γ^, and zf=100.18γ¯. For the realization of effects used in this figure, 183 out of =200 loci have effects larger than the mean. The other parameters are s=0.1 and μ=105.
Figure 5
Figure 5
Small vs. large effects when the number of loci is the same: Time at which the mean reaches 0.9 of the exact stationary state mean c1* for various values of zf when most effects are small (small symbols) and large (large symbols). For the former (latter) case, the rest of the parameters are the same as in Figure 1 (Figure 4). To show the data in the two cases on the same scale, the time for the large-effect case has been multiplied by 70.
Figure 6
Figure 6
Many loci with small effects vs. few loci with large effects: Mean deviation as a function of time when most effects are small (γ¯=0.04,=400) and large (γ¯=0.32,=50). In both cases, γ^0.126 (s=5×10³,μ=105) and the new phenotypic optimum is shifted to zf=γ¯/4=4.

References

    1. Abramowitz M., Stegun I. A. (Editors), 1964. Handbook of Mathematical Functions with Formulas, Graphs, and Mathematical Tables. Dover, New York.
    1. Arfken G., 1985. Mathematical Methods for Physicists. Academic Press, New York.
    1. Axelsson E., Ratnakumar A., Arendt M. L., Maqbool K., Webster M. T., et al. , 2013. The genomic signature of dog domestication reveals adaptation to a starch-rich diet. Nature 495: 360–364. - PubMed
    1. Barton N. H., 1986. The maintenance of polygenic variation through a balance between mutation and stabilizing selection. Genet. Res. 47: 209–216. - PubMed
    1. Barton N. H., de Vladar H. P., 2009. Statistical mechanics and the evolution of polygenic quantitative traits. Genetics 181: 997–1011. - PMC - PubMed

Publication types

LinkOut - more resources