. 2017 May;206(1):439-449.
doi: 10.1534/genetics.116.192708. Epub 2017 Mar 24.

Accuracy of Demographic Inferences from the Site Frequency Spectrum: The Case of the Yoruba Population

Affiliations

Accuracy of Demographic Inferences from the Site Frequency Spectrum: The Case of the Yoruba Population

Marguerite Lapierre et al. Genetics. 2017 May.

Abstract

Some methods for demographic inference based on the observed genetic diversity of current populations rely on the use of summary statistics such as the Site Frequency Spectrum (SFS). Demographic models can be either model-constrained with numerous parameters, such as growth rates, timing of demographic events, and migration rates, or model-flexible, with an unbounded collection of piecewise constant sizes. It is still debated whether demographic histories can be accurately inferred based on the SFS. Here, we illustrate this theoretical issue on an example of demographic inference for an African population. The SFS of the Yoruba population (data from the 1000 Genomes Project) is fit to a simple model of population growth described with a single parameter (e.g., founding time). We infer a time to the most recent common ancestor of 1.7 million years (MY) for this population. However, we show that the Yoruba SFS is not informative enough to discriminate between several different models of growth. We also show that for such simple demographies, the fit of one-parameter models outperforms the stairway plot, a recently developed model-flexible method. The use of this method on simulated data suggests that it is biased by the noise intrinsically present in the data.

Keywords: coalescent theory; human demography; model identifiability; site frequency spectrum.


Figures

Figure 1
Figure 1
The five demographic models. Each model has one single time parameter τ.
Figure 2
Figure 2
Stairway plot inference of the Yoruba demography. The inferred effective size Ne of the Yoruba population is plotted from present time (0) to the past. The inset is a zoom between 0 and 160,000 years. The thick brown line is the median Ne, the light brown area is the [2.5,97.5] percentiles interval. The inference is based on 200 bootstrap samples of the unfolded Yoruba SFS. The singletons are not taken into account for the optimization of the stairway plot.
Figure 3
Figure 3
Inference of the Yoruba demography with one-parameter models. (A) Weighted square distance d2(η,ηobs) between the normalized Yoruba SFS ηobs and the normalized predicted SFS η under each of the five models, depending on the value of the parameter τ (Purple: Sudden, Blue: Conditioned, Red: Birth-Death, Yellow: Exponential, and Green: Linear). (B) Predicted SFS under each of the five models, with the optimized value τ^ of the parameter, and under the demography inferred by the stairway plot (brown dotted line). The Yoruba SFS is shown as empty circles. The first dot, colored in black, accounting for the singletons, was not taken into account for the optimization of τ to avoid potential bias due to sequencing errors. The gray dashed line is the expected SFS under the standard neutral model without demography. Colors match the plot beside (the predicted SFS under the models Birth-Death and Conditioned are indistinguishable). The SFS are folded, transformed, and normalized (see Materials and Methods).
Figure 4
Figure 4
Demographic histories and reconstructed tree estimated from the Yoruba SFS. The tree shown has internode durations tk, during which there are k lineages consistent with the SFS (the topology was chosen uniformly among ranked binary trees with 2n tips). Time is given in coalescent units, and scaled in number of generations and in millions of years. The demographic histories (solid lines: explicit models, dashed lines: implicit models) are plotted with their optimized τ^ values. See File S1 for details on the demographic histories plotted for the models with implicit demographies (Birth-Death and Conditioned).
Figure 5
Figure 5
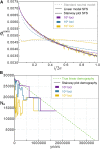
Stairway plot inference of a linear demography SFS with noise. (A) Solid lines: mean of 200 SFS simulated independently under the Linear growth model, with either 105 loci (purple), 104 loci (blue), or 103 loci (yellow). Dotted lines: expected SFS under the demography reconstructed by the stairway plot method for different number of loci (same colors than solid lines). The gray dashed line is the expected SFS under the standard neutral model without demography. The SFS are transformed and normalized (see Materials and Methods). (B) Stairway plot demographic inference: median of 200 independent demographies inferred with 200 independently simulated SFS for each number of loci (colors match the plot above). The true demography is the green dashed line. The inferred effective size Ne is plotted from present time (0) to the past.

References

    1. Achaz G., 2008. Testing for neutrality in samples with sequencing errors. Genetics 179: 1409–1424. - PMC - PubMed
    1. Achaz G., 2009. Frequency spectrum neutrality tests: one for all and all for one. Genetics 183: 249–258. - PMC - PubMed
    1. Adams A. M., Hudson R. R., 2004. Maximum-likelihood estimation of demographic parameters using the frequency spectrum of unlinked single-nucleotide polymorphisms. Genetics 168: 1699–1712. - PMC - PubMed
    1. Atkinson Q. D., Gray R. D., Drummond A. J., 2008. mtDNA variation predicts population size in humans and reveals a major Southern Asian chapter in human prehistory. Mol. Biol. Evol. 25(2): 468–474. - PubMed
    1. Bhaskar A., Song Y. S., 2014. Descartes’ rule of signs and the identifiability of population demographic models from genomic variation data. Ann. Stat. 42(6): 2469–2493. - PMC - PubMed

LinkOut - more resources