NRAS destines tumor cells to the lungs
- PMID: 28341702
- PMCID: PMC5697015
- DOI: 10.15252/emmm.201606978
NRAS destines tumor cells to the lungs
Abstract
The lungs are frequently affected by cancer metastasis. Although NRAS mutations have been associated with metastatic potential, their exact role in lung homing is incompletely understood. We cross-examined the genotype of various tumor cells with their ability for automatic pulmonary dissemination, modulated NRAS expression using RNA interference and NRAS overexpression, identified NRAS signaling partners by microarray, and validated them using Cxcr1- and Cxcr2-deficient mice. Mouse models of spontaneous lung metastasis revealed that mutant or overexpressed NRAS promotes lung colonization by regulating interleukin-8-related chemokine expression, thereby initiating interactions between tumor cells, the pulmonary vasculature, and myeloid cells. Our results support a model where NRAS-mutant, chemokine-expressing circulating tumor cells target the CXCR1-expressing lung vasculature and recruit CXCR2-expressing myeloid cells to initiate metastasis. We further describe a clinically relevant approach to prevent NRAS-driven pulmonary metastasis by inhibiting chemokine signaling. In conclusion, NRAS promotes the colonization of the lungs by various tumor types in mouse models. IL-8-related chemokines, NRAS signaling partners in this process, may constitute an important therapeutic target against pulmonary involvement by cancers of other organs.
Keywords: inflammation and cancer; interleukin‐8‐related chemokines; lung endothelium; myeloid cells; pulmonary metastasis.
© 2017 The Authors. Published under the terms of the CC BY 4.0 license.
Figures
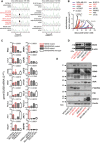
- A
Representative Sanger sequencing traces of Nras codons 60–63 of some mouse cancer cell lines employed in these studies showing Nras mutations (red font, black arrows). Shown is one representative of three traces.
- B
Weekly monitored primary tumor volume of C57BL/6, BALB/c, and NOD/SCID host mice after s.c. delivery of 0.5 × 10⁶ mouse or 106 human tumor cells (n for each group is given in Fig 1E, table).
- C–E
mRNA and protein of mouse and human tumor cell lines harboring wild‐type (WT) and mutant NRAS and KRAS alleles were examined by qPCR (C, n = 3) and immunoblotting (D, E; shown are one representative of three experiments).

- A
Mutation summary of eight cancer genes sequenced in seven mouse cancer cell lines (top) combined with human cell line mutation data (bottom). Red font indicates three cell lines identified carrying mutant NRAS.
- B–E
Eleven different mouse and human tumor cell lines with known KRAS, NRAS, HRAS, EGFR, BRAF, PIK3CA, TRP53, and STK11 mutation status were injected s.c. in appropriate host mice (0.5 × 10⁶ mouse and 106 human cells; n of cell lines is given in D and of mice in E). Primary tumor volume was monitored weekly and the animals were killed for macroscopic and microscopic lung examination when terminally ill. Shown are representative images of intravascular tumor emboli, micrometastases (red arrows) and macrometastases (black arrows) (B), representative lung stereoscopic images (C), summary of spontaneous lung metastatic behavior (D), and number (graph) and incidence (table) of macrometastases (E). Note visible B16F10 micrometastases expressing melanin (B).

- A, B
Bioluminescent images and data summaries of C57BL/6 mice with s.c. tumor cells expressing pCAG.Luc (A; n = 3/group) and of irradiated C57BL/6 chimeras reconstituted with CAG.Luc.eGFP bone marrow (B; n = 5) at 4 weeks after s.c. delivery of 106 tumor cells. Arrows indicate primary tumors; primary tumors of experiment (A) were excised at 2 weeks post‐injection. Dashed lines denote the thorax.
- C
Lung sections of irradiated C57BL/6 mice, reconstituted with mT+ bone marrow and injected s.c. with 106 tumor cells overexpressing peGFP (n = 5/group) at 2 weeks post‐tumor cells. Note the association of metastatic GFP+ tumor cells (green arrows) with mT+ bone marrow cells (red arrows) in niches (dashed outlines). Note also that mT+ myeloid cells in LLC‐ and AE17‐colonized lungs were mononuclear and polymorphonuclear, while they were mononuclear in the lungs of mice with MC38 tumors. b, bronchus; a, alveolus.
- D
Blood, spleen, and lung CD11b+Ly6c+ cells and splenic dimensions of C57BL/6 mice (n = 4/group) which received s.c. saline (naïve) or tumor cells. Similar results were obtained using CD11b+Gr1+ and CD11b+Ly6g+ (not shown).
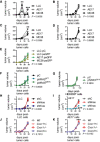
- A
Primary tumor volume of experiment from Fig 2A (n = 3 mice/cell line).
- B
Primary tumor volume of experiment from Fig 2B (n = 5 mice/cell line).
- C
Primary tumor volume of experiment from Fig 2C (n = 5 mice/cell line).
- D
Primary tumor volume of experiment from Fig 2D (n = 4 mice/cell line).
- E
Primary tumor volume of experiment from Fig 3A (n = 4 mice/cell line).
- F
Primary tumor volume of experiment from Fig 3D (n = 8 mice/cell line).
- G
Primary tumor volume of experiment from Fig 3E (n = 7–8/cell line).
- H, I
Primary tumor volume of experiments from Fig 4C (n is given in Fig 4C, tables).
- J, K
Primary tumor volume of experiments from Fig 7A (n is given in Fig 7A, tables).
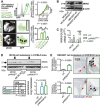
- A
Serial circulating and lung‐homed tumor cells at 4 weeks after s.c. injection of 106 peGFP‐expressing tumor cells (n = 4/group). Histogram: flow cytometry of tumor cells. Images: representative lung photographs and biofluorescence at 445‐ to 490‐nm excitation and 515‐ to 575‐nm emission.
- B, C
NRAS mRNA and protein of MC38 and HEK293T cells expressing control (pC), wild‐type NRAS (pNRAS WT), and NRAS Q61K (pNRAS Q61K) plasmids by qPCR (n = 3; shown are NRAS relative to Gusb or GUSB levels) and immunoblotting (shown is one representative of three experiments).
- D
NRAS and β‐actin immunoblots, incidence table, and multiplicity (graph) of lung metastases of C57BL/6 mice at 4 weeks after s.c. delivery of 106 MC38 cells expressing pC, pNRAS WT, and pNRAS Q61K plasmids (n is given in table; arrows indicate the clones used for experiments).
- E
Lung fraction occupied by metastases (graphs), and exemplary images of proliferating cell nuclear antigen (PCNA)‐stained lung sections of NOD/SCID mice at 11 weeks after s.c. (n = 7–8/group) and i.v. (n = 5/group) delivery of 3 × 10⁶ HEK293T cells expressing pC and pNRAS Q61K.
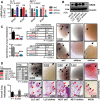
- A, B
NRAS mRNA (A) and protein (B) expression of Nras Q61H‐mutant mouse tumor cells (LLC and AE17) stably expressing control (shC), anti‐Nras (shNras)‐, and anti‐Kras (shKras)‐specific shRNAs by qPCR (n = 3; shown are Nras or Kras relative to Hprt levels as percentage of control) and immunoblotting (shown is one representative of three experiments).
- C
Incidence (tables), multiplicity (graphs), and exemplary images of automatic lung metastases (arrows) of C57BL/6 mice at 4 weeks after s.c. delivery of 106 shC‐, shNras‐, and shKras‐expressing LLC and AE17 cells (n is given in tables).
- D
Incidence (table), multiplicity (graph), and exemplary images of forced lung metastases of C57BL/6 mice at 2 weeks after i.v. delivery of 0.25 × 10⁶ shC‐ and shNras‐expressing LLC and AE17 cells, as well as MC38 cells (n is given in table).
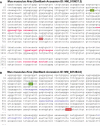

Hierarchical clustering using paired ANOVA cutoff probability value of P < 0.001 identifies 45 differentially expressed genes and clusters cells by silenced gene and not by cell line.
Volcano plots of changes in gene expression by cell line showing the top altered genes. Transcripts downregulated by shNras are shown in red font and transcripts upregulated in green font. The distance from diagonal lines represent probability value.
- A, B
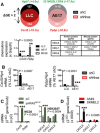
Microarray (A) and qPCR (B) comparing differential gene expression (ΔGE) of Nras Q61H‐mutant mouse tumor cells (LLC and AE17) expressing control (shC) or anti‐Nras (shNras) shRNAs (n = 3). Table lists homologues of mouse and human CXCR1/2 ligand transcripts (Zlotnik & Yoshie, 2012).
- C
CXCR1/2 ligand mRNA of MC38 and HEK293T cells stably expressing control (pC) and NRAS Q61K (pNRAS Q61K) plasmids by qPCR (n = 3) shows induction of Cxcl5 in MC38 cells and of CXCL6 in HEK293T cells.
- D
CXCR1/2 ligand expression of A549 cells (NRAS wild type) and SKMEL2 cells (NRAS Q61R) by qPCR (n = 3) shows CXCL6 overexpression by SKMEL2 cells.
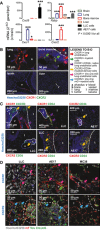
Cxcr1, Cxcr2, Cxcl5, and Ppbp mRNA expression in metastatic target organs and Nras Q61H‐mutant tumor cells (LLC and AE17) of C57BL/6 mice by qPCR (n = 3).
Immunostaining of tumor‐free mouse organs for CXCR1 and CXCR2. Lung, bone marrow, brain and hepatic vessels, but not lung alveoli, expressed CXCR1, whereas CXCR2 was expressed by bone marrow cells. Dotted lines indicate interface between bone and bone marrow lacuna.
Immune co‐labeling of mouse lungs with spontaneous metastases from s.c. Nras Q61H‐mutant tumor cells (LLC, AE17) for CXCR1, CXCR2, and the endothelial marker CD34 identified both native lung CXCR1+CD34+ bone marrow‐derived CXCR2+CD34+ endothelial cells, with the latter incorporating into metastasis‐adjacent vessels and infiltrating lung tumors.
Immunofluorescent staining for CXCR1 and CXCR2 of lungs from Vav.Cre;mT/mG mice pulsed s.c. with LLC, AE17, and MC38 tumor cells revealed CXCR1 expression in mT+ cells and CXCR2 expression in GFP+ cells.
- A, B
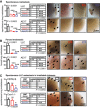
Incidence (tables), multiplicity (graphs), and exemplary images of lung metastases (arrows) of LLC and AE17 cells in C57BL/6, single‐ and dual‐copy Cxcr1‐gene‐deficient (Cxcr1 +/− and Cxcr1 −/−, respectively), and single‐copy Cxcr2‐gene‐deficient (Cxcr2 +/−) mice at 4 weeks after s.c. delivery of 106 cells (A) and at 2 weeks after i.v. delivery of 0.25 × 10⁶ cells (B). n is given in tables.
- C
Incidence (tables), multiplicity (bar graphs), and exemplary images of automatic lung metastases (arrows) of irradiated C57BL/6 and Cxcr1 −/− chimeras reconstituted with bone marrow from C57BL/6, Cxcr1 −/−, or Cxcr2 +/− donors at 4 weeks after s.c. delivery of 106 LLC cells.

Incidence (tables), multiplicity (graphs), and exemplary images of lung metastases (arrows) of C57BL/6 mice at 2 weeks after i.v. delivery of 0.25 × 10⁶ LLC or AE17 cells preceded by 5 h and followed by 7 days by oral gavage with 200 μl saline or the CXCR1/2 antagonist navarixin (300 μg in 200 μl saline). Data are presented as mean ± SEM. P: probability by Fisher's exact (tables) or Student's t‐test (graphs). n is given in tables.
Number of patients with lung metastases (n = 1,015) identified at necropsy among 3,817 patients with 26 different bodily tumor types (from Disibio & French, 2008) plotted versus the number of patients expected to harbor NRAS gain of function (n = 216; calculated from COSMIC; Forbes et al, 2015). Shown are weighted data points (bubble size indicates total number of patients with each tumor type); Spearman's correlation coefficient (ρ) and probability value (P); and linear regression line with formula, Pearson's coefficient (R), and probability value (P).
Mutant NRAS functions in lung metastasis. NRAS‐mutant circulating tumor cells express CXCR1 ligands and attach to the CXCR1+ pulmonary endothelium (4). Lung‐homed NRAS‐mutant tumor cells systemically shed CXCR1 ligands to recruit CXCR2+ myeloid cells to form pulmonary niches (5) and to foster metastasis (6). Wild‐type NRAS tumor cells do not express CXCR1 ligands and fail to attach, to recruit myeloid cells, and establish lung metastases (1–3).
Comment in
-
Radiation Biology and Circulating Tumor Cells.Int J Radiat Oncol Biol Phys. 2018 Mar 15;100(4):813-815. doi: 10.1016/j.ijrobp.2017.09.045. Int J Radiat Oncol Biol Phys. 2018. PMID: 29485052 No abstract available.
References
-
- Abdel‐Ghany M, Cheng HC, Elble RC, Pauli BU (2001) The breast cancer beta 4 integrin and endothelial human CLCA2 mediate lung metastasis. J Biol Chem 276: 25438–25446 - PubMed
-
- Blunt T, Finnie NJ, Taccioli GE, Smith GC, Demengeot J, Gottlieb TM, Mizuta R, Varghese AJ, Alt FW, Jeggo PA et al (1995) Defective DNA‐dependent protein kinase activity is linked to V(D)J recombination and DNA repair defects associated with the murine scid mutation. Cell 80: 813–823 - PubMed
-
- Borovski T, De Sousa EMF, Vermeulen L, Medema JP (2011) Cancer stem cell niche: the place to be. Cancer Res 71: 634–639 - PubMed
MeSH terms
Substances
Grants and funding
LinkOut - more resources
Full Text Sources
Other Literature Sources
Medical
Molecular Biology Databases
Research Materials
Miscellaneous

