pH regulation in early endosomes and interferon-inducible transmembrane proteins control avian retrovirus fusion
- PMID: 28341742
- PMCID: PMC5427263
- DOI: 10.1074/jbc.M117.783878
pH regulation in early endosomes and interferon-inducible transmembrane proteins control avian retrovirus fusion
Abstract
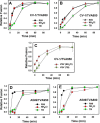
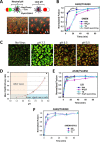
Enveloped viruses infect host cells by fusing their membranes with those of the host cell, a process mediated by viral glycoproteins upon binding to cognate host receptors or entering into acidic intracellular compartments. Whereas the effect of receptor density on viral infection has been well studied, the role of cell type-specific factors/processes, such as pH regulation, has not been characterized in sufficient detail. Here, we examined the effects of cell-extrinsic factors (buffer environment) and cell-intrinsic factors (interferon-inducible transmembrane proteins, IFITMs), on the pH regulation in early endosomes and on the efficiency of acid-dependent fusion of the avian sarcoma and leukosis virus (ASLV), with endosomes. First, we found that a modest elevation of external pH can raise the pH in early endosomes in a cell type-dependent manner and thereby delay the acid-induced fusion of endocytosed ASLV. Second, we observed a cell type-dependent delay between the low pH-dependent and temperature-dependent steps of viral fusion, consistent with the delayed enlargement of the fusion pore. Third, ectopic expression of IFITMs, known to potently block influenza virus fusion with late compartments, was found to only partially inhibit ASLV fusion with early endosomes. Interestingly, IFITM expression promoted virus uptake and the acidification of endosomal compartments, resulting in an accelerated fusion rate when driven by the glycosylphosphatidylinositol-anchored, but not by the transmembrane isoform of the ASLV receptor. Collectively, these results highlight the role of cell-extrinsic and cell-intrinsic factors in regulating the efficiency and kinetics of virus entry and fusion with target cells.
Keywords: endocytosis; fusion protein; pH regulation; viral protein; virus entry.
© 2017 by The American Society for Biochemistry and Molecular Biology, Inc.
Conflict of interest statement
The authors declare that they have no conflicts of interest with the contents of this article
Figures


Similar articles
-
Imaging single retrovirus entry through alternative receptor isoforms and intermediates of virus-endosome fusion.PLoS Pathog. 2011 Jan 20;7(1):e1001260. doi: 10.1371/journal.ppat.1001260. PLoS Pathog. 2011. PMID: 21283788 Free PMC article.
-
Synchronized retrovirus fusion in cells expressing alternative receptor isoforms releases the viral core into distinct sub-cellular compartments.PLoS Pathog. 2012;8(5):e1002694. doi: 10.1371/journal.ppat.1002694. Epub 2012 May 10. PLoS Pathog. 2012. PMID: 22589725 Free PMC article.
-
pH Optimum of Hemagglutinin-Mediated Membrane Fusion Determines Sensitivity of Influenza A Viruses to the Interferon-Induced Antiviral State and IFITMs.J Virol. 2017 May 12;91(11):e00246-17. doi: 10.1128/JVI.00246-17. Print 2017 Jun 1. J Virol. 2017. PMID: 28356532 Free PMC article.
-
Alpharetrovirus envelope-receptor interactions.Curr Top Microbiol Immunol. 2003;281:107-36. doi: 10.1007/978-3-642-19012-4_3. Curr Top Microbiol Immunol. 2003. PMID: 12932076 Review.
-
Cellular entry of retroviruses.Adv Exp Med Biol. 2013;790:128-49. doi: 10.1007/978-1-4614-7651-1_7. Adv Exp Med Biol. 2013. PMID: 23884589 Review.
Cited by
-
Golgi pH, Ion and Redox Homeostasis: How Much Do They Really Matter?Front Cell Dev Biol. 2019 Jun 11;7:93. doi: 10.3389/fcell.2019.00093. eCollection 2019. Front Cell Dev Biol. 2019. PMID: 31263697 Free PMC article.
-
Exploring the Subcellular Localization and Degradation of Spherical Nucleic Acids Using Fluorescence Lifetime Imaging Microscopy.ACS Nano. 2025 Jun 24;19(24):21983-21996. doi: 10.1021/acsnano.5c00177. Epub 2025 Jun 9. ACS Nano. 2025. PMID: 40489247 Free PMC article.
-
Functional Mapping of Regions Involved in the Negative Imprinting of Virion Particle Infectivity and in Target Cell Protection by Interferon-Induced Transmembrane Protein 3 against HIV-1.J Virol. 2019 Jan 4;93(2):e01716-18. doi: 10.1128/JVI.01716-18. Print 2019 Jan 15. J Virol. 2019. PMID: 30355696 Free PMC article.
-
Lessons in self-defence: inhibition of virus entry by intrinsic immunity.Nat Rev Immunol. 2022 Jun;22(6):339-352. doi: 10.1038/s41577-021-00626-8. Epub 2021 Oct 13. Nat Rev Immunol. 2022. PMID: 34646033 Free PMC article. Review.
-
IFITM3 directly engages and shuttles incoming virus particles to lysosomes.Nat Chem Biol. 2019 Mar;15(3):259-268. doi: 10.1038/s41589-018-0213-2. Epub 2019 Jan 14. Nat Chem Biol. 2019. PMID: 30643282 Free PMC article.
References
-
- Banerjee I., Miyake Y., Nobs S. P., Schneider C., Horvath P., Kopf M., Matthias P., Helenius A., and Yamauchi Y. (2014) Influenza A virus uses the aggresome processing machinery for host cell entry. Science 346, 473–477 - PubMed
-
- Karlas A., Machuy N., Shin Y., Pleissner K. P., Artarini A., Heuer D., Becker D., Khalil H., Ogilvie L. A., Hess S., Mäurer A. P., Müller E., Wolff T., Rudel T., and Meyer T. F. (2010) Genome-wide RNAi screen identifies human host factors crucial for influenza virus replication. Nature 463, 818–822 - PubMed
Publication types
MeSH terms
Substances
Grants and funding
LinkOut - more resources
Full Text Sources
Other Literature Sources

