

Elevated Serum Levels of sCD30 and IL6 and Detectable IL10 Precede Classical Hodgkin Lymphoma Diagnosis
- PMID: 28341757
- PMCID: PMC5511544
- DOI: 10.1158/1055-9965.EPI-16-1012
Elevated Serum Levels of sCD30 and IL6 and Detectable IL10 Precede Classical Hodgkin Lymphoma Diagnosis
Abstract
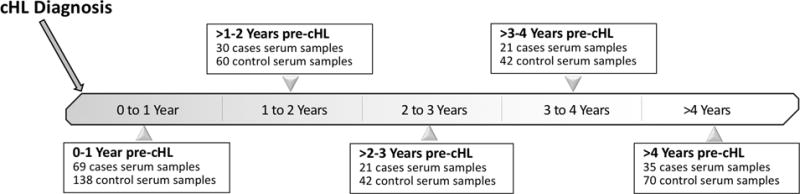
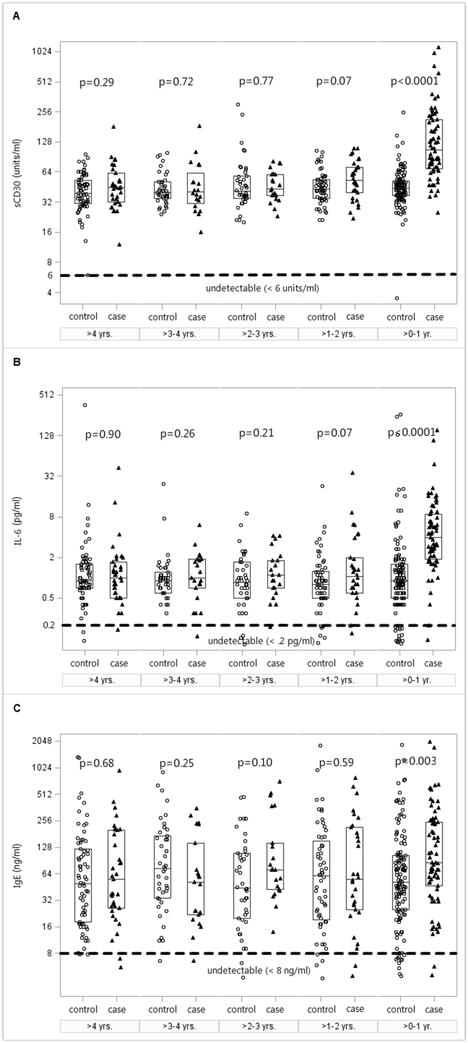
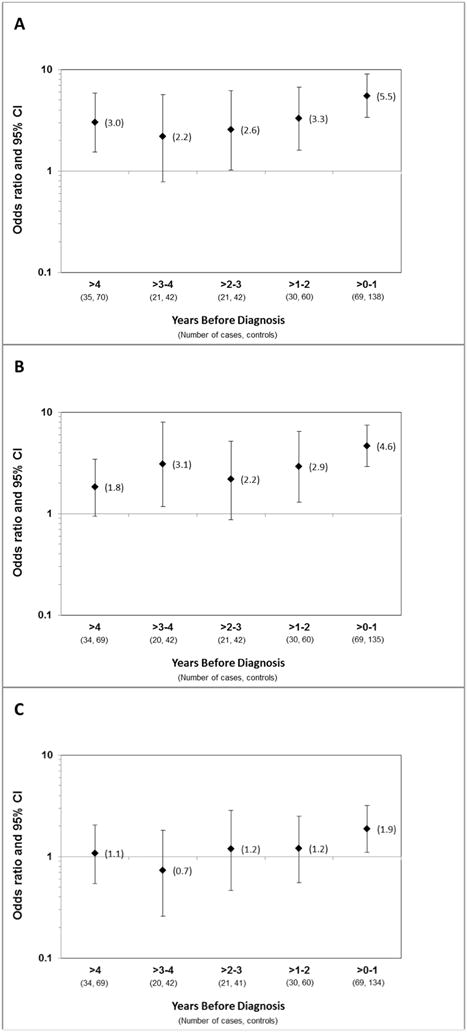
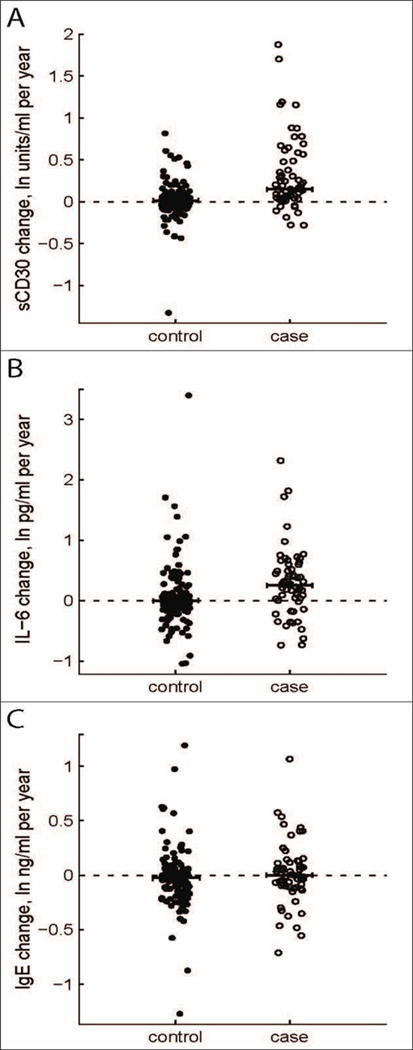
Background: We investigated whether an immune system environment characterized by elevated serum levels of B-cell activation molecules was associated with the subsequent development of classical Hodgkin lymphoma (cHL).Methods: We measured serum levels of B-cell-stimulatory cytokines, IL6 and IL10, soluble CD30 (sCD30), and total IgE prior to cHL diagnosis in 103 cases and 206 matched controls with archived specimens in the DoD Serum Repository.Results: Prediagnosis serum sCD30 and IL6 levels had strong positive associations with risk of a cHL diagnosis 0 to 1 year prior to diagnosis [sCD30 OR = 5.5; 95% confidence interval (CI), 3.4-9.0; IL6 OR = 4.6; 95% CI, 2.9-7.5] and >1 year to 2 years pre-cHL diagnosis (sCD30 OR = 3.3; 95% CI, 1.6-6.7; IL6 OR = 2.9; 95% CI, 1.3-6.5). We observed similar, albeit not consistently significant positive associations, over 4 or more years preceding diagnosis. We did not observe a clear association with IgE levels. Of note, detectable IL10 levels were significantly associated with Epstein-Barr virus (EBV)-positive cHL cases compared with EBV-negative cases.Conclusion: In this prospective analysis, elevated sCD30 and IL6 levels and detectable IL10 preceded cHL diagnosis.Impact: The associations of these cytokines with cHL risk may reflect the production of these molecules by proliferating nascent cHL tumor cells, or by immune cells responding to their presence, prior to clinical detection. The stable elevation in cHL risk, 4 or more years prediagnosis, also suggests that a B-cell-stimulatory immune system milieu precedes, and may promote, lymphomagenesis. Cancer Epidemiol Biomarkers Prev; 26(7); 1114-23. ©2017 AACR.
©2017 American Association for Cancer Research.
Figures
Similar articles
-
Precursor cells and implications of a T-cell inflamed immune response in the pre-malignant setting in Hodgkin lymphoma.Immunobiology. 2020 Jan;225(1):151872. doi: 10.1016/j.imbio.2019.11.007. Epub 2019 Nov 25. Immunobiology. 2020. PMID: 31787352
-
Atypical prediagnosis Epstein-Barr virus serology restricted to EBV-positive Hodgkin lymphoma.Blood. 2012 Nov 1;120(18):3750-5. doi: 10.1182/blood-2011-12-390823. Epub 2012 Sep 12. Blood. 2012. PMID: 22972983 Free PMC article.
-
Classical Hodgkin Lymphoma with Positive Epstein-Barr Virus Status is Associated with More FOXP3 Regulatory T Cells.Med Sci Monit. 2016 Jul 5;22:2340-6. doi: 10.12659/msm.896629. Med Sci Monit. 2016. PMID: 27377121 Free PMC article.
-
The impact of EBV and HIV infection on the microenvironmental niche underlying Hodgkin lymphoma pathogenesis.Int J Cancer. 2017 Mar 15;140(6):1233-1245. doi: 10.1002/ijc.30473. Epub 2016 Oct 27. Int J Cancer. 2017. PMID: 27750386 Review.
-
On the aetiology of Hodgkin lymphoma.Dan Med J. 2012 Jul;59(7):B4485. Dan Med J. 2012. PMID: 22759852 Review.
Cited by
-
The circuitry of the tumor microenvironment in adult and pediatric Hodgkin lymphoma: cellular composition, cytokine profile, EBV, and exosomes.Cancer Rep (Hoboken). 2021 Apr;4(2):e1311. doi: 10.1002/cnr2.1311. Epub 2020 Oct 26. Cancer Rep (Hoboken). 2021. PMID: 33103852 Free PMC article. Review.
-
Elevated serum TARC levels precede classic Hodgkin lymphoma diagnosis by several years.Blood. 2023 Nov 30;142(22):1928-1931. doi: 10.1182/blood.2023020959. Blood. 2023. PMID: 37748137 Free PMC article.
-
Increased Production of B-Cell Activating Cytokines and Altered Peripheral B-Cell Subset Distribution during HIV-Related Classical Hodgkin Lymphoma.Cancers (Basel). 2021 Dec 28;14(1):128. doi: 10.3390/cancers14010128. Cancers (Basel). 2021. PMID: 35008292 Free PMC article.
-
Revisiting IL-6 expression in the tumor microenvironment of classical Hodgkin lymphoma.Blood Adv. 2021 Mar 23;5(6):1671-1681. doi: 10.1182/bloodadvances.2020003664. Blood Adv. 2021. PMID: 33720338 Free PMC article.
-
Complications of Brentuximab Therapy in Patients with Hodgkin's Lymphoma and Concurrent Autoimmune Pathology-A Case Series.Hematol Rep. 2024 May 20;16(2):299-307. doi: 10.3390/hematolrep16020030. Hematol Rep. 2024. PMID: 38804283 Free PMC article.
References
-
- Kuppers R, Rajewsky K, Zhao M, Simons G, Laumann R, Fischer R, et al. Hodgkin disease: Hodgkin and Reed-Sternberg cells picked from histological sections show clonal immunoglobulin gene rearrangements and appear to be derived from B cells at various stages of development. Proc Natl Acad Sci USA. 1994;91:10962–6. - PMC - PubMed
-
- Janz M, Mathas S. The pathogenesis of classical Hodgkin’s lymphoma: what can we learn from analyses of genomic alterations in Hodgkin and Reed-Sternberg cells? Haematologica. 2008;93:1292–5. - PubMed
-
- Poppema S, van den Berg A. Interaction between host T cells and Reed-Sternberg cells in Hodgkin lymphomas. Semin Cancer Biol. 2000;10:345–50. - PubMed
Publication types
MeSH terms
Substances
Grants and funding
LinkOut - more resources
Full Text Sources
Other Literature Sources
Medical
