. 2017 Jun;27(6):973-984.
doi: 10.1101/gr.217521.116. Epub 2017 Mar 24.

Diurnal regulation of RNA polymerase III transcription is under the control of both the feeding-fasting response and the circadian clock

Collaborators, Affiliations

Diurnal regulation of RNA polymerase III transcription is under the control of both the feeding-fasting response and the circadian clock

François Mange et al. Genome Res. 2017 Jun.

Abstract

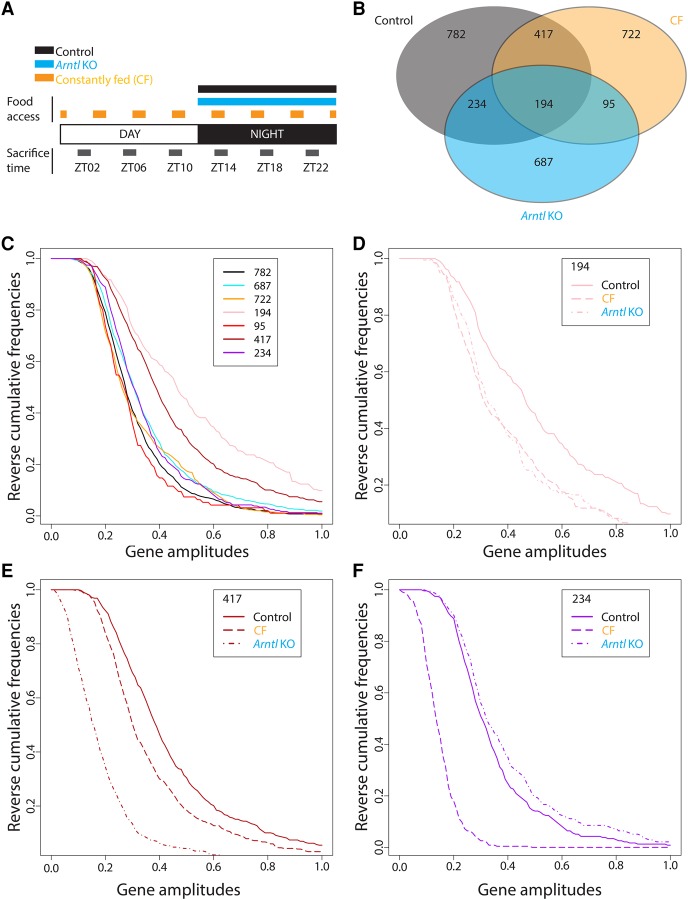
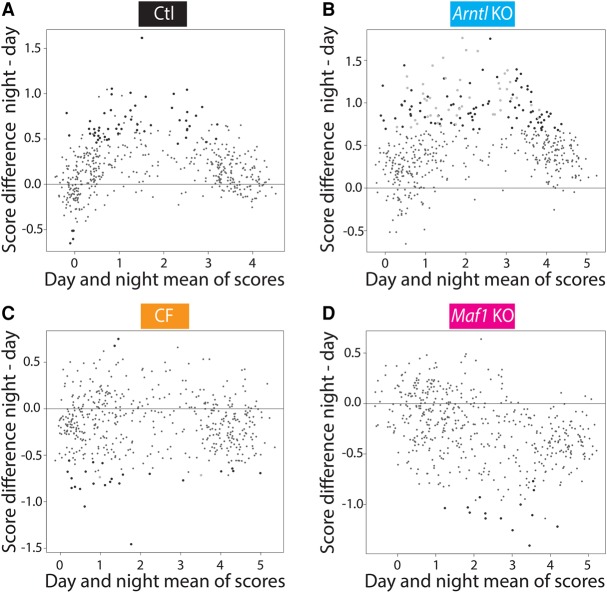
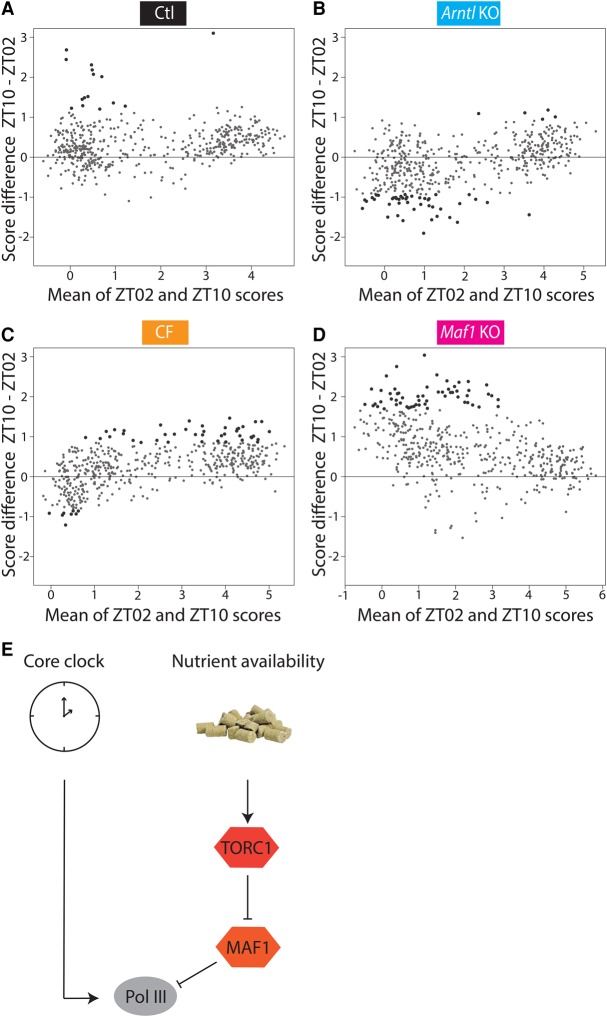
RNA polymerase III (Pol III) synthesizes short noncoding RNAs, many of which are essential for translation. Accordingly, Pol III activity is tightly regulated with cell growth and proliferation by factors such as MYC, RB1, TRP53, and MAF1. MAF1 is a repressor of Pol III transcription whose activity is controlled by phosphorylation; in particular, it is inactivated through phosphorylation by the TORC1 kinase complex, a sensor of nutrient availability. Pol III regulation is thus sensitive to environmental cues, yet a diurnal profile of Pol III transcription activity is so far lacking. Here, we first use gene expression arrays to measure mRNA accumulation during the diurnal cycle in the livers of (1) wild-type mice, (2) arrhythmic Arntl knockout mice, (3) mice fed at regular intervals during both night and day, and (4) mice lacking the Maf1 gene, and so provide a comprehensive view of the changes in cyclic mRNA accumulation occurring in these different systems. We then show that Pol III occupancy of its target genes rises before the onset of the night, stays high during the night, when mice normally ingest food and when translation is known to be increased, and decreases in daytime. Whereas higher Pol III occupancy during the night reflects a MAF1-dependent response to feeding, the rise of Pol III occupancy before the onset of the night reflects a circadian clock-dependent response. Thus, Pol III transcription during the diurnal cycle is regulated both in response to nutrients and by the circadian clock, which allows anticipatory Pol III transcription.


Figures

Figure 1.
Figure 1.
Rhythmic mRNAs in control, CF, and Arntl KO mouse liver. (A) Experimental design. Mice were fed over the course of 1 wk either only during the night (control and Arntl KO mice) or every 3 h (CF, constantly fed mice). They were then sacrificed every 4 h during two consecutive days (3–6 replicates per time point). For CF mice, the timing was established such that sacrifice always occurred 1 h after feeding. Liver RNA was extracted and used for gene expression microarray analyses. A cosine function was fitted to the data, and genes with a P-value associated with the fitting to the model lower than 0.0001 were considered as oscillating genes. (B) Venn diagram displaying the number of genes oscillating in each condition. The false discovery rates were 0.09 for WT mice, 0.08 for CF mice, and 0.09 for the Arntl KO mice (1000 permutations). (C) Reverse cumulative frequencies (RCF) of the amplitudes of the indicated group of genes (corresponding to the Venn diagram) in control mice (782, 417, 234, 194), CF (722, 95), and Arntl KO (687). RCF corresponds here to the frequency of all the values greater than a given amplitude. (D) RCF of the amplitude in the control, CF, and Arntl KO mice for the 194 genes oscillating in all the conditions. (E) As in D, but for the 417 genes oscillating in both control and CF mice. (F) As in D, but for the 234 genes oscillating in both the control and Arntl KO livers.
Figure 2.
Figure 2.
Effects of CF and Arntl KO conditions on the genes oscillating in control liver (control rhythmic data set). (A) Scatterplot showing amplitudes [(maximum − minimum gene expression)/2] in control (x-axis) and CF (y-axis) liver, for all genes in the control rhythmic data set with an amplitude higher than 0.25 in the control condition (1132 of 1627 genes, black and orange dots). The light gray dots represent genes with amplitude lower than 0.25 in control condition (495 of 1627 genes). The red line is the X = Y line, and the blue line is the best fit. The orange dots are circadian-related genes, selected according to gene ontology analysis. (B) As in A but in control (x-axis) and Arntl KO (y-axis) liver. (C) The cutoff on the amplitude was applied for each condition on the control rhythmic data set genes resulting in 1132 of 1627 oscillating genes in control mice, 504 of this same set in CF mice, and 582 of this same set in Arntl KO mice. For each time of the day (indicated as Zeitgebers), the number of genes from the control rhythmic data set with a corresponding phase (time of maximum gene expression) is represented in control, CF, and Arntl KO mice. The radius is equal to the highest number of genes among all three conditions, i.e., 86 genes with a phase between ZT22-ZT23 in the control mice. (D) PAM analysis was performed on the 1132 genes from the control rhythmic data set, and the number of clusters was determined by the best silhouette average. Genes were ranked according to the control condition and normalized by row across all conditions: (white) lowest expression; (red) highest expression. (E) Circular plot showing the phases around the periphery and the amplitudes along the radius. The arrows show the phase and the amplitude of circadian clock gene expression in control (beginning of arrows) and Arntl KO (end of arrows) liver. (F) As in E, but for circadian clock genes in control (beginning of arrows) and CF (end of arrows) liver.
Figure 3.
Figure 3.
Effects of CF and Arntl KO conditions on nutrient-response mediators. (A) Night and day blood insulin concentration in control, Arntl KO, and CF mice. Each box plot represents the distribution of blood insulin concentration at different time points during the day (ZT02, ZT06, ZT10) and the night (ZT14, ZT18, ZT22). The horizontal black line is the median, and each point is the value for a given mouse: (***) P-value <0.0005; (**) P-value <0.005. (B) Immunoblots of control mouse liver samples collected every 4 h for 2 d and probed with antibodies directed against the antigens indicated on the left: p-AKT, AKT phosphorylated on serine 473, tot AKT, total AKT; p-S6, S6 phosphorylated on serines 235/236; Tot S6, total S6. Gamma tubulin was used as loading control. (C) As in B, but with Arntl KO mice liver samples. (D) As in B, but with CF mice liver samples. (E) Quantitation of the immunoblot signal fold changes obtained for phosphorylated AKT/Total AKT (left) and phosphorylated S6/Total S6 (right). Mean immunoblot signals were calculated for control (black, 3–5 samples per time point), Arntl KO (blue, 3–5 samples per time point), and CF (orange, 4–6 samples per time point) mice, and the signal at ZT02 was set at 1. For each condition, P-values were calculated for each night time point compared with the mean of all the day time points: (***) P-value <0.0005; (**) P-value <0.005; (*) P-value <0.05.
Figure 4.
Figure 4.
Pol III gene occupancy increase in CF, Arntl KO, and Maf1 KO mice. (A) ChIP-seq was performed with an antibody directed against POLR3D (RPC4), a Pol III subunit, with pools of three liver samples from 12- to 14-wk-old mice collected every 4 h during two consecutive days. Five hundred seventy-three loci significantly occupied by Pol III in at least one sample in one of the conditions were analyzed. (B) Box plot showing, for each of the 573 loci, the mean of all scores [log2(IP/Input)] in all time points (12 samples per condition) for control, CF, Arntl KO, and Maf1 KO liver samples. The mean and median of the 573 loci are represented with a black squared dot and a black line, respectively. (C) Box plot showing the mean score of two biological replicates at each time point for the 573 loci. (D) As in C, but for the Arntl KO mice. (E) As in C, but for the CF mice. (F) As in C, but for the Maf1 KO mice.
Figure 5.
Figure 5.
Nutrient-dependent increase of Pol III gene occupancy. (A) MVA plot comparing day and night average scores. For each locus, the three day scores were averaged and the three night scores were averaged. The MVA plot shows the average of day averages and night averages on the x-axis and the difference of night average – day average scores on the y-axis. Large black dots represent genes with significantly different day average and night average scores (P-value <0.05), as calculated with limma. (B) As in A, but for Arntl KO mice. The large black dots represent genes changing with a P-value <0.05 only in the Arntl KO mice, and the large gray dots represent genes changing with a P-value <0.05 in both the control and the Arntl KO mice. (C) As in A, but for the CF mice. The large black dots represent genes changing with a P-value <0.05 only in the CF mice, and the large gray dots represent genes changing with a P-value <0.05 in both the control and CF mice. (D) As in A, but for the Maf1 KO mice. The large black dots represent genes changing with a P-value <0.05 only in the Maf1 KO.
Figure 6.
Figure 6.
The circadian clock enables nutrient-independent Pol III recruitment. (A) MVA plot showing the average of ZT02 and ZT10 scores on the x-axis and the difference of ZT10 – ZT02 scores on the y-axis. Large black dots represent genes changing between day and night with a P-value <0.05, as calculated with limma. (B) As in A, but for Arntl KO samples. (C) As in A, but for the CF samples. (D) As in A, but for the Maf1 KO samples. (E) Regulation of Pol III gene occupancy by the core clock, which activates Pol III before the night feeding period, and by the feeding response, which activates TORC1, which itself inactivates the MAF1 repressor.

References

    1. Asher G, Sassone-Corsi P. 2015. Time for food: the intimate interplay between nutrition, metabolism, and the circadian clock. Cell 161: 84–92. - PubMed
    1. Asher G, Gatfield D, Stratmann M, Reinke H, Dibner C, Kreppel F, Mostoslavsky R, Alt FW, Schibler U. 2008. SIRT1 regulates circadian clock gene expression through PER2 deacetylation. Cell 134: 317–328. - PubMed
    1. Atger F, Gobet C, Marquis J, Martin E, Wang J, Weger B, Lefebvre G, Descombes P, Naef F, Gachon F. 2015. Circadian and feeding rhythms differentially affect rhythmic mRNA transcription and translation in mouse liver. Proc Natl Acad Sci 112: E6579–E6588. - PMC - PubMed
    1. Bass J, Takahashi JS. 2010. Circadian integration of metabolism and energetics. Science 330: 1349–1354. - PMC - PubMed
    1. Bhargava P, Reese JC, Gjidoda A, Henry RW. 2013. RNA polymerase III repression by the retinoblastoma tumor suppressor protein. Biochim Biophys Acta 1829: 385–392. - PMC - PubMed

Publication types

MeSH terms