

RNA-DNA hybrid (R-loop) immunoprecipitation mapping: an analytical workflow to evaluate inherent biases
- PMID: 28341774
- PMCID: PMC5453320
- DOI: 10.1101/gr.219394.116
RNA-DNA hybrid (R-loop) immunoprecipitation mapping: an analytical workflow to evaluate inherent biases
Erratum in
-
Corrigendum: RNA-DNA hybrid (R-loop) immunoprecipitation mapping: an analytical workflow to evaluate inherent biases.Genome Res. 2019 Jan;29(1):157. doi: 10.1101/gr.246652.118. Genome Res. 2019. PMID: 30602553 Free PMC article. No abstract available.
Abstract
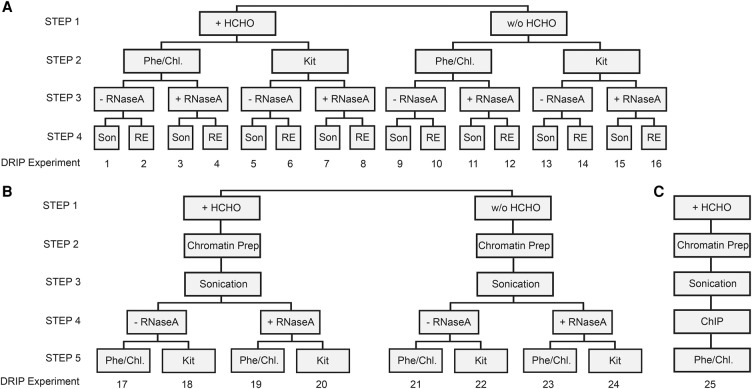
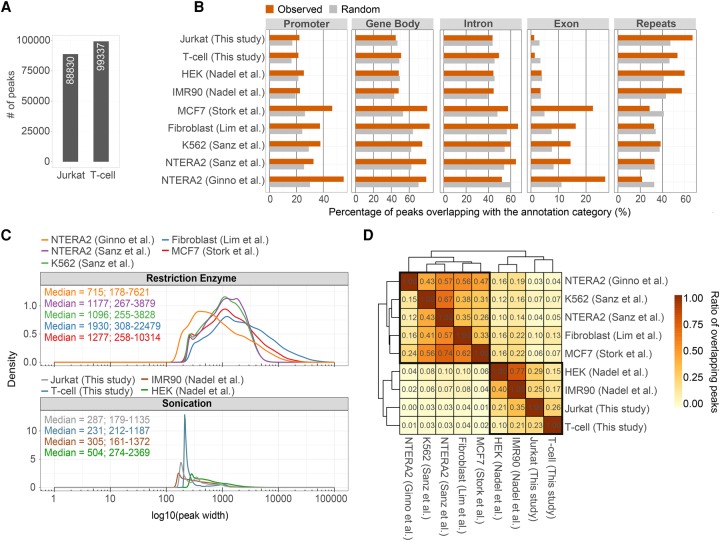
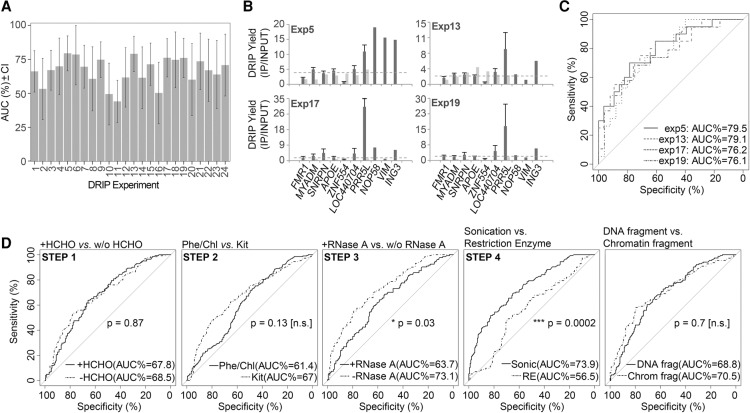
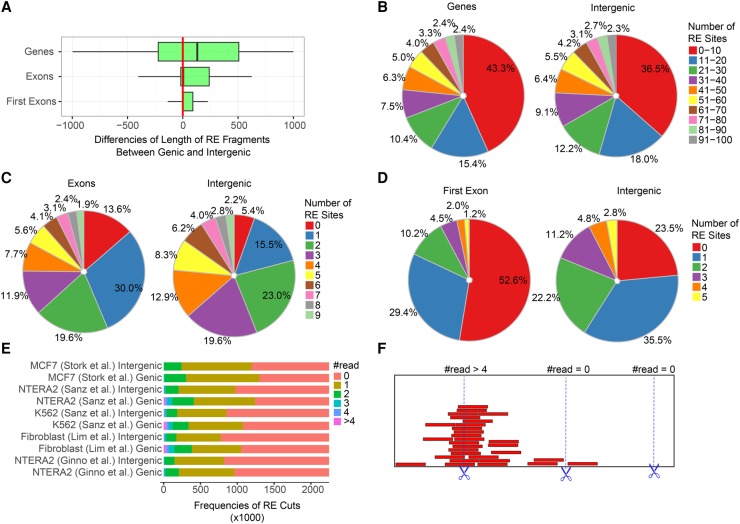
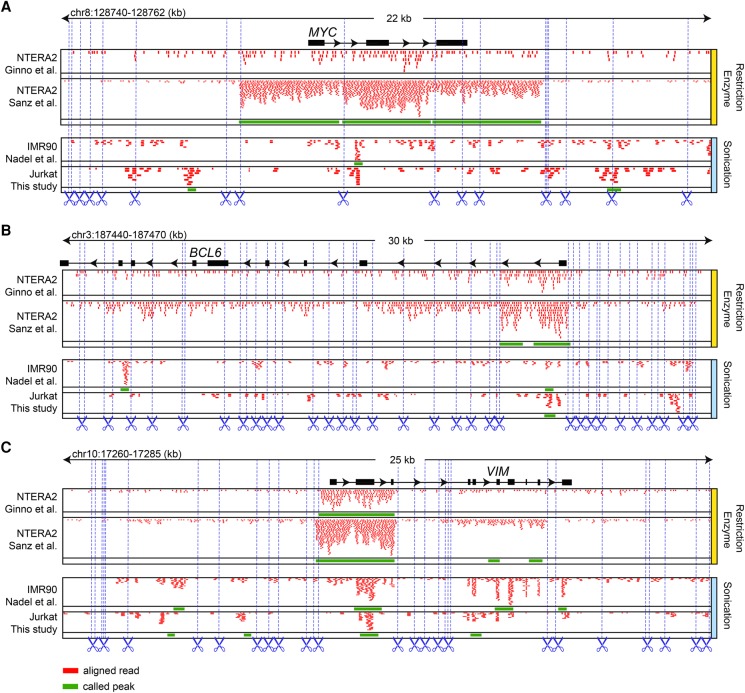
The impact of R-loops on the physiology and pathology of chromosomes has been demonstrated extensively by chromatin biology research. The progress in this field has been driven by technological advancement of R-loop mapping methods that largely relied on a single approach, DNA-RNA immunoprecipitation (DRIP). Most of the DRIP protocols use the experimental design that was developed by a few laboratories, without paying attention to the potential caveats that might affect the outcome of RNA-DNA hybrid mapping. To assess the accuracy and utility of this technology, we pursued an analytical approach to estimate inherent biases and errors in the DRIP protocol. By performing DRIP-sequencing, qPCR, and receiver operator characteristic (ROC) analysis, we tested the effect of formaldehyde fixation, cell lysis temperature, mode of genome fragmentation, and removal of free RNA on the efficacy of RNA-DNA hybrid detection and implemented workflows that were able to distinguish complex and weak DRIP signals in a noisy background with high confidence. We also show that some of the workflows perform poorly and generate random answers. Furthermore, we found that the most commonly used genome fragmentation method (restriction enzyme digestion) led to the overrepresentation of lengthy DRIP fragments over coding ORFs, and this bias was enhanced at the first exons. Biased genome sampling severely compromised mapping resolution and prevented the assignment of precise biological function to a significant fraction of R-loops. The revised workflow presented herein is established and optimized using objective ROC analyses and provides reproducible and highly specific RNA-DNA hybrid detection.
© 2017 Halász et al.; Published by Cold Spring Harbor Laboratory Press.
Figures
Similar articles
-
High-resolution, strand-specific R-loop mapping via S9.6-based DNA-RNA immunoprecipitation and high-throughput sequencing.Nat Protoc. 2019 Jun;14(6):1734-1755. doi: 10.1038/s41596-019-0159-1. Epub 2019 May 3. Nat Protoc. 2019. PMID: 31053798 Free PMC article.
-
DNA:RNA Immunoprecipitation from S. pombe Cells for qPCR and Genome-Wide Sequencing.Methods Mol Biol. 2022;2528:411-428. doi: 10.1007/978-1-0716-2477-7_27. Methods Mol Biol. 2022. PMID: 35704207
-
Detection and Characterization of R Loop Structures.Methods Mol Biol. 2017;1543:231-242. doi: 10.1007/978-1-4939-6716-2_13. Methods Mol Biol. 2017. PMID: 28349431
-
A genome-wide 3C-method for characterizing the three-dimensional architectures of genomes.Methods. 2012 Nov;58(3):277-88. doi: 10.1016/j.ymeth.2012.06.018. Epub 2012 Jul 6. Methods. 2012. PMID: 22776363 Free PMC article. Review.
-
The balancing act of R-loop biology: The good, the bad, and the ugly.J Biol Chem. 2020 Jan 24;295(4):905-913. doi: 10.1074/jbc.REV119.011353. Epub 2019 Dec 16. J Biol Chem. 2020. PMID: 31843970 Free PMC article. Review.
Cited by
-
A functional LSD1 coregulator screen reveals a novel transcriptional regulatory cascade connecting R-loop homeostasis with epigenetic regulation.Nucleic Acids Res. 2021 May 7;49(8):4350-4370. doi: 10.1093/nar/gkab180. Nucleic Acids Res. 2021. PMID: 33823549 Free PMC article.
-
Endogenous single-strand DNA breaks at RNA polymerase II promoters in Saccharomyces cerevisiae.Nucleic Acids Res. 2018 Nov 16;46(20):10649-10668. doi: 10.1093/nar/gky743. Nucleic Acids Res. 2018. PMID: 30445637 Free PMC article.
-
One, No One, and One Hundred Thousand: The Many Forms of Ribonucleotides in DNA.Int J Mol Sci. 2020 Mar 2;21(5):1706. doi: 10.3390/ijms21051706. Int J Mol Sci. 2020. PMID: 32131532 Free PMC article. Review.
-
The RNA interactome in the Hallmarks of Cancer.Wiley Interdiscip Rev RNA. 2023 Sep-Oct;14(5):e1786. doi: 10.1002/wrna.1786. Epub 2023 Apr 12. Wiley Interdiscip Rev RNA. 2023. PMID: 37042179 Free PMC article. Review.
-
Ribonuclease H1-targeted R-loops in surface antigen gene expression sites can direct trypanosome immune evasion.PLoS Genet. 2018 Dec 13;14(12):e1007729. doi: 10.1371/journal.pgen.1007729. eCollection 2018 Dec. PLoS Genet. 2018. PMID: 30543624 Free PMC article.
References
-
- Benore-Parsons M, Ayoub MA. 1997. Presence of RNase A causes aberrant DNA band shifts. Biotechniques 23: 128–131. - PubMed
-
- Bhatia V, Barroso SI, García-Rubio ML, Tumini E, Herrera-Moyano E, Aguilera A. 2014. BRCA2 prevents R-loop accumulation and associates with TREX-2 mRNA export factor PCID2. Nature 511: 362–365. - PubMed
Publication types
MeSH terms
Substances
LinkOut - more resources
Full Text Sources
Other Literature Sources