. 2017 Jun;163(3):461-474.
doi: 10.1007/s10549-017-4202-z. Epub 2017 Mar 24.

Tumour suppressor EP300, a modulator of paclitaxel resistance and stemness, is downregulated in metaplastic breast cancer

Affiliations

Tumour suppressor EP300, a modulator of paclitaxel resistance and stemness, is downregulated in metaplastic breast cancer

Muhammad Asaduzzaman et al. Breast Cancer Res Treat. 2017 Jun.

Erratum in

Abstract

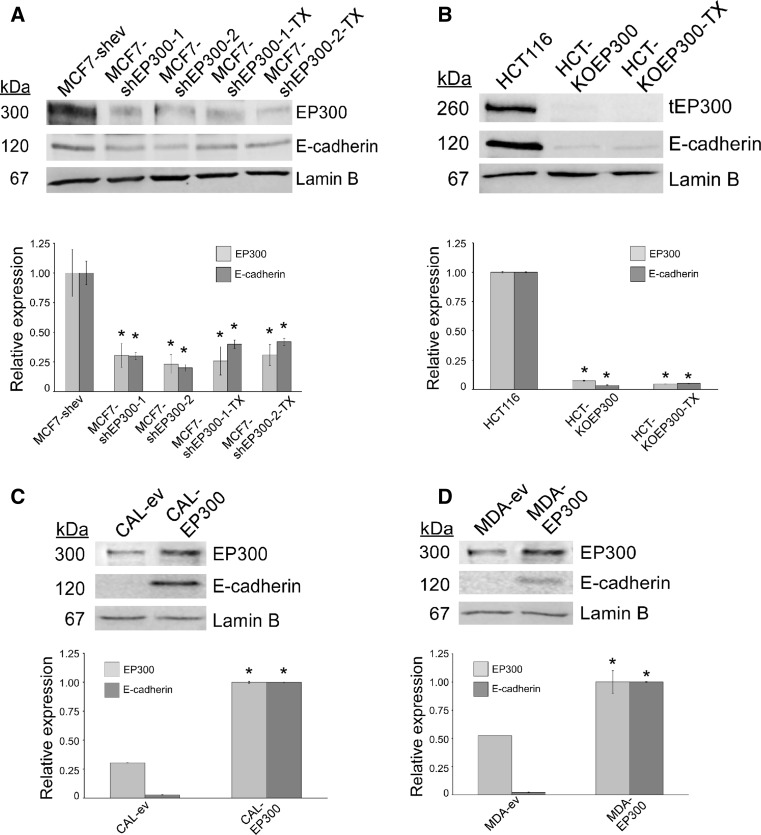
Purpose: We have previously described a novel pathway controlling drug resistance, epithelial-to-mesenchymal transition (EMT) and stemness in breast cancer cells. Upstream in the pathway, three miRs (miR-106b, miR-93 and miR-25) target EP300, a transcriptional activator of E-cadherin. Upregulation of these miRs leads to the downregulation of EP300 and E-cadherin with initiation of an EMT. However, miRs regulate the expression of many genes, and the contribution to EMT by miR targets other than EP300 cannot be ruled out.

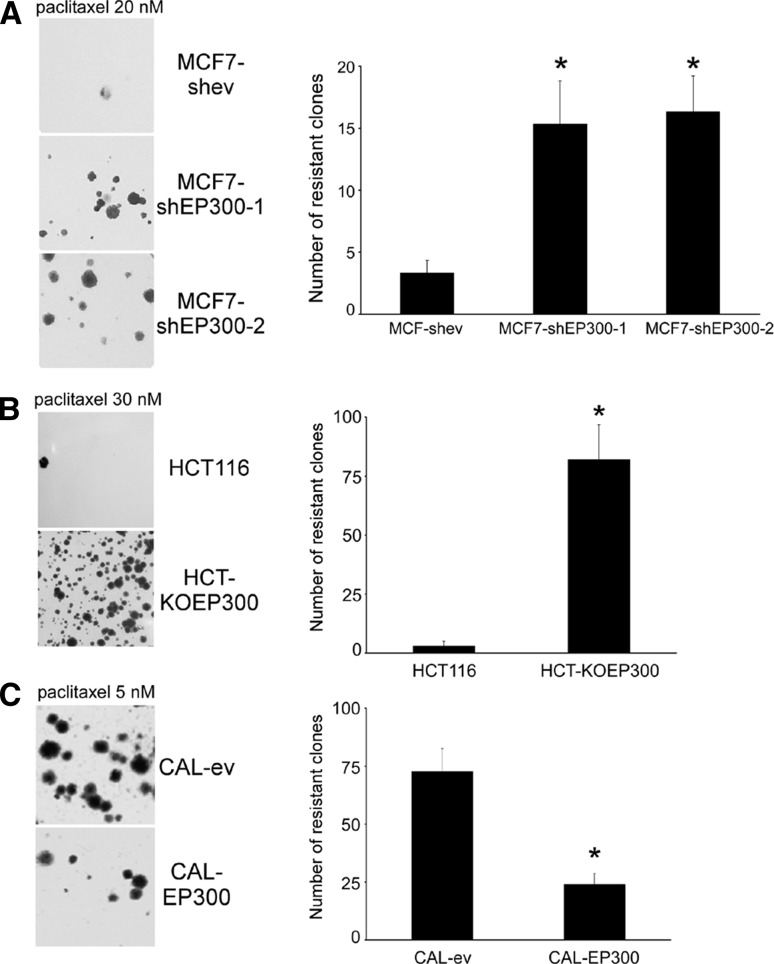
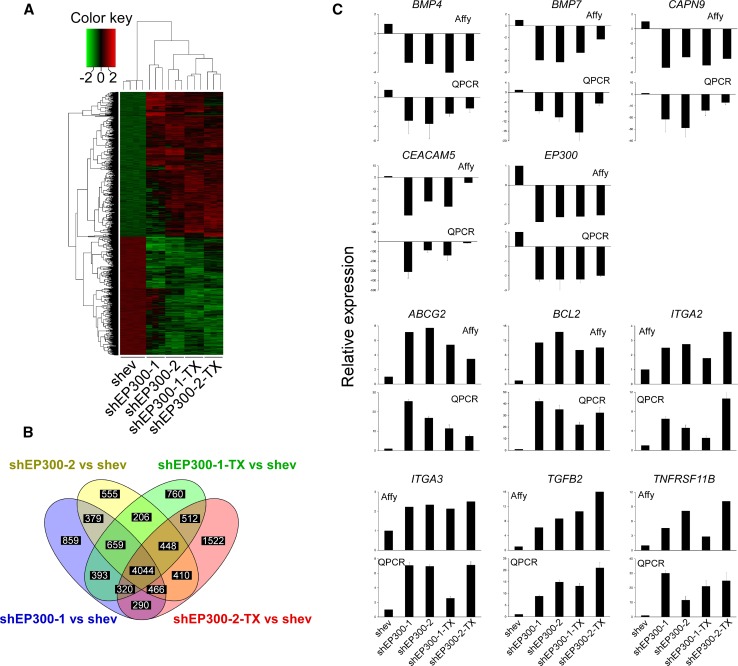
Methods: We used lentiviruses expressing EP300-targeting shRNA to downregulate its expression in MCF-7 cells as well as an EP300-knocked-out colon carcinoma cell line. An EP300-expression plasmid was used to upregulate its expression in basal-like CAL51 and MDA-MB-231 breast cancer cells. Drug resistance was determined by short-term proliferation and long-term colony formation assays. Stemness was determined by tumour sphere formation in both soft agar and liquid cultures as well as by the expression of CD44/CD24/ALDH markers. Gene expression microarray analysis was performed in MCF-7 cells lacking EP300. EP300 expression was analysed by immunohistochemistry in 17 samples of metaplastic breast cancer.

Results: Cells lacking EP300 became more resistant to paclitaxel whereas EP300 overexpression increased their sensitivity to the drug. Expression of cancer stem cell markers, as well as tumour sphere formation, was also increased in EP300-depleted cells, and was diminished in EP300-overexpressing cells. The EP300-regulated gene signature highlighted genes associated with adhesion (CEACAM5), cytoskeletal remodelling (CAPN9), stemness (ABCG2), apoptosis (BCL2) and metastasis (TGFB2). Some genes in this signature were also validated in a previously generated EP300-depleted model of breast cancer using minimally transformed mammary epithelial cells. Importantly, two key genes in apoptosis and stemness, BCL2 and ABCG2, were also upregulated in EP300-knockout colon carcinoma cells and their paclitaxel-resistant derivatives. Immunohistochemical analysis demonstrated that EP300 expression was low in metaplastic breast cancer, a rare, but aggressive form of the disease with poor prognosis that is characterized by morphological and physiological features of EMT.

Conclusions: EP300 plays a major role in the reprogramming events, leading to a more malignant phenotype with the acquisition of drug resistance and cell plasticity, a characteristic of metaplastic breast cancer.

Keywords: ABCG2; BCL2; Cancer stem cells; Drug resistance; EP300 signature; Metastasis.


Conflict of interest statement

Conflict of interest

The authors declare that they have no competing interests.

Ethical approval

All procedures performed in studies involving human participants were in accordance with the ethical standards of the Imperial College Healthcare Tissue Bank (R14086) and Breast Cancer Now Tissue Bank (BCNTB-TR000054) and with the 1964 Helsinki declaration and its later amendments or comparable ethical standards.

Figures

Fig. 1
Fig. 1
Experimental modulation of EP300 in cellular models. Expression of EP300 and E-cadherin was determined by immunoblot analyses. a EP300 was downregulated in breast cancer luminal MCF-7 cells by lentiviral expression of two different EP300 hairpins (MCF7-shEP300-1 and MCF7-shEP300-2). Cells expressing the empty pGIPZ vector (MCF7-shev) were used as control. b, a genetic knock-out of EP300 (HCT-KOEP300) is available in colon carcinoma HCT116 cells. This cell line is hemizygous for the EP300 locus and generates a C-terminus truncated EP300 protein [10]—note its lower molecular mass (tEP300, truncated EP300). Paclitaxel-resistant derivatives are indicated with the -TX name extension. c, d EP300 was upregulated in breast cancer basal-like CAL51 and MDA-MB-231 cells with an EP300 expression cassette in pcDNA3.1 (CAL-EP300 and MDA-EP300). In both cases, cells transfected with pcDNA3.1 were used as controls (CAL-ev and MDA-ev). Lamin B was used as a loading control. Representative pictures of three replicates are shown. Immunoblots were quantified and data are shown in the histograms as average ± SD of three blots. All statistical comparisons (*P < 0.05) versus control cells
Fig. 2
Fig. 2
EP300 regulates the generation of paclitaxel resistance. Cells were treated for 3 days with paclitaxel and drug-resistant clones were stained with crystal violet 3 weeks after (left panels) and counted (right panels). a, MCF-7 cells. b, HCT116 cells. c, CAL51 cells. Numerical data represent the average ± SD of three independent experiments. All statistical comparisons (*P < 0.05) versus control cells. Pictorial data show a representative of three different experiments
Fig. 3
Fig. 3
EP300 regulates stem cell markers. ac Flow cytometry plots after staining (a MCF-7 cells; b HCT116 cells; c MDA-MB-231 cells) with CD44-APC- and CD24-PE-conjugated antibodies. Paclitaxel-resistant cell derivatives (MCF7-shEP300-1-TX, MCF7-shEP300-2-TX and HCT-KOEP300) were generated from the corresponding cells after selection with 20 nM (MCF-7 cells) and 40 nM paclitaxel (HCT116 cells). Histograms indicate the percentage of CD44+/CD24 cells. d Upregulation of EP300 in CAL51 cells reduces the percentage of ALDH+ cells. Cells were treated with Aldefluor alone (ALDH) or in the presence of the ALDH inhibitor diethylaminobenzaldehyde (Control) and then analysed by flow cytometry. The green gate was set up with the control cells to include no more than 1% of the population and was used to determine the percentage of ALDH-positive cells in the absence of inhibitor. Representative flow cytometry plots are shown. Numerical data represent the average ± SD of three independent experiments. All statistical comparisons (*P < 0.05) versus control cells
Fig. 4
Fig. 4
EP300 regulates anchorage independence. Anchorage independence was determined by mammosphere formation in low attachment plates (ac) and the formation of clones in soft agar (de) after 2 and 4 weeks, respectively. Representative pictures of at least three independent experiments are shown. Numerical data indicate the anchorage independence efficiency after counting tumour spheres larger than 50 µm in diameter and is represented as the average ± SD of three independent experiments. All statistical comparisons (*P < 0.05) versus control cells
Fig. 5
Fig. 5
Genome-wide expression profile of EP300-downregulated MCF-7 cells, and their paclitaxel-resistant derivatives. a Hierarchical clustering of differentially expressed genes. Differentially upregulated expression values are shown in red, downregulated in green. Scale represents colour values corresponding to lg2 expression. b, Venn diagram indicating the number of differentially expressed genes in each of the pair-wise comparisons to MCF7-shev control cells. There were 4044 common differentially expressed genes present in all cells after downregulation of EP300. c Eleven genes were selected for validation by quantitative PCR. The top panel for each gene shows the normalized fluorescence from Affymetrix array expression data. The lower panel for each gene indicates the normalized QPCR data relative to the expression data obtained in control MCF7-shev cells. QPCR data represent the mean ± SD from three replicates
Fig. 6
Fig. 6
Validation of the EP300 signature in other cell models. a QPCR data from EP-downregulated minimally transformed mammary epithelial cells, and their paclitaxel-resistant derivatives. The gene set is the same that is used in Fig. 5c to validate the MCF-7 signature. b QPCR data of anti-apoptotic BCL2 and stem cell marker ABCG2 from the MCF-7 signature in HCT116 cells. c and d, Bcl-2 immunoblot (top panels) and blot quantification (lower panels) in both MCF-7 (c) and HCT116 (d) cell derivatives. β-actin is used as a loading control. Numerical data represent the average ± SD of three independent experiments. All statistical comparisons (*P < 0.05) versus control cells. Immunoblot shows a representative of three independent experiments
Fig. 7
Fig. 7
EP300 is downregulated in metaplastic breast cancer. a Validation of EP300 antibody using 10- and 100-fold molar excess competing peptide in two independent breast cancer samples. H&E, haematoxylin and eosin staining. Scale bar, 200 μm. b EP300 and E-cadherin staining in three representative samples of normal breast and metaplastic breast cancer. H&E, haematoxylin and eosin staining. Scale bar, 200 μm. c Loss of EP300 nuclear staining in metaplastic breast cancer. Pictures show representative zoomed-in shots illustrating nuclear EP300 localization in normal breast and its loss in metaplastic breast cancer. Scale bar, 20 μm. d Representative EP300 and E-cadherin staining in a metaplastic breast cancer sample with a squamous epithelium nest (bottom half). The top half is composed of spindle-like cells. Note the absence of E-cadherin and EP300 expression in the mesenchymal component but positive staining in the squamous nest. Scale bar, 200 μm

Similar articles

Cited by

References

    1. Sledge GW, Mamounas EP, Hortobagyi GN, Burstein HJ, Goodwin PJ, Wolff AC. Past, present, and future challenges in breast cancer treatment. J Clin Oncol. 2014;32(19):1979–1986. doi: 10.1200/JCO.2014.55.4139. - DOI - PMC - PubMed
    1. Mani SA, Guo W, Liao MJ, Eaton EN, Ayyanan A, Zhou AY, Brooks M, Reinhard F, Zhang CC, Shipitsin M, Campbell LL, Polyak K, Brisken C, Yang J, Weinberg RA. The epithelial-mesenchymal transition generates cells with properties of stem cells. Cell. 2008;133(4):704–715. doi: 10.1016/j.cell.2008.03.027. - DOI - PMC - PubMed
    1. Singh A, Settleman J. EMT, cancer stem cells and drug resistance: an emerging axis of evil in the war on cancer. Oncogene. 2010;29(34):4741–4751. doi: 10.1038/onc.2010.215. - DOI - PMC - PubMed
    1. Dave B, Mittal V, Tan NM, Chang JC. Epithelial-mesenchymal transition, cancer stem cells and treatment resistance. Breast Cancer Res. 2012;14(1):202. doi: 10.1186/bcr2938. - DOI - PMC - PubMed
    1. Liu YN, Lee WW, Wang CY, Chao TH, Chen Y, Chen JH. Regulatory mechanisms controlling human E-cadherin gene expression. Oncogene. 2005;24(56):8277–8290. doi: 10.1038/sj.onc.1208991. - DOI - PubMed

MeSH terms