Randomized Controlled Trial
. 2017 Jun;38(6):3190-3209.
doi: 10.1002/hbm.23584. Epub 2017 Mar 25.

Real-time fMRI neurofeedback in adolescents with attention deficit hyperactivity disorder

Affiliations
Randomized Controlled Trial

Real-time fMRI neurofeedback in adolescents with attention deficit hyperactivity disorder

Analucia A Alegria et al. Hum Brain Mapp. 2017 Jun.

Abstract

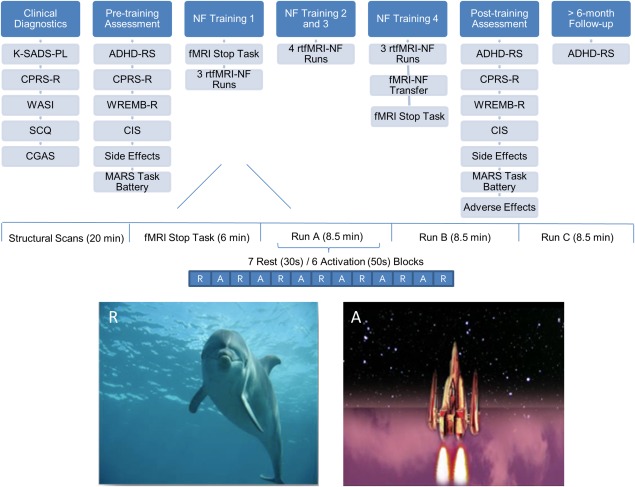
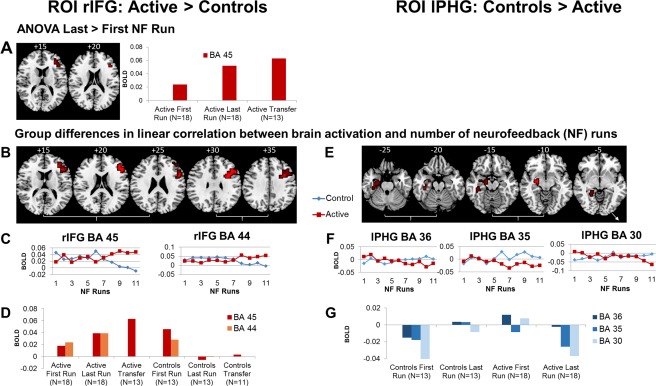
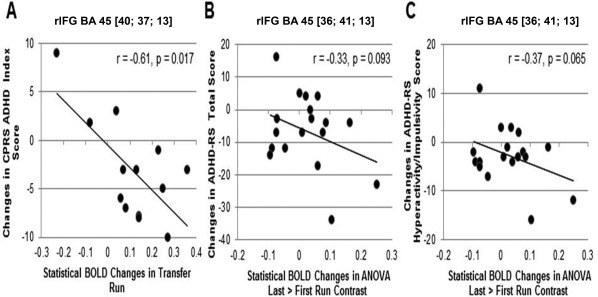
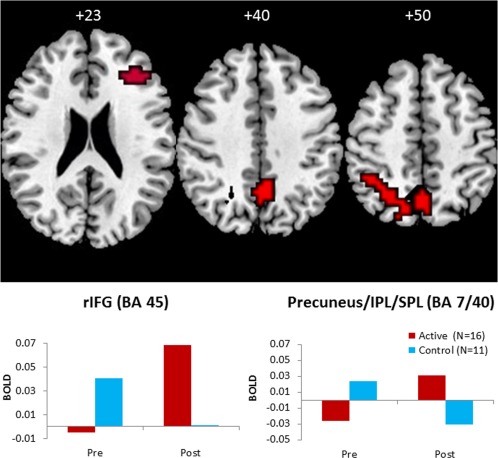
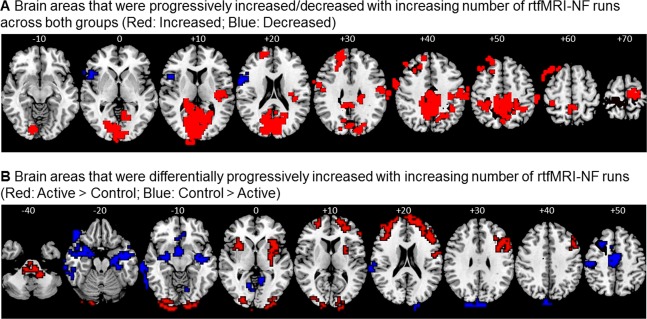
Attention Deficit Hyperactivity Disorder (ADHD) is associated with poor self-control, underpinned by inferior fronto-striatal deficits. Real-time functional magnetic resonance neurofeedback (rtfMRI-NF) allows participants to gain self-control over dysregulated brain regions. Despite evidence for beneficial effects of electrophysiological-NF on ADHD symptoms, no study has applied the spatially superior rtfMRI-NF neurotherapy to ADHD. A randomized controlled trial tested the efficacy of rtfMRI-NF of right inferior prefrontal cortex (rIFG), a key region that is compromised in ADHD and upregulated with psychostimulants, on improvement of ADHD symptoms, cognition, and inhibitory fMRI activation. To control for region-specificity, an active control group received rtfMRI-NF of the left parahippocampal gyrus (lPHG). Thirty-one ADHD boys were randomly allocated and had to learn to upregulate their target brain region in an average of 11 rtfMRI-NF runs over 2 weeks. Feedback was provided through a video-clip of a rocket that had to be moved up into space. A transfer session without feedback tested learning retention as a proximal measure of transfer to everyday life. Both NF groups showed significant linear activation increases with increasing number of runs in their respective target regions and significant reduction in ADHD symptoms after neurotherapy and at 11-month follow-up. Only the group targeting rIFG, however, showed a transfer effect, which correlated with ADHD symptom reductions, improved at trend level in sustained attention, and showed increased IFG activation during an inhibitory fMRI task. This proof-of-concept study demonstrates for the first time feasibility, safety, and shorter- and longer-term efficacy of rtfMRI-NF of rIFG in adolescents with ADHD. Hum Brain Mapp 38:3190-3209, 2017. © 2017 The Authors Human Brain Mapping Published by Wiley Periodicals, Inc.

Keywords: ADHD; fMRI; fMRI-neurofeedback; real-time fMRI neurofeedback; stop task.


Figures

Figure 1
Figure 1
Schematic overview of the design of the rtfMRI‐NF study. ADHD‐RS, Attention Deficit Hyperactivity Disorder‐Rating Scale; CGAS, Children's Global Assessment Scale; CIS, Columbia Impairment Scale; CPRS‐R, Conners’ Parent Rating Scale‐Revised; K‐SADS‐PL, Kiddie‐SADS‐Present and Lifetime Version; MARS, Maudsley Attention and Response Suppression task battery; NF, Neurofeedback; SCQ, Social Communication Questionnaire (Lifetime); Wechsler Abbreviated Scale of Intelligence, 2nd Edition (WASI‐II); WREMB‐R, Weekly Rating of Evening and Morning Behavior‐Revised. [Color figure can be viewed at http://wileyonlinelibrary.com]
Figure 2
Figure 2
Regional Brain Activation Changes in the Active Relative to the Control Group (left panel) and the Control Relative to the Active Group (right panel) in the two ROIs. (A) ANOVA results showing one region (in BA 45) within the right inferior frontal gyrus (rIFG) ROI that was significantly more activated in the last relative to the first rtfMRI‐NF run in the active compared with the control group; no significantly increased activation was observed in the control compared with the active group within their ROI (left parahippocampal gyrus, lPHG). The same region in BA 45 was also significantly more activated in the transfer relative to baseline (rest) condition in the active relative to the control group (A, D). (B–G) Shown are brain regions within each ROI that show significantly progressively increased activations with increasing number of rtfMRI‐NF runs for the active compared with the control group and for the control compared with the active group (E–G). (B) Two regions within rIFG ROI (in BA 45 and BA 44) were significantly more linearly activated across the 11 rtfMRI‐NF runs in the active relative to the control group. (C) For each cluster within the rIFG ROI that showed a significant increase in correlation of activation with number of rtfMRI‐NF runs in the active relative to the control group, the statistical blood oxygen level‐dependent (BOLD) response is shown for each group for each rtfMRI‐NF run. (D) Statistical BOLD response is shown for the 2 rIFG ROIs in the first and last rtfMRI‐NF run and in the transfer session in the active and the control groups. (E) Three regions within the lPHG ROI (in BA 30, BA 35, and BA 36) were significantly more linearly activated across the 11 rtfMRI‐NF runs in the control compared with the active group. (F) The statistical BOLD response for each group for each cluster within lPHG ROI that was significantly more correlated with number of rtfMRI‐NF runs in the control relative to the active group was plotted against the number of rtfMRI‐NF runs for each group. (G) Statistical BOLD response is shown within lPHG in the first and last rtfMRI‐NF run in the active and the control groups, but there was no transfer effect. The functional data are superimposed on a high‐resolution anatomical template using the MRIcron software [Rorden and Brett, 2000]. Peak Talairach z‐coordinates are indicated for slice distance (in mm) from the intercommissural line. The right side of the image corresponds to the right side of the brain. Note that “last” rtfMRI‐NF run refers to the 11th or earlier rtfMRI‐NF run, depending on whether the subject completed all 11rtfMRI‐NF runs. [Color figure can be viewed at http://wileyonlinelibrary.com]
Figure 3
Figure 3
Scatter plots showing Pearson's correlations between improvements in primary and secondary clinical outcome scores (post‐pre) and statistical BOLD changes in brain activation in rIFG‐ROI for the active group. (A) In the transfer runs, the BOLD response (increases) was significantly negatively correlated with (reduced) CPRS ADHD index score. (B) There was a trend for a negative correlation between an (increased) BOLD signal in the last (11th or earlier) relative to the first rtfMRI‐NF run and (reduced) ADHD‐RS Total score and (C) with (reduced) ADHD‐RS Hyperactivity/Impulsivity scores.
Figure 4
Figure 4
Brain regions that showed increased activation to successful Stop relative to successful Go trials post‐rtfMRI‐NF training compared with pre‐rtfMRI‐NF training in the active compared with the control group. Shown is increased activation in precuneus/inferior and superior parietal lobe (IPL/SPL) (P < 0.05 at voxel, and P < 0.05 at cluster‐level) and increased activation in the apriori hypothesized right inferior frontal gyrus (rIFG) at a more lenient cluster‐level threshold of P < 0.03. On the lower panel, the statistical blood oxygen level‐dependent (BOLD) response pre‐ and post‐rtfMRI‐NF is plotted for the rIFG and the precuneus/IPL/SPL for each group. The functional data are superimposed on a high‐resolution anatomical template using the MRIcron software [Rorden and Brett, 2000]. Peak Talairach z‐coordinates are indicated for slice distance (in mm) from the intercommissural line. The right side of the image corresponds to the right side of the brain. [Color figure can be viewed at http://wileyonlinelibrary.com]
Figure 5
Figure 5
Whole‐brain analysis showing commonly and differentially linearly increased activation in the two groups. (A) Regions that show progressively increased (red)/decreased (blue) activation across both groups with number of rtfMRI‐NF runs (whole‐brain correlation between number of rtfMRI‐NF runs and brain activation across both groups; see Table 4). (B) Regions that were significantly more increased in activation across rtfMRI‐NF runs in the active relative to the control group (red) and in the control relative to the active group (blue) (group differences in whole‐brain correlation between brain activation and number of rtfMRI‐NF runs; see Table 5). The functional data are superimposed on a high‐resolution anatomical template using the MRIcron software [Rorden and Brett, 2000]. Peak Talairach z‐coordinates are indicated for slice distance (in mm) from the intercommissural line. The right side of the image corresponds to the right side of the brain. [Color figure can be viewed at http://wileyonlinelibrary.com]

Similar articles

Cited by

References

    1. Aminoff EM, Kveraga K, Bar M (2013): The role of the parahippocampal cortex in cognition. Trends Cogn Sci 17:379–390. - PMC - PubMed
    1. Arns M, Kenemans JL (2014): Neurofeedback in ADHD and insomnia: Vigilance stabilization through sleep spindles and circadian networks. Neurosci Biobehav Rev 44:183–194. - PubMed
    1. Arns M, de Ridder S, Strehl U, Breteler M, Coenen A (2009): Efficacy of neurofeedback treatment in ADHD: The effects on inattention, impulsivity and hyperactivity: A meta‐analysis. Clin EEG Neurosci 40:180–189. - PubMed
    1. Baumeister S, Wolf I, Holz N, Boecker‐Schlier R, Adamo N, Holtmann M, Ruf M, Banaschewski T, Hohmann S, Brandeis D (2016): Neurofeedback training effects on inhibitory brain activation in ADHD: A matter of learning? Neuroscience. doi: 10.1016/j.neuroscience.2016.09.025. [Epub ahead of print] - DOI - PubMed
    1. Bird HR, Shaffer D, Fisher P, Gould MS, Staghezza B, Chen JY, Hoven C (1993): The Columbia‐impairment‐scale (cis) ‐ pilot findings on a measure of global impairment for children and adolescents. Int J Methods Psychiatric Res 3:167–176.

Publication types

MeSH terms