. 2017 Jun;10(3):346-356.
doi: 10.1016/j.tranon.2017.01.014. Epub 2017 Mar 23.

Distinct Patterns of Stromal and Tumor Expression of ROR1 and ROR2 in Histological Subtypes of Epithelial Ovarian Cancer

Affiliations

Distinct Patterns of Stromal and Tumor Expression of ROR1 and ROR2 in Histological Subtypes of Epithelial Ovarian Cancer

C E Henry et al. Transl Oncol. 2017 Jun.

Abstract

Objective: The ROR1 and ROR2 receptor tyrosine kinases have both been implicated in ovarian cancer progression and have been shown to drive migration and invasion. There is an increasing importance of the role of stroma in ovarian cancer metastasis; however, neither ROR1 nor ROR2 expression in tumor or stromal cells has been analyzed in the same clinical cohort.

Aim: To determine ROR1 and ROR2 expression in ovarian cancer and surrounding microenvironment and examine associations with clinicopathological characteristics.

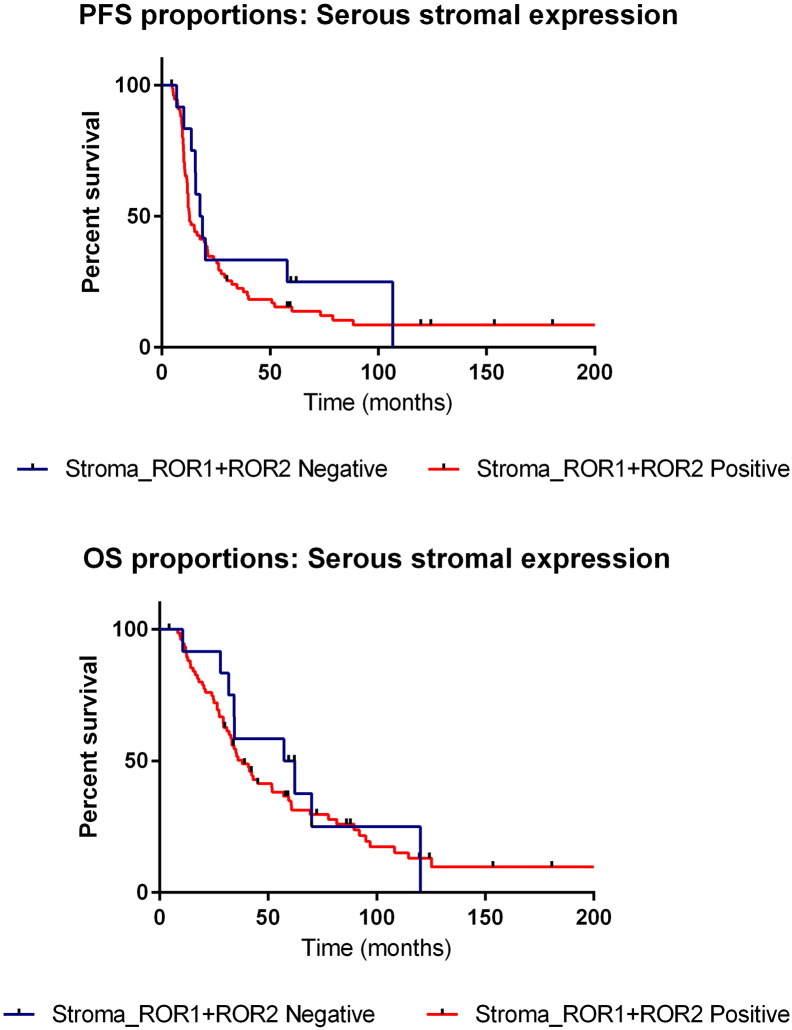
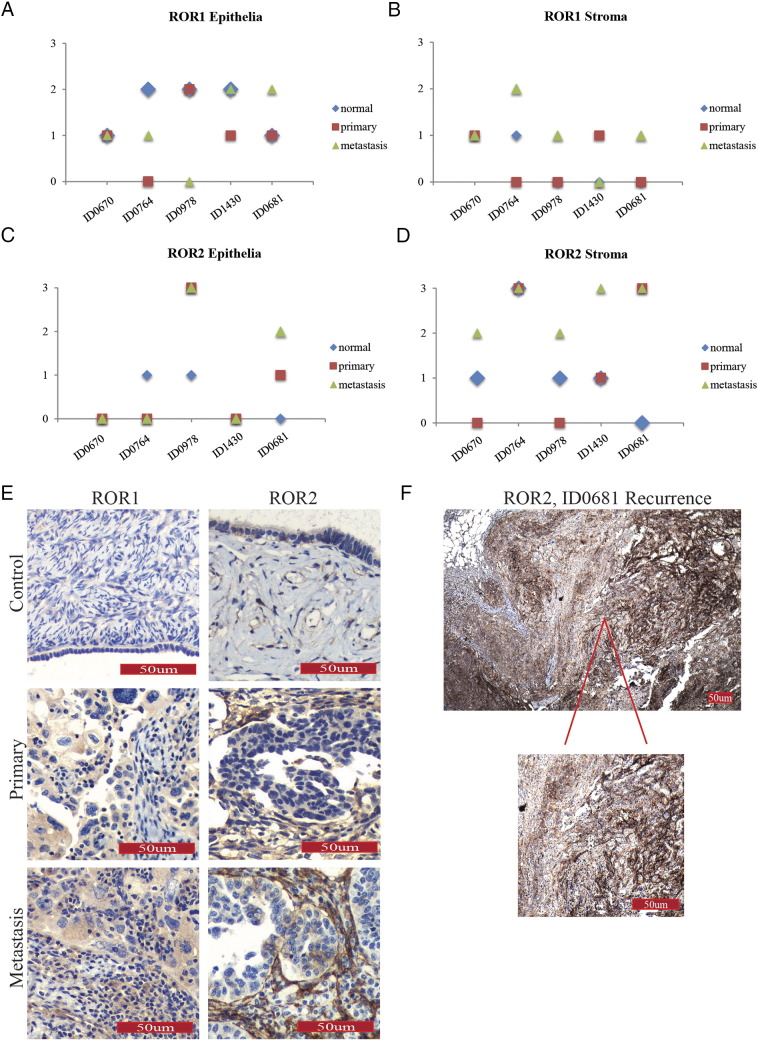
Methods: Immunohistochemistry for ROR1 and ROR2 was used to assess receptor expression in a cohort of epithelial ovarian cancer patients (n=178). Results were analyzed in relation to clinical and histopathological characteristics and survival. Matched patient sample case studies of normal, primary, and metastatic lesions were used to examine ROR expression in relation to ovarian cancer progression.

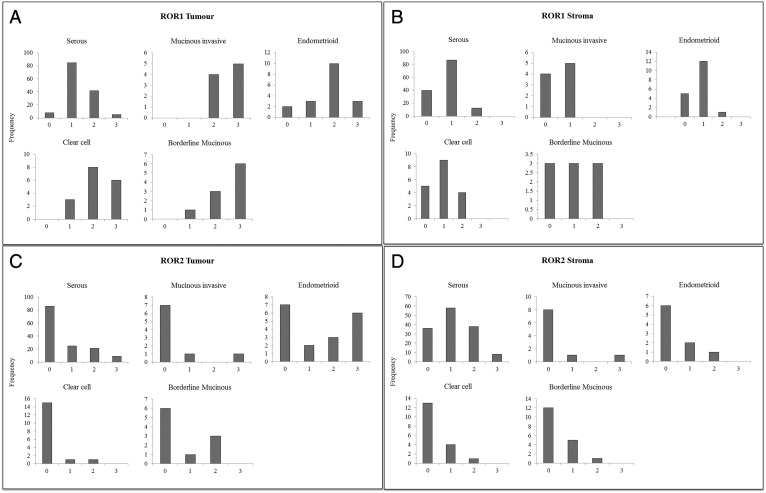
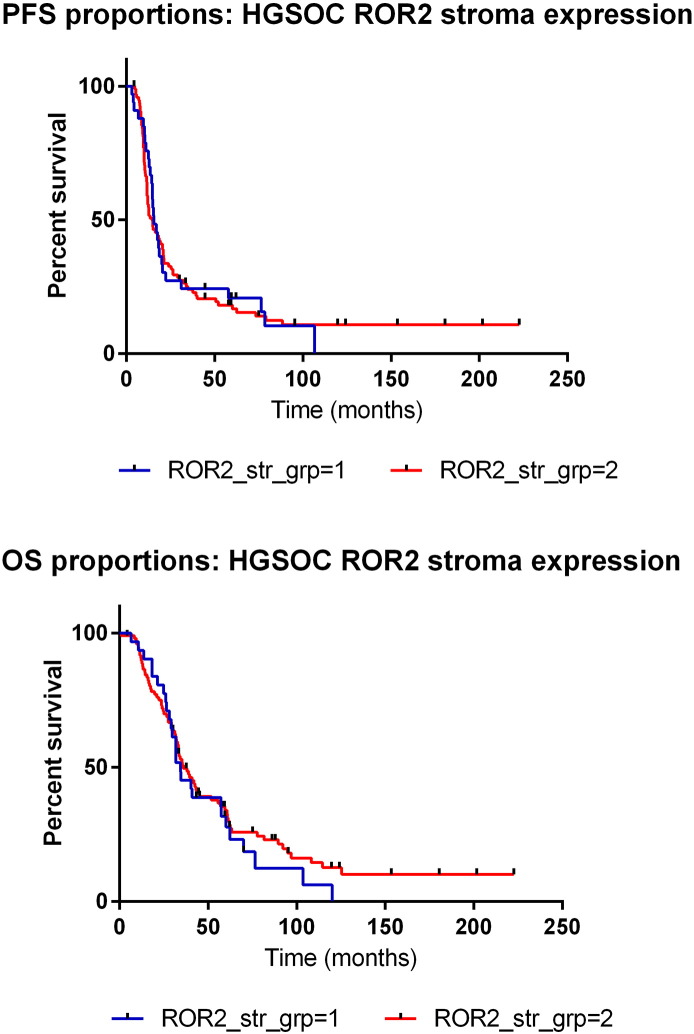
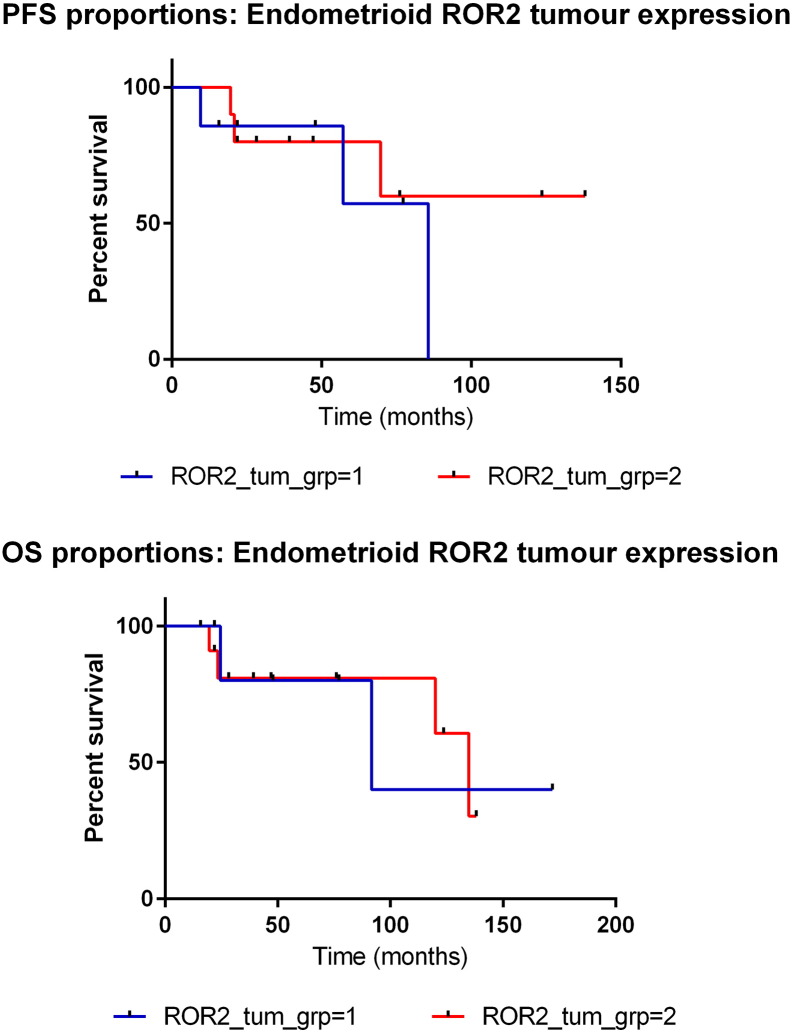
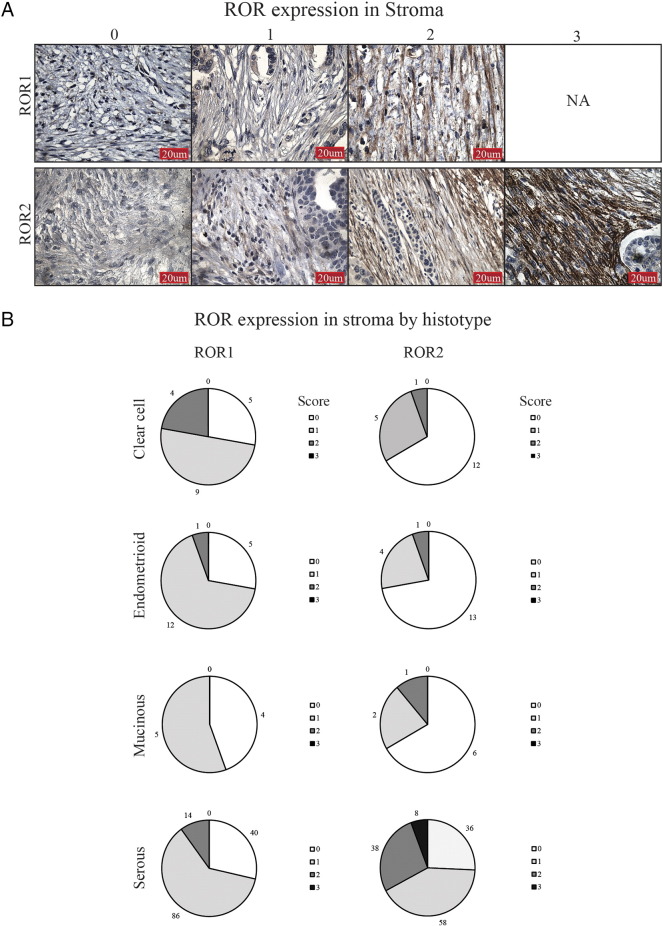
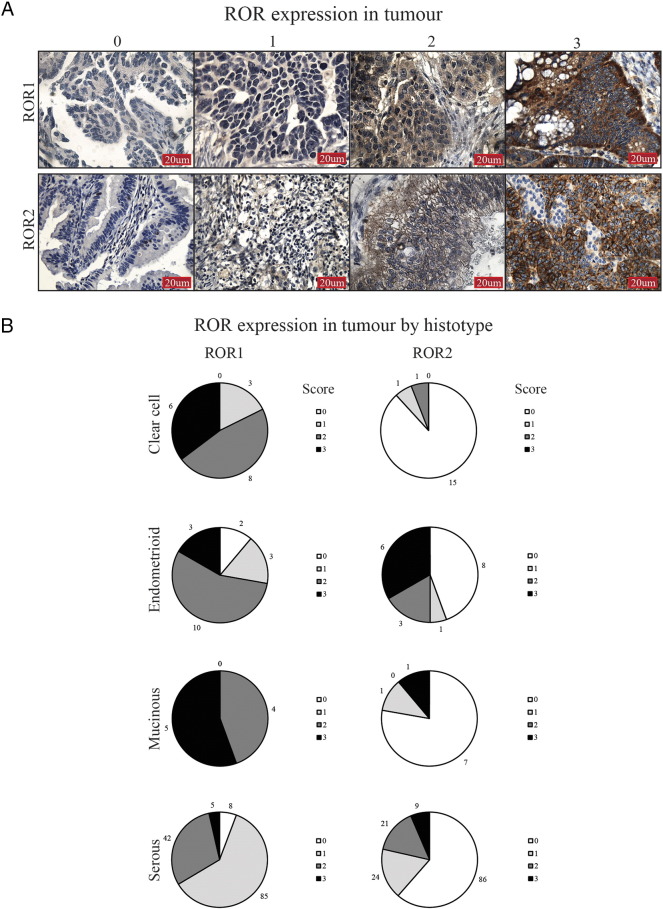
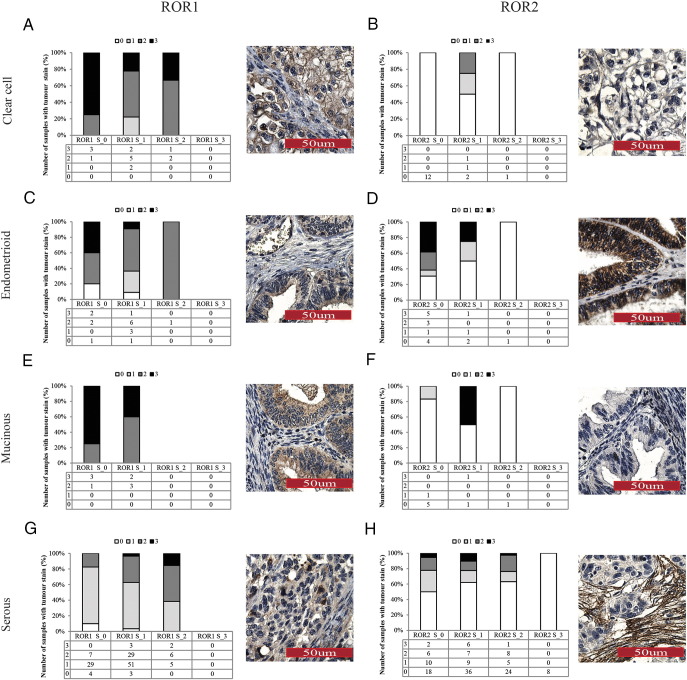
Results: ROR1 and ROR2 are abnormally expressed in malignant ovarian epithelium and stroma. Higher ROR2 tumor expression was found in early-stage, low-grade endometrioid carcinomas. ROR2 stromal expression was highest in the serous subtype. In matched patient case studies, metastatic samples had higher expression of ROR2 in the stroma, and a recurrent sample had the highest expression of ROR2 in both tumor and stroma.

Conclusion: ROR1 and ROR2 are expressed in tumor-associated stroma in all histological subtypes of ovarian cancer and hold potential as therapeutic targets which may disrupt tumor and stroma interactions.


Figures

Supplementary Figure 1
Frequency distribution of ROR scores. (A) Frequency distribution of ROR1 scores in tumor cells by subtype (from left to right: serous, mucinous invasive, endometrioid, clear cell, and mucinous borderline). (B) Frequency distribution of ROR1 scores in stroma by subtype (from left to right: serous, mucinous invasive, endometrioid, clear cell, and mucinous borderline). (C) Frequency distribution of ROR2 scores in tumor cells by subtype (from left to right: serous, mucinous invasive, endometrioid, clear cell, and mucinous borderline). (D) Frequency distribution of ROR2 scores in stroma by subtype (from left to right: serous, mucinous invasive, endometrioid, clear cell, and mucinous borderline).
Supplementary Figure 2
HGSOC ROR2 stroma survival analysis. (A) Kaplan-Meier curve representing progression-free survival (PFS) of HGSOC patients with ROR2 weak (group 1, blue) and ROR2 strong (group 2, red) stroma expression. No significant trend was found. (B)Kaplan-Meier curve representing overall survival (OS) of HGSOC patients with ROR2 weak (group 1, blue) and ROR2 strong (group 2, red) stromal expression. No significant trend was found.
Supplementary Figure 3
Endometrioid ROR2 tumor survival analysis. (A)Kaplan-Meier curve representing PFS of endometrioid patients with ROR2 weak (group 1, blue) and ROR2 strong (group 2, red) tumor expression. Nonsignificant trend shows strong expression may have better prognosis. (B)Kaplan-Meier curve representing OS of endometrioid patients with ROR2 weak (group 1, blue) and ROR2 strong (group 2, red) tumor expression. Nonsignificant trend shows strong expression may have better prognosis.
Figure 1
Figure 1
ROR expression in OC stroma. (A) Representative images of stromal ROR1 (top panel) and ROR2 (bottom panel) IHC, from a score of 0 to 3. ROR1 staining did not have strong expression in the stroma, and therefore, no representative figure of score 3 is shown (NA). (B) ROR expression in the stroma depicted by histological subtype. Each pie chart represents percentage of samples and ROR score per subtype. Scores of 0 to 3 colored white, light gray, gray, and dark gray, respectively.
Figure 2
Figure 2
ROR expression in OC tumor. (A) Representative images of tumor ROR1 (top panel) and ROR2 (bottom panel) IHC, from a score of 0 to 3. (B) ROR expression in the tumor depicted by subtype. Each pie chart represents percentage of samples and ROR score per subtype. Scores of 0 to 3 colored white, light gray, gray, and dark gray, respectively.
Figure 3
Figure 3
ROR expression relationship in tumor and stroma. Each panel represents number of tumor ROR expression scores for each stroma score (x-axis, ROR S_0, ROR S_1, ROR S_2 and ROR S_3). Tumor ROR scores are represented by shading and distribution listed underneath. Each graph is paired with a representative image of the overall pattern of expression for that subtype. (A) ROR1 tumor and stroma expression in clear cell OC showed overall low stroma intensity but high tumor intensity. (B) ROR2 expression was overall low in both tumor and stroma in clear cell OC. (C) ROR1 expression in endometrioid OC was overall strong in tumor cells and weak in stroma. (D) ROR2 expression in endometrioid OC was very strong in tumor cells and absent in stroma. (E) ROR1 expression in mucinous OC was high in tumor and low in stroma. (F) ROR2 expression in mucinous OC was overall weak in both tumor and stroma. (G) ROR1 expression in serous tumor increased as stroma expression increased, but overall expression was mid to low. (H) ROR2 expression in serous OC tumor decreased as stroma expression increased. All cases with a stromal score of 3 exhibited absent tumor expression.
Figure 4
Figure 4
Survival proportions of ROR stroma expression. (A): Kaplan-Meier curve representing PFS of patients (serous subtype only) with both ROR1 and ROR2 stroma positivity (red) and ROR1 and ROR2 stromal absence (blue). (B) Kaplan Meier curve representing OS of patients (serous subtype only) with both ROR1 and ROR2 stroma positivity (red) and ROR1 and ROR2 stromal absence (blue).
Figure 5
Figure 5
Tracking ROR expression in individual case studies. (A) ROR1 expression in epithelial/tumor cells in individual cases as indicated by colored dots (blue = normal, red = primary, green = metastatic samples). Y-axis represents ROR expression score, and x-axis represents individual patient. (B) ROR1 expression in stromal cells in individual cases as indicated by colored dots (blue = normal, red = primary, green = metastatic samples). Y-axis represents ROR expression score, and x-axis represents individual patient. (C): ROR2 expression in epithelial/tumor cells in individual cases as indicated by colored dots (blue = normal, red = primary, green = metastatic samples). Y-axis represents ROR expression score, and x-axis represents individual patient. (D) ROR2 expression in stromal cells in individual cases as indicated by indicated by colored dots (blue = normal, red = primary, green = metastatic samples). Y-axis represents ROR expression score, and x-axis represents individual patient. (E) Representative images of ROR1 (left panel) and ROR2 (right panel) in case studies, with noticeable ROR2 expression in stromal components in primary and metastatic samples. (F) Representative image of case ID0681 recurrence showing diffuse and strong ROR2 expression in tumor and stroma.

References

    1. Polakis P. Wnt signaling in cancer. Cold Spring Harb Perspect Biol. 2012;4(5):a008052. - PMC - PubMed
    1. Tan H, He Q, Gong G, Wang Y, Li J, Wang J, Zhu D, Wu X. miR-382 inhibits migration and invasion by targeting ROR1 through regulating EMT in ovarian cancer. Int J Oncol. 2016;48(1):181–190. - PubMed
    1. Zhang S, Chen L, Cui B, Chuang HY, Yu J, Wang-Rodriguez J, Tang L, Chen G, Basak GW, Kipps TJ. ROR1 is expressed in human breast cancer and associated with enhanced tumor-cell growth. PLoS One. 2012;7(3):e31127. - PMC - PubMed
    1. Chien HP, Ueng SH, Chen SC, Chang YS, Lin YC, Lo YF, Chang HK, Chuang WY, Huang YT, Cheung YC. Expression of ROR1 has prognostic significance in triple negative breast cancer. Virchows Arch. 2016;468(5):589–595. - PubMed
    1. Fernandez NB, Lorenzo D, Picco ME, Barbero G, Dergan-Dylon LS, Marks MP, Garcia-Rivello H, Gimenez L, Labovsky V, Grumolato L. ROR1 contributes to melanoma cell growth and migration by regulating N-cadherin expression via the PI3K/Akt pathway. Mol Carcinog. 2015;55:1772–1785. - PubMed