. 2017 Jul 1:397:52-60.
doi: 10.1016/j.canlet.2017.03.025. Epub 2017 Mar 23.

Lipid quantification by Raman microspectroscopy as a potential biomarker in prostate cancer

Affiliations

Lipid quantification by Raman microspectroscopy as a potential biomarker in prostate cancer

Jordan O'Malley et al. Cancer Lett. .

Abstract

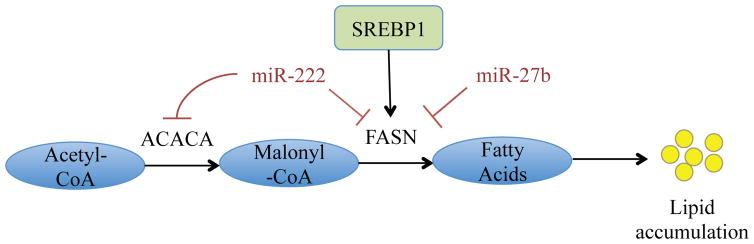
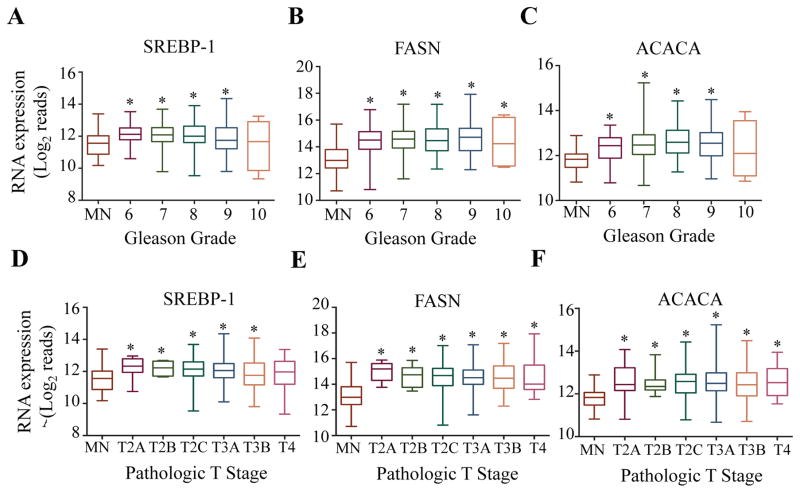
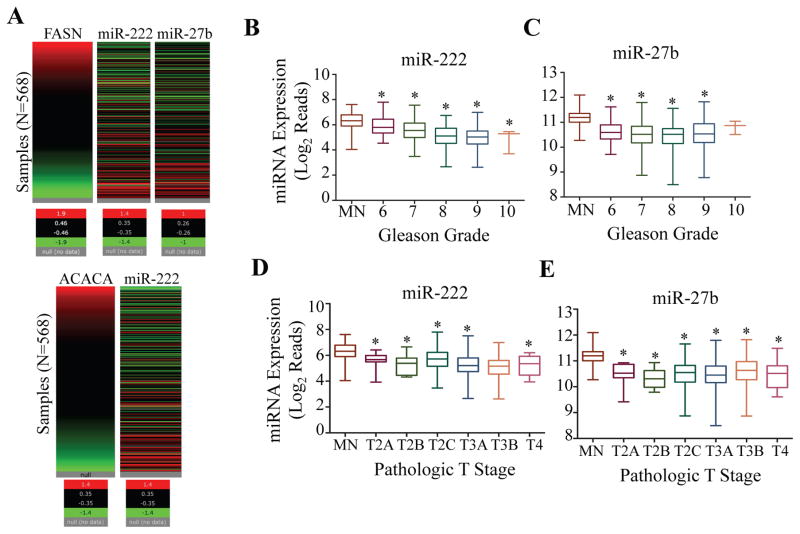
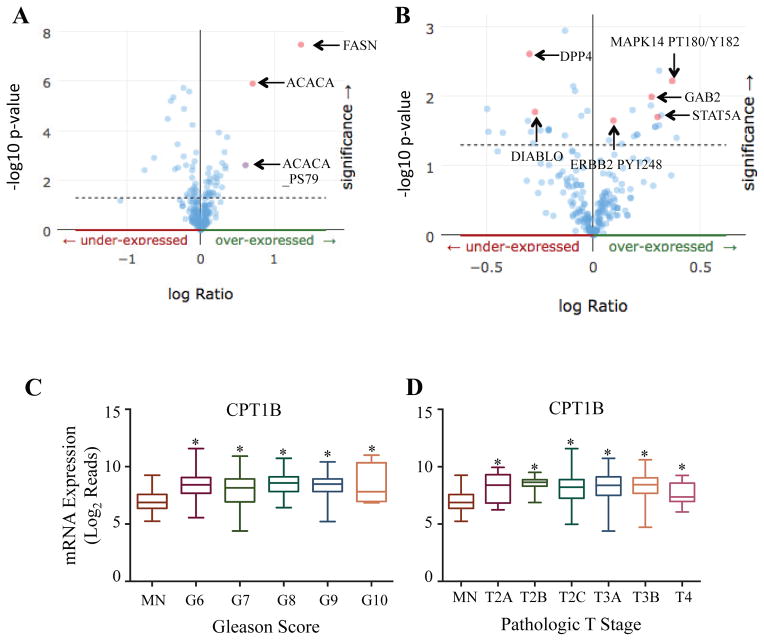
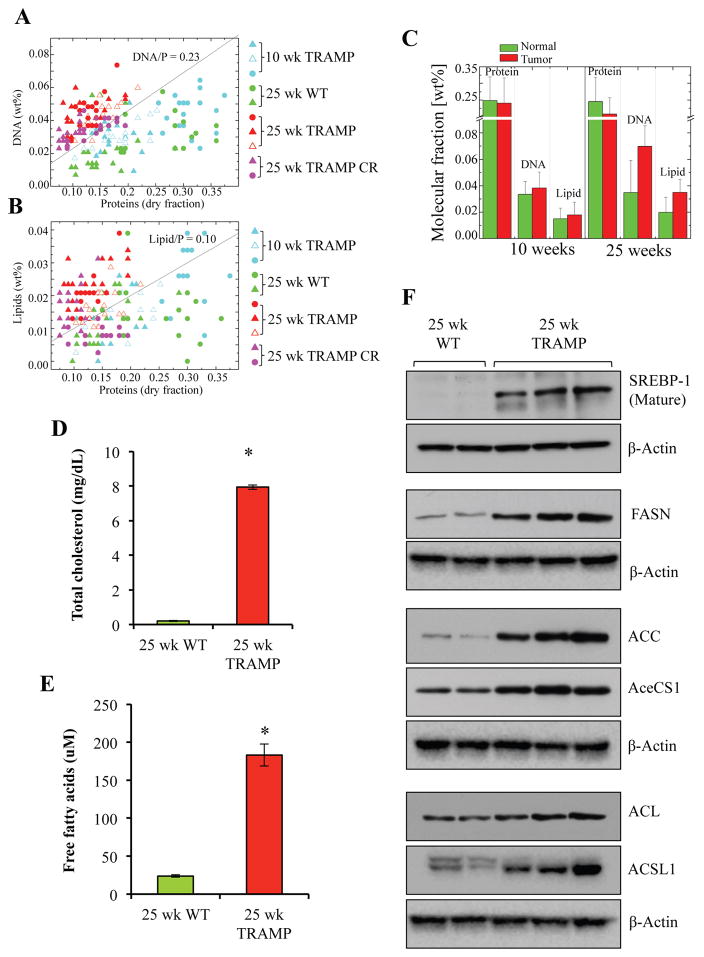
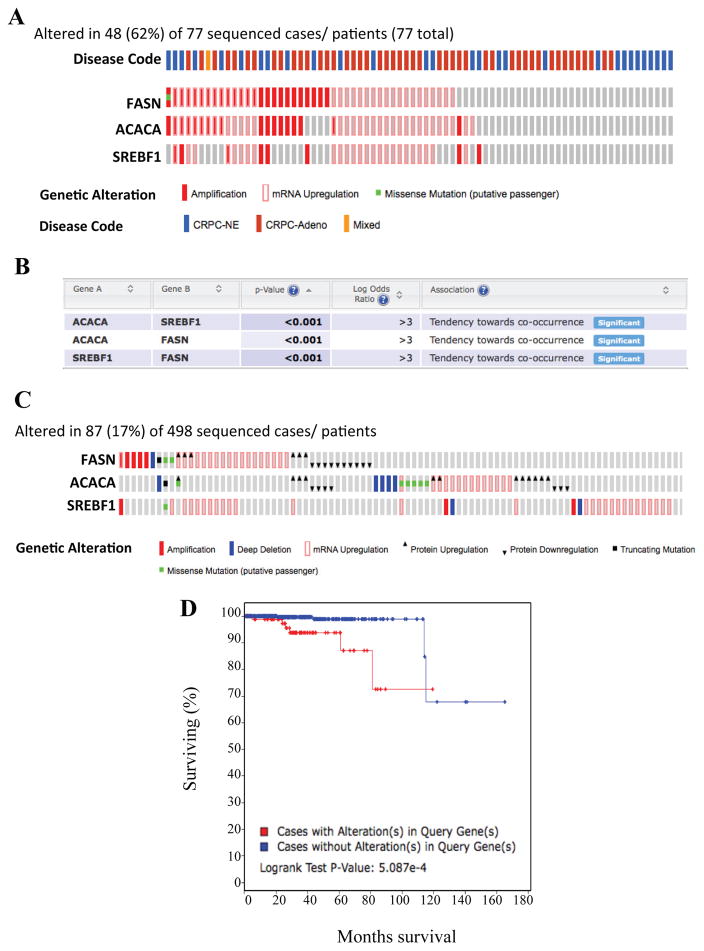
Metastatic castration-resistant prostate cancer (mCRPC) remains incurable and is one of the leading causes of cancer-related death among American men. Therefore, detection of prostate cancer (PCa) at early stages may reduce PCa-related mortality in men. We show that lipid quantification by vibrational Raman Microspectroscopy and Biomolecular Component Analysis may serve as a potential biomarker in PCa. Transcript levels of lipogenic genes including sterol regulatory element-binding protein-1 (SREBP-1) and its downstream effector fatty acid synthase (FASN), and rate-limiting enzyme acetyl CoA carboxylase (ACACA) were upregulated corresponding to both Gleason score and pathologic T stage in the PRAD TCGA cohort. Increased lipid accumulation in late-stage transgenic adenocarcinoma of mouse prostate (TRAMP) tumors compared to early-stage TRAMP and normal prostate tissues were observed. FASN along with other lipogenesis enzymes, and SREBP-1 proteins were upregulated in TRAMP tumors compared to wild-type prostatic tissues. Genetic alterations of key lipogenic genes predicted the overall patient survival using TCGA PRAD cohort. Correlation between lipid accumulation and tumor stage provides quantitative marker for PCa diagnosis. Thus, Raman spectroscopy-based lipid quantification could be a sensitive and reliable tool for PCa diagnosis and staging.

Keywords: Biomarker; Lipogenesis; Prostate cancer; Raman microspectroscopy; TRAMP.


Figures

Figure 1
Figure 1. Schematic of key steps in lipogenesis
Acetyl-CoA is carboxylated by acetyl-CoA carboxylase (ACC) to form malonyl-CoA. In the rate-limiting step, malonyl-CoA is synthesized into palmitic acid and various other fatty acids via fatty acid synthase (FASN). These fatty acids are accumulated and stored as lipid droplets, which can be used as fuel source in proliferating tumor cells.
Figure 2
Figure 2. Key lipogenic genes are upregulated with respect to disease progression
RNA-seq datasets derived from human PCa patient samples were retrieved from TCGA (version 2016-08-16) in their normalized format. RNA-seq values for SREBP-1, FASN and ACACA were grouped by matched normal tissue and Gleason score (A–C) or MN and pathologic T score (D–F). A Student’s T-Test was performed to determine statistical difference between MN and other groups (*=p<0.05)
Figure 3
Figure 3. Negative regulators of key lipogenic genes are repressed with respect to disease progression
A) Heatmaps representing the correlation between levels of miR-222 and miR-27b with transcript levels of FASN and ACACA, respectively, in the TCGA PRAD dataset (generated via cBioportal). Patient samples were retrieved from TCGA (version 2016-08-16) in their normalized format. miRNA-seq values for miR-222 and miR27b were grouped by matched normal tissue and Gleason score (B&C) or MN and pathologic T score (D&E). A Student’s T-Test was performed to determine statistical difference between MN and other groups (*=p<0.05)
Figure 4
Figure 4. The lipogenic pathway is active in patients with prostate adenocarcinoma and correlates with induction of aggressive pathways
Patient protein data from TCGA PRAD (Provisional) was acquired via cBioportal. A) Protein co-expression analysis was performed in patients with enriched SREBP-1 expression. Arrow identifies notable proteins that were co-expressed with SREBP-1. B) Protein co-expression analysis was performed in patients with enriched FASN expression. Arrow identifies notable proteins that were co-expressed with FASN. RNA-seq datasets derived from human PCa patient samples were retrieved from TCGA (version 2016-08-16) in their normalized format. RNA-seq values for CPT1B were grouped by matched normal tissue and Gleason score (C) or MN and pathologic T score (D). A Student’s T-Test was performed to determine statistical difference between MN and other groups (*=p<0.05)
Figure 5
Figure 5. Lipogenesis is upregulated in poorly differentiated PCa
A) DNA versus Protein distribution in cell nuclei of different tissue slices B) Lipid versus Protein distribution in cell nuclei of different tissue slices. Ratios DNA/P = 0.23 (A) and Lipids/P = 0.10 (B) represent interface lines between 3normal2 (lower part) and 3tumor2 (upper part) cells. C) Mean value of weight fraction of proteins, DNA and Lipids in normal and tumor cell nucleus. D) Total cholesterol content was measured and quantitates in 25 wk WT and 25 wk TRAMP prostatic tissue as described in material and methods and represented as mg/dL. E) Free fatty acid content was measured and quantitates in 25 wk WT and 25 wk TRAMP prostatic tissue as described in material and methods and represented as μM. A Student’s T-Test was performed to determine statistical difference between WT and TRAMP groups (n=3, *=p<0.05). F) Protein expression levels of SREBP-1 and key lipogenic enzymes like FASN, ACC, AceCS1, ACL and ACSL1 in 25 wk WT and 25 wk TRAMP prostatic tissue lysates were analyzed by western blotting as described in Material and Methods. Membranes were probed with β-Actin as a loading control.
Figure 6
Figure 6. Alterations in key lipogenic genes predict overall survival in patients with prostate adenocarcinoma
A) Genetic and mRNA alteration of key lipogenic genes in patients with neuroendocrine PCa, made publicly available by cBioportal. B) Chart depicting the probability that alterations in the key lipogenic genes co-occur together in patients with CRPC (including both PRAD and NEPC phenotypes) made available by cBioportal. C) Genetic and mRNA alterations of key lipogenic genes in patients with prostate adenocarcinoma (TCGA PRAD, provisional), made publicly available by cBioportal. D) Kaplan-Meier curve depicting overall survival between patients with no genetic alterations (blue line) and patients with genetic alterations (red line) in the key lipogenic proteins. Kaplan-Meier curve was generated via cBioportal. Abbreviations: CRPC = castrate recurrent prostate cancer, NE = neuroendocrine, Adeno = adenocarcinoma.

References

    1. Siegel RL, Miller KD, Jemal A. Cancer statistics, 2016. CA Cancer J Clin. 2016;66:7–30. - PubMed
    1. Gupta S, Li J, Kemeny G, Bitting RL, Beaver J, Somarelli J, Ware KE, Gregory S, Armstrong AJ. Whole genomic copy number alterations in circulating tumor cells from men with abiraterone or enzalutamide resistant metastatic castration-resistant prostate cancer. Clin Cancer Res. 2016 - PubMed
    1. Wong YN, Ferraldeschi R, Attard G, de Bono J. Evolution of androgen receptor targeted therapy for advanced prostate cancer. Nat Rev Clin Oncol. 2014;11:365–376. - PubMed
    1. Liu Y. Fatty acid oxidation is a dominant bioenergetic pathway in prostate cancer. Prostate Cancer Prostatic Dis. 2006;9:230–234. - PubMed
    1. Kroemer G, Pouyssegur J. Tumor cell metabolism: cancer’s Achilles’ heel. Cancer Cell. 2008;13:472–482. - PubMed

Publication types

MeSH terms