. 2017;39(1-4):107-123.
doi: 10.1159/000456658. Epub 2017 Mar 25.

Focal Brain Injury Associated with a Model of Severe Hypoxic-Ischemic Encephalopathy in Nonhuman Primates

Affiliations

Focal Brain Injury Associated with a Model of Severe Hypoxic-Ischemic Encephalopathy in Nonhuman Primates

Ryan M McAdams et al. Dev Neurosci. 2017.

Abstract

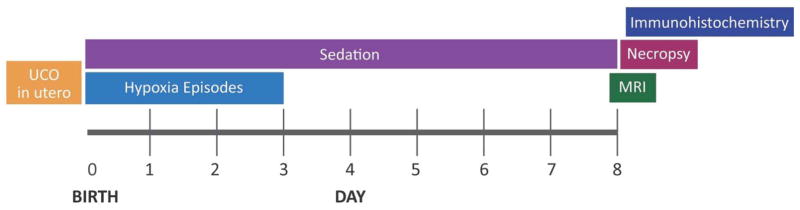
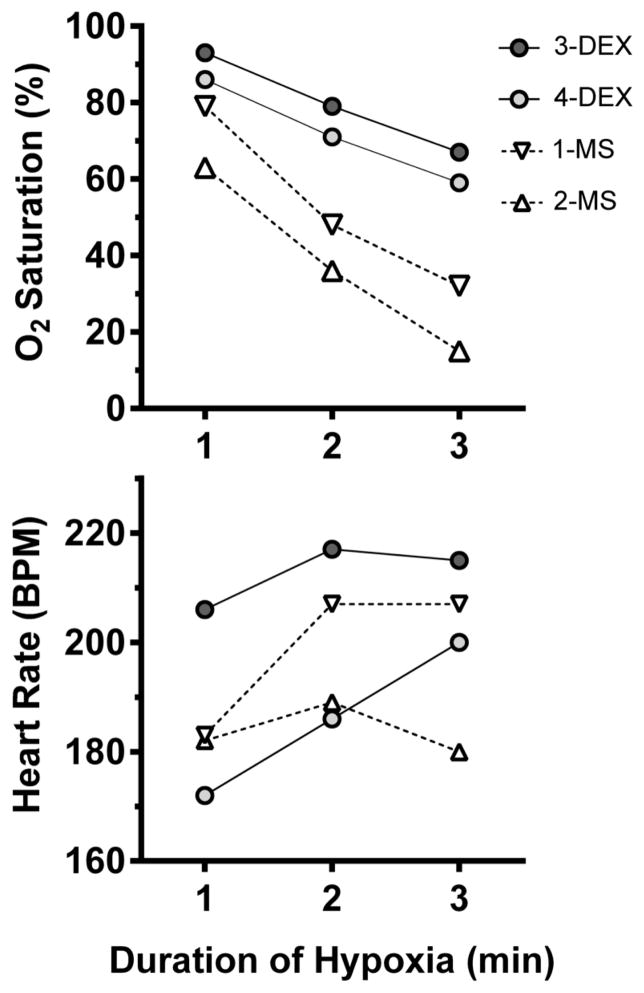
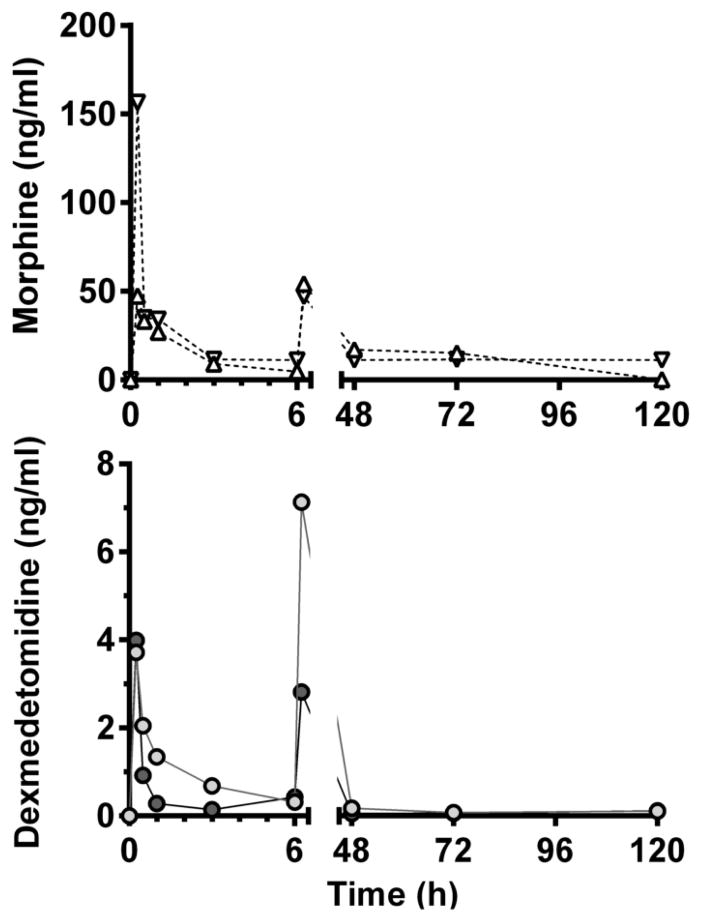
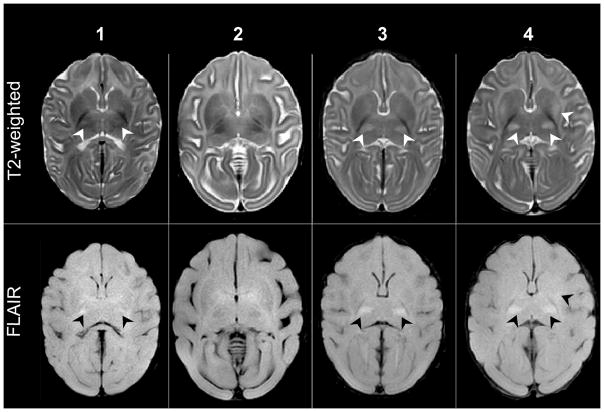
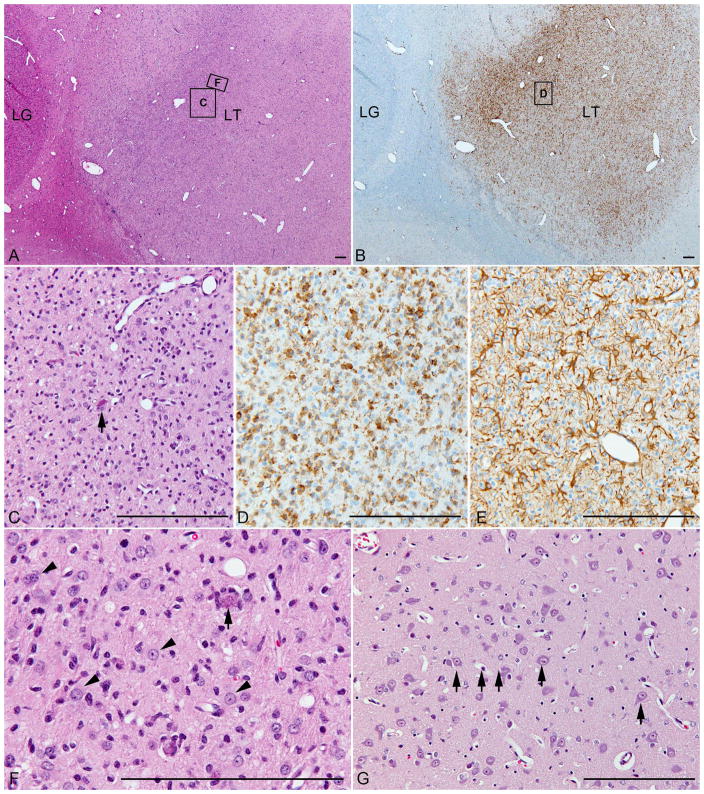
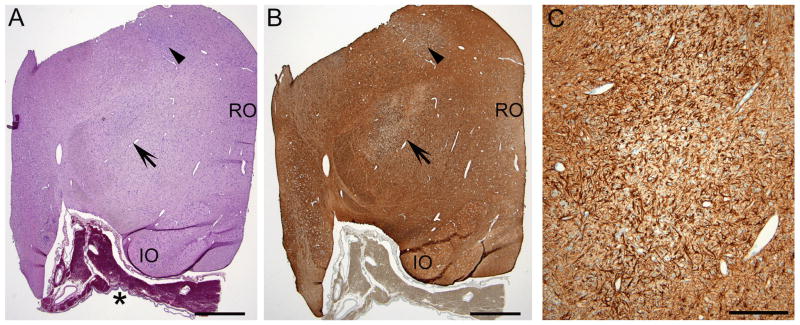
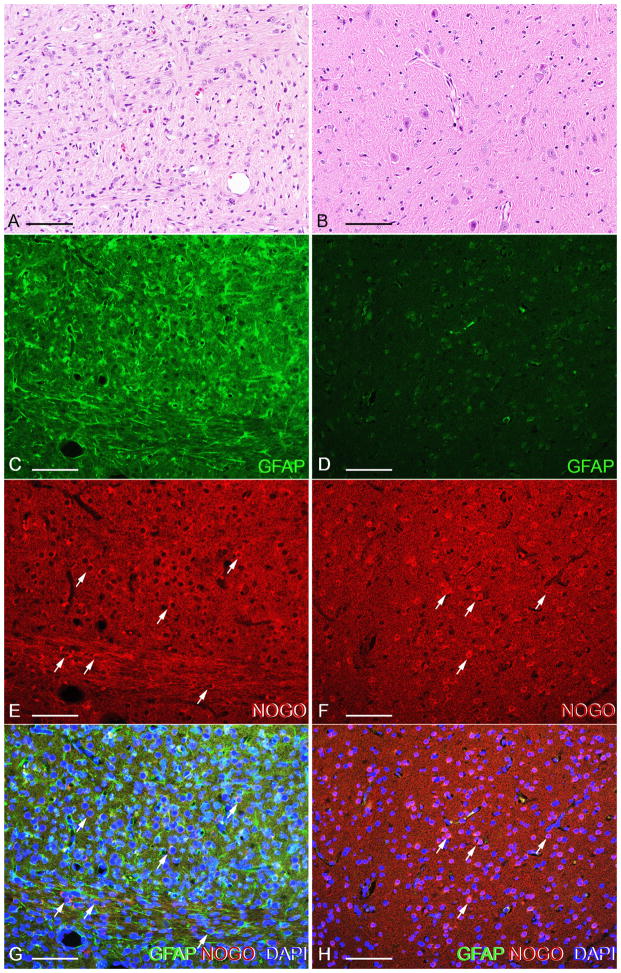
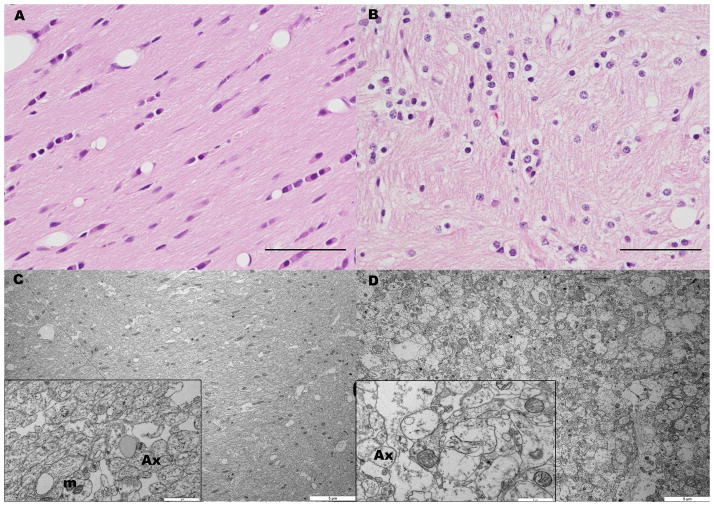
Worldwide, hypoxic-ischemic encephalopathy (HIE) is a major cause of neonatal mortality and morbidity. To better understand the mechanisms contributing to brain injury and improve outcomes in neonates with HIE, better preclinical animal models that mimic the clinical situation following birth asphyxia in term newborns are needed. In an effort to achieve this goal, we modified our nonhuman primate model of HIE induced by in utero umbilical cord occlusion (UCO) to include postnatal hypoxic episodes, in order to simulate apneic events in human neonates with HIE. We describe a cohort of 4 near-term fetal Macaca nemestrina that underwent 18 min of in utero UCO, followed by cesarean section delivery, resuscitation, and subsequent postnatal mechanical ventilation, with exposure to intermittent daily hypoxia (3 min, 8% O2 3-8 times daily for 3 days). After delivery, all animals demonstrated severe metabolic acidosis (pH 7 ± 0.12; mean ± SD) and low APGAR scores (<5 at 10 min of age). Three of 4 animals had both electrographic and clinical seizures. Serial blood samples were collected and plasma metabolites were determined by 2-dimensional gas chromatography coupled with time-of-flight mass spectrometry (GC × GC-TOFMS). The 4 UCO animals and a single nonasphyxiated animal (delivered by cesarean section but without exposure to UCO or prolonged sedation) underwent brain magnetic resonance imaging (MRI) on day 8 of life. Thalamic injury was present on MRI in 3 UCO animals, but not in the control animal. Following necropsy on day 8, brain histopathology revealed neuronal injury/loss and gliosis in portions of the ventrolateral thalamus in all 4 UCO, with 2 animals also demonstrating putamen/globus pallidus involvement. In addition, all 4 UCO animals demonstrated brain stem gliosis, with neuronal loss present in the midbrain, pons, and lateral medulla in 3 of 4 animals. Transmission electron microscopy imaging of the brain tissues was performed, which demonstrated ultrastructural white matter abnormalities, characterized by perinuclear vacuolation and axonal dilation, in 3 of 4 animals. Immunolabeling of Nogo-A, a negative regulator of neuronal growth, was not increased in the injured brains compared to 2 control animals. Using GC × GC-TOFMS, we identified metabolites previously recognized as potential biomarkers of perinatal asphyxia. The basal ganglia-thalamus-brain stem injury produced by UCO is consistent with the deep nuclear/brainstem injury pattern seen in human neonates after severe, abrupt hypoxic-ischemic insults. The UCO model permits timely detection of biomarkers associated with specific patterns of neonatal brain injury, and it may ultimately be useful for validating therapeutic strategies to treat neonatal HIE.

Keywords: Dexmedetomidine; Hypoxic-ischemic encephalopathy; Magnetic resonance imaging; Perinatal asphyxia.


Figures

Figure 1
Figure 1
An overview of the procedures and assessments for the nonhuman primate model of perinatal asphyxia. Animals received sedative infusions with either morphine (n=2) or dexmedetomidine (n=2) beginning at 6 h of age. Hypoxia episodes were induced during the first 3 days of age by exposing animals to 8% oxygen for 3 min to simulate apnea (range 6–21 episodes/animal). UCO = umbilical cord occlusion, MRI = Magnetic resonance imaging.
Figure 2
Figure 2
Plots show the time course of changes in oxygen saturation (top panel) and heart rate (bottom panel) recorded from individual animals (1–4) during exposure to 8% hypoxia to simulate apnea for 3 min. Data points are the average of all measurements for each animal from repeated exposures (range 6–21 episodes/animal) performed during the first 3 days of age. Animals 1 and 2 received a continuous morphine (MS) at 20 μg/kg/h and animals 3 and 4 received a continuous dexmedetomidine (DEX) infusion at 0.3 μg/kg/h.
Figure 3
Figure 3
Plots show the plasma concentrations of morphine (triangles, top panel) in animals 1 and 2 or dexmedetomidine (circles, bottom panel) in animals 3 and 4 measured from individual animals at scheduled intervals. Half-life (t1/2) and rate constant (κ) were calculated using data for the first 6 hours, after which time a second bolus was administered and continuous infusions were initiated (one phase decay, morphine: t1/2 = 7.5 min, κ = 5.5 ; DEX: t1/2 = 9.6 min, κ = 4.2). Dosing for morphine was 100 μg/kg bolus (at 1h and 6h) then 20 μg/kg/h after 6h, and for DEX was 2 μg/kg bolus (at 1h and 6h) then 0.3 μg/kg/h infusion after 6h.
Figure 4
Figure 4
MRI images recorded from four individual 8-day-old primates exposed to umbilical cord occlusion for 18 min plus postnatal mechanical ventilation and hypoxic episodes while under continuous sedation with either morphine or DEX. The numbers 1–4 on the top of each MRI image column indicate the animal number that corresponds to the T2-weighted and FLAIR images in each column. MRI T2-weighted and Fluid-attenuated inversion recovery (FLAIR) imaging revealed bilateral hyperintensity present in the posterior thalamus of 3 of the 4 animals (highlighted by arrows). In addition, animal 4 has evidence of unilateral hyperintensity in the putamen nucleus (the anterior arrow).
Figure 5
Figure 5
Histological and immunostained images from an infarct in the lateral thalamus (LT) of animal 4. (A) A geographic zone of hypercellularity is evident in the lateral thalamus (boxes indicate regions of higher magnifications displayed in C and F), just medial to the lateral geniculate nucleus (LG, H&E-stain). In this focus, neurons are lost or degenerating (arrows in C and F) and reactive astrocytes (arrowheads) abound. Adjacent sections demonstrate that the hypercellularity is due in part to infiltration by (B, with box indicating region of higher magnification displayed in D) CD163-immunoreactive activated microglia and (E) GFAP-immunopositive reactive astrocytes. (G) A histological field in the adjacent medial portion of the thalamus shows intact neurons (arrows) and a normal density of relatively inconspicuous non-reactive astrocytes and microglia. Scale bars are 200 μm.
Figure 6
Figure 6
Shown are hemisected sections of medulla taken from animal 3 and labeled for the raphe obscurus (RO) and the inferior olive (IO). A low power H&E stain (A) and GFAP immunostain (B) reveals the area of the focal scarring in the nucleus tractus solitarius (NTS, arrowhead) and the reticular formation (arrow). An asterisk (*) denotes the ventral subarachnoid hemorrhage. Panel C contains a higher magnification image depicting GFAP-immunopositive reactive astrocytes in the reticular formation derived from the region of the arrow tip in panel B. Scale bar length for panels A and B is 1mm, and panel C is 200 μm.
Figure 7
Figure 7
H&E (A,B) and dual immunofluorescence (C-H) images from the putamen of animal 4 (A,C,E,G) versus a control fetus (B,D,G,H). Marked hypercellularity is present in the putamen of the experimental animal due in part to accumulation of GFAP+ astrocytes (C). Nogo-A immunofluorescence highlights the perikarya of oligodendroglial cells (E,F), which are GFAP-negative and showed no consistent difference in density or intensity of immunoreactivity between experimental and control animals. Scale bars = 100 μm.
Figure 8
Figure 8
Light microscopic and ultrastructural images of white matter (cerebral white matter and corpus callosum) from asphyxiated non-human primates. Panels A (animal 1) and B (animal 3) present H&E-stained images (bar = 50 μm). In B, the architecture is more disorganized (although this appearance may be enhanced by somewhat cross sectional orientation in this image), with separation of axonal fibers and increased glial cell profiles. Panels C (animal 1) and D (animal 3) present transmission electron microscopic images (bar = 5 μm) magnification each with insets at 30,000x (bar = 1 μm). The insets highlight axons (Ax) to illustrate dilated axons in animal 3 (D) compared to animal 1 (C). Mitochondria are indicated (m). Animal 2 had similar TEM findings as animal 3 (images not shown).

Similar articles

Cited by

References

    1. Liu L, Johnson HL, Cousens S, Perin J, Scott S, Lawn JE, Rudan I, Campbell H, Cibulskis R, Li M, Mathers C, Black RE Child Health Epidemiology Reference Group of WHO Unicef. Global, regional, and national causes of child mortality: an updated systematic analysis for 2010 with time trends since 2000. Lancet. 2012;379:2151–2161. - PubMed
    1. Executive summary. Neonatal encephalopathy and neurologic outcome. American College of Obstetricians and Gynecologists. Obstetrics & Gynecology. 2014;123:896–901. - PubMed
    1. Takenouchi T, Kasdorf E, Engel M, Grunebaum A, Perlman JM. Changing pattern of perinatal brain injury in term infants in recent years. Pediatr Neurol. 2012;46:106–110. - PubMed
    1. Juul SE, Aylward E, Richards T, McPherson RJ, Kuratani J, Burbacher TM. Prenatal cord clamping in newborn Macaca nemestrina: a model of perinatal asphyxia. Dev Neurosci. 2007;29:311–320. - PubMed
    1. Shankaran S, Laptook AR, Ehrenkranz RA, Tyson JE, McDonald SA, Donovan EF, Fanaroff AA, Poole WK, Wright LL, Higgins RD, Finer NN, Carlo WA, Duara S, Oh W, Cotten CM, Stevenson DK, Stoll BJ, Lemons JA, Guillet R, Jobe AH National Institute of Child H, Human Development Neonatal Research N. Whole-body hypothermia for neonates with hypoxic-ischemic encephalopathy. N Engl J Med. 2005;353:1574–1584. - PubMed

Publication types