Review
. 2017 Jul;203(6-7):543-564.
doi: 10.1007/s00359-017-1165-9. Epub 2017 Mar 25.

Actogram analysis of free-flying migratory birds: new perspectives based on acceleration logging

Affiliations
Review

Actogram analysis of free-flying migratory birds: new perspectives based on acceleration logging

Johan Bäckman et al. J Comp Physiol A Neuroethol Sens Neural Behav Physiol. 2017 Jul.

Abstract

The use of accelerometers has become an important part of biologging techniques for large-sized birds with accelerometer data providing information about flight mode, wing-beat pattern, behaviour and energy expenditure. Such data show that birds using much energy-saving soaring/gliding flight like frigatebirds and swifts can stay airborne without landing for several months. Successful accelerometer studies have recently been conducted also for free-flying small songbirds during their entire annual cycle. Here we review the principles and possibilities for accelerometer studies in bird migration. We use the first annual actograms (for red-backed shrike Lanius collurio) to explore new analyses and insights that become possible with accelerometer data. Actogram data allow precise estimates of numbers of flights, flight durations as well as departure/landing times during the annual cycle. Annual and diurnal rhythms of migratory flights, as well as prolonged nocturnal flights across desert barriers are illustrated. The shifting balance between flight, rest and different intensities of activity throughout the year as revealed by actogram data can be used to analyse exertion levels during different phases of the life cycle. Accelerometer recording of the annual activity patterns of individual birds will open up a new dimension in bird migration research.

Keywords: Accelerometer; Activity; Annual cycle; Bird migration; Flight pattern.


Figures
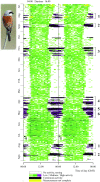
Fig. 1
Fig. 1
Actogram for an adult male red-backed shrike monitored form 15 July 2014 (top) until 27 Sep 2015 (bottom). Each horizontal line shows accelerometer data for two consecutive days, where the second day is repeated as the first day on the next line. Mean activity level was calculated for each hour ranging from 0 = no activity (white) to 5 = continuous activity (black) with intermediary levels in colour. Continuous and high activities (black and purple) refer to flight which occurred during night-time (with one case of prolonged flight into the succeeding day on 11 Sep 2015). Activity data were not complete (less than the expected sum of 12 activity scores per hour) during a few periods indicated in yellow. Numbers 16 refer to different travel segments along the annual loop migration cycle (Fig. 4; Table 1 show data for the first full year cycle, while the actogram also gives information about the two first travel segments during the succeeding year)
Fig. 2
Fig. 2
Schematic comparison of general activity patterns between the two red-backed shrikes that were recaptured in 2015 (Ind. A, lower) and 2016 (Ind. B, upper). Daily timing (hours UTC) of activities is plotted on the y-axis throughout the period of accelerometer measurements (x-axis). For detailed actograms see Bäckman et al. and Fig. 1. Green colours represent intermediate activity, black means very high (continuous flight) and white corresponds to no activity. The red bar in individual A indicates a 7-day period of missing data (Bäckman et al. 2016). The two individuals showed a high degree of general agreement in their actogram patterns, based on the accelerometer data, also demonstrated by a more detailed comparison of flight data in Fig. 3
Fig. 3
Fig. 3
a Comparison of cumulative flight hours in autumn migration versus date, 1 Aug–15 Dec, and b comparison of cumulative flight hours in spring migration versus date, 20 Mar–1 June between the two individuals of red-backed shrike with accelerometer data. Individual A (Bäckman et al. 2016) used 29 flights and 191 flight hours for autumn migration and 37 flights (maximum 44 flights due to missing data for seven nights) and 243–304 flight hours for spring migration. Corresponding data for individual B are given in Table 1. For bird A, broken line indicates the addition of 7 × 6.6 h of flight during the seven nights of missing data (provisional estimate from Bäckman et al. 2016). For bird B flight data are not only plotted for the first year of accelerometer recording but also during the two initial travel segments of its second annual cycle involving 22 nocturnal flights and 107 flight hours (actogram in Fig. 1)
Fig. 4
Fig. 4
Annual cycle of red-backed shrike based on accelerometer and geolocator data. Flight activity data have been extracted from accelerometer recordings, as shown in the actogram in Fig. 1 (the initial 365 days of records for this individual). Five main stationary periods and living areas are indicated by corresponding colours in the circular time diagram (number of days of stay are given for each period) and on the map. Bold numbers 16 refer to the six different travel segments as defined in Table 1, with black indicating days with nocturnal flights (max 20 in succession for travel segment 6; Table 1) and white to intervening stopover days with no nocturnal flights (max 4 in succession). The annual cycle diagram is oriented clockwise according to the annual solar cycle with summer solstice upwards (while the geographic loop migration pattern is anti-clockwise)
Fig. 5
Fig. 5
Daily timing of flights for six different travel segments during the annual cycle of a red-backed shrike based on accelerometer data (actogram in Fig. 1). Departure and landing times as well as estimated times of sunset and sunrise (nocturnal period shaded) are given in GMT (horizontal time axis from noon GMT to noon GMT the next day). Solar data were calculated from NOAA Solar Calculator (http://www.esrl.noaa.gov/gmd/grad/solcalc) for locations before and after each flight as estimated by interpolation (based on cumulative flight time) along each travel segment as defined in Table 1. Continuous flight is indicated by black lines (departure and landing times by blue and green dots, respectively), and interruptions, when the bird has landed to rest but departed again the same night, are indicated in white (five cases). a Flights from breeding area to SE Europe; b flights from SE Europe to Sahel; c flights from Sahel to S Africa; d flights from S Africa to NE Africa; e flights from NE Africa to Middle East; f flights from Middle East to breeding area (see definition of travel segments in Table 1)
Fig. 6
Fig. 6
Daily timing of flights associated with the crossing of the Mediterranean Sea and the Sahara desert during the autumn migration of two individuals of red-backed shrike, as indicated by accelerometer data. This travel segment is assumed to extend from SE Europe (44.0N, 20.0E) to Sahel (11.0N, 30.0N) based on geolocator information from these two individuals as well as other individuals in the population (Tøttrup et al. 2012a). Departure (blue dots) and landing times (green dots) as well as estimated times of sunset and sunrise (nocturnal period shaded) are given in GMT (horizontal time axis from noon GMT to noon GMT the next day). Solar data were calculated from NOAA Solar Calculator (http://www.esrl.noaa.gov/gmd/grad/solcalc) for locations before and after each flight as estimated by interpolation (based on cumulative flight time) along the travel segment. Continuous flight is indicated by black and red lines (red when the flight is prolonged beyond sunrise and into the following day). a Barrier crossing by the first individual (individual A) in autumn 2014 (Bäckman et al. 2016). The travel segment included one initial nocturnal flight (4.5 h on 1 Sep; cf. Bäckman et al. 2016) not shown in the figure. Total flight time for the travel segment was 67.8 h (7 flights). During this crossing there was a 3-day stopover period in the Sahara desert (11–13 Sep; cf. Bäckman et al. 2016). b Barrier crossing by the second individual (ind. B) in autumn 2014. Total flight time for the travel segment was 60.7 h (9 flights). c Barrier crossing by the second individual (ind. B) in autumn 2015. Total flight time for the travel segment was 62.2 h (9 flights)
Fig. 7
Fig. 7
Daytime activity scores during different periods and phases of the annual cycle of a red-backed shrike, based on accelerometer data. The histogram shows mean daily activity scores during 12 h (04–16 h GMT, always within daytime period; see actogram in Fig. 1) for five residence periods (with colours corresponding to those in the annual cycle diagram in Fig. 4) and for different travel segments with black referring to days with migratory flights during the preceding and/or succeeding night and white to stopover days without migratory flights during preceding/succeeding nights. Rectangular diagrams show the variation in hourly activity score during the 24 h of the day (from midnight to midnight on the time axis). Periods with migratory flights (black) show high activity levels extending above the diagram upper limits during the dark hours, reflecting nocturnal flights. Note that the mean activity scores in the histogram refer exclusively to the daytime period 04–16 h GMT. a Late breeding period 15 July–10 Aug 2014, 27 days. b Travel segment 1 from breeding area to SE Europe, days with preceding/succeeding flights 11–26 Aug, 14 days. c Residence period in SE Europe 27 Aug–8 Sep, 13 days. d Travel segment from SE Europe to Sahel, days with preceding/succeeding flights 9–18 Sep, 10 days. e Residence period in Sahel 19 Sep–13 Nov, 53 days. f Travel segment 3 from Sahel to S Africa, days with preceding/succeeding flights 14 Nov–7 Dec, 15 days. g Travel segment 3 from Sahel to S Africa, stopover days without preceding/succeeding flights 11–26 Aug, 6 days. h Residence period in S Africa 8 Dec–1 Apr, 115 days. i Travel segment 4 from S Africa to NE Africa, days with preceding/succeeding flights 2–26 Apr, 19 days. j Travel segment 4 from S Africa to NE Africa, stopover days without preceding/succeeding flights 6–14 Apr, 6 days. k Residence period in NE Africa 27 Apr–1 May, 5 days. l Travel segment 5 from NE Africa to Middle East, days with preceding/succeeding flights 2–9 May, 6 days. m Travel segment 6 from Middle East to breeding area, days with preceding/succeeding flights 9–30 May, 22 days. n Second breeding period 31 May–11 Aug, 73 days

Similar articles

Cited by

References

    1. Adamik P, Emmenegger T, Briedis M, Gustafsson L, Henshaw I, Krist M, Laaksonen T, Procházka P, Salewski V, Hahn S. Barrier crossing in small avian migrants: individual tracking reveals prolonged nocturnal flights into the day as a common migratory strategy. Sci Rep. 2016;6:21560. doi: 10.1038/srep21560. - DOI - PMC - PubMed
    1. Åkesson S, Klaassen RHG, Holmgren J, Fox JW, Hedenström A. Migration routes and strategies in a highly aerial migrant, the common swift Apus apus, revealed by light-level geolocators. PLoS ONE. 2012;7:e41195. doi: 10.1371/journal.pone.0041195. - DOI - PMC - PubMed
    1. Alerstam T. Bird migration speed. In: Berthold P, Gwinner E, Sonnenschein E, editors. Avian migration. Berlin: Springer; 2003. pp. 253–267.
    1. Alerstam T. Strategies for the transition to breeding in time-selected bird migration. Ardea. 2006;94:347–357.
    1. Alerstam T. Optimal bird migration revisited. J Ornithol. 2011;152(Suppl 1):S5–S23. doi: 10.1007/s10336-011-0694-1. - DOI

LinkOut - more resources