. 2017 Sep;222(7):3255-3266.
doi: 10.1007/s00429-017-1402-6. Epub 2017 Mar 25.

Uncovering specific changes in network wiring underlying the primate cerebrotype

Affiliations

Uncovering specific changes in network wiring underlying the primate cerebrotype

Salah Hamodeh et al. Brain Struct Funct. 2017 Sep.

Abstract

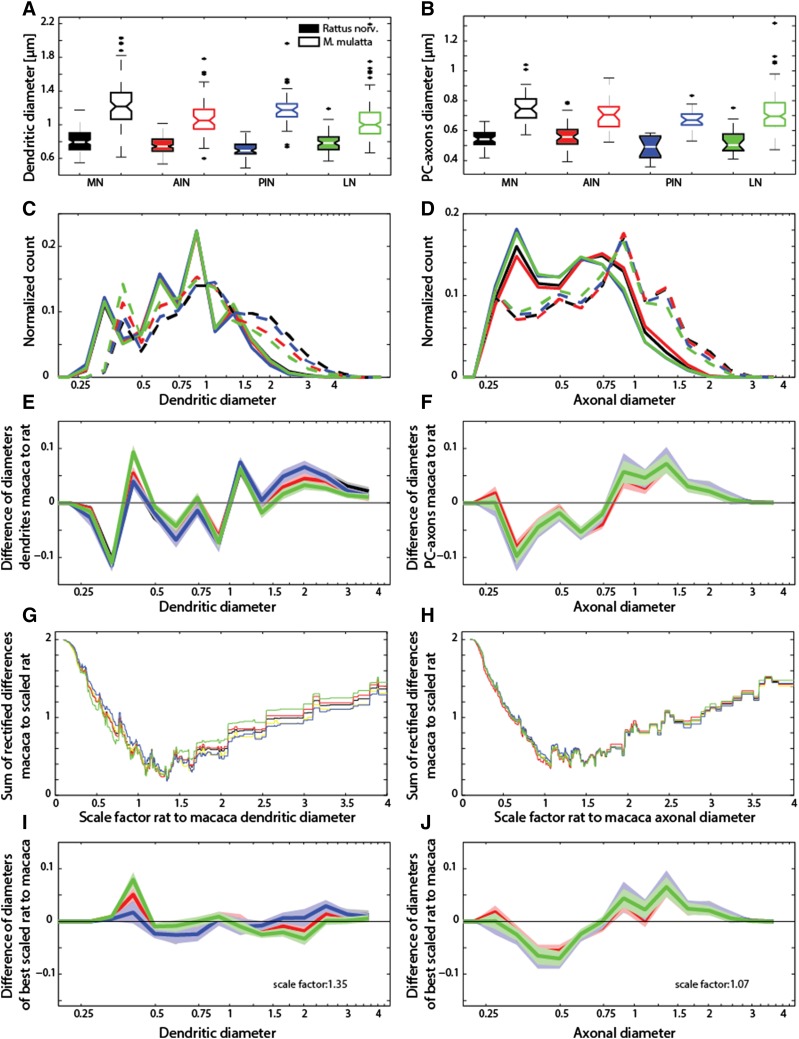
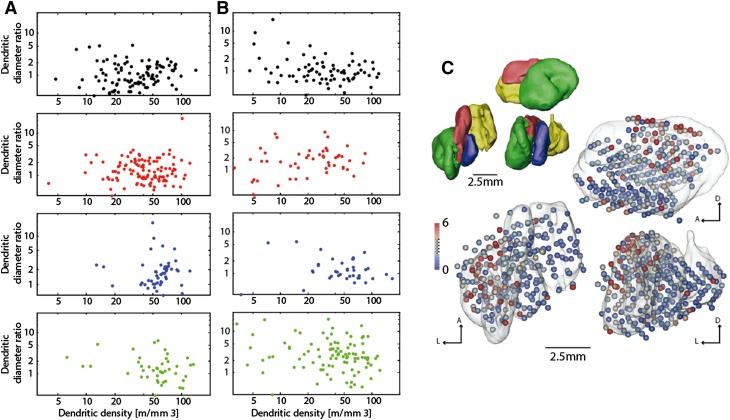
Regular scaling of brain networks during evolution has been proposed to be the major process leading to enlarged brains. Alternative views, however, suggest that deviations from regular scaling were crucial to the evolution of the primate brain and the emergence of different cerebrotypes. Here, we examined the scaling within the major link between the cerebellum and the cerebral cortex by studying the deep cerebellar nuclei (DCN). We compared the major axonal and dendritic wiring in the DCN of rodents and monkeys in search of regular scaling. We were able to confirm regular scaling within the density of neurons, the general dendritic length per neuron and the Purkinje cell axon length. However, we also observed specific modification of the scaling rules within the primates' largest and phylogenetically newest DCN, the dentate nucleus (LN/dentate). Our analysis shows a deviation from regular scaling in the predicted dendritic length per neuron in the LN/dentate. This reduction in the dendritic length is also associated with a smaller dendritic region-of-influence of these neurons. We also detected specific changes in the dendritic diameter distribution, supporting the theory that there is a shift in the neuronal population of the LN/dentate towards neurons that exhibit spatially restricted, clustered branching trees. The smaller dendritic fields would enable a larger number of network modules to be accommodated in the primate LN/dentate and would provide an explanation for the unique folded structure of the primate LN/dentate. Our results show that, in some brain regions, connectivity maximization (i.e., an increase of dendritic fields) is not the sole optimum and that increases in the number of network modules may be important for the emergence of a divergent primate cerebrotype.

Keywords: 3D reconstructions; Cerebellar nuclei; Comparative neuroanatomy; Dentate nucleus; Motor systems; Purkinje cells; Quantitative immunohistochemistry.


Conflict of interest statement

The authors declare that there are no conflicts of interest.

Figures

Fig. 1
Fig. 1
Comparison of the rat and macaque DCN. a Composite overviews of fluorescent MAP2 immunohistochemistry of the rat (upper; coronal section) and rhesus monkey (lower; horizontal section) DCN. Surface reconstructions of the rat (upper) and macaque (lower) DCN are also shown. The surfaces are color coded for the different DCN: MN, yellow; AIN, red; PIN, blue and LN/dentate, green. Scale bars correspond to 1 mm. b Examples of MAP2 and PCP2 stains acquired with the laser confocal microscope. Black and white images are maximal intensity projections through a stack of slices. Magenta and green images show the outcome of the automatic fiber and diameter reconstruction (Magenta) overlaid on the maximal intensity projection (green). The view axis was tilted slightly sideways to enable observation of the underlying maximal intensity projection. Upper two rows are MAP2 stains, while the lower two rows are PCP2. Left two columns are images from the rat and 1st and 3rd rows are from the AIN, while 2nd and 4th are from the LN/dentate. MAP2-stained somata were manually removed (marked with asterisks) from the reconstruction outcome. (Plus) marks lipofuscin that was also removed manually. Arrow mark subthreshold fibers and arrow heads mark other structures that the reconstruction algorithm failed to recognized. Scale bar for the upper two rows is 25 and 15 µm for the lower two rows. c Counts of neurons in rats (n = 4) and macaques (n = 2) with the optical fractionator method yielded highly significant different densities between the two species. A two-way ANOVA showed significant differences on the species level, but not on the subnuclei level (F value 28.3, df = 1, p < 0.0001 vs. F value 0.25, df = 3, p > 0.86). d Double logarithmic plot of the dependence of cerebellar neuron density on tissue volume. DCN (red) neurons show a density drop in larger brains comparable to that observed in Purkinje cells (blue). Regression fits showed similar results in DCN neurons and Purkinje cells (DCN: y = −0.38046 (±0.084) × + 3.3401; r 2  = 0.91, p < 0.05; Purkinje cells: y = −0.3718 (±0.053) × + 2.8728; r 2  = −0.86, p < 0.001). Arrays of black lines are also plotted for a comparison with a slope of −1/3. The data for cerebellar granule cells (square, black) which do not show a drop in density in larger brains: (y = 0.073435 (±0.027) × + 6.303; r 2  = 0.71, p = 0.072666) are also plotted. Sources of additional neuron densities are listed in “Material and methods”. e, f Quantification of fibers labeled with MAP2 (dendrites, E) and PCP2 (Purkinje cell axons: PCax, F) showed higher values for the axons. In contrast to the neuron densities, DCN classification now had an additional significant effect, thus explaining the variability of the dendrites (two-factorial ANOVA with F values 14.5 vs. 19.9, df = 1 vs. df = 4 and p < 10−5 vs. p < 10−11 for the factors DCN class vs. species origin) and the PCax (two-factorial ANOVA yielded F values 57.6 vs. 5.1 and p = 10−37 vs. p ≤.024 for the factors DCN class vs. species origin) in our probes. The average dendritic and PCax length densities were generally lower in the phylogenetically older DCN (i.e., the MN and the AIN), thereby contributing to the variability in the probes. g Comparison of the dendritic length per neuron for different subnuclei and for the two species. Dendritic length densities were normalized by neuron densities for each DCN to obtain the dendritic length per neuron. Predictions for the monkey were derived by multiplying the values obtained from the rat with the factor of volume increase to the power of 1/3 obtained from the different subnuclei. Error bars for the rat and monkey show the 95% confidence region obtained from the ratios of the two measured parameters (e.g., dendritic length density and neuron density). The prediction for the MN and PIN were well within the CI. The AIN prediction was somewhat higher than the CI of the monkey values. By contrast, the prediction for the LN/dentate was well above that of the CI established by our probes (only 4.8 vs. a prediction of 9.7 mm). h Comparison of the diameter of region-of-influence (dROI) obtained for rat and monkey dendritic trees. Rat_intra denotes dROI diameters obtained from 3D-reconstructed intracellularly filled neurons (n = 35) and refers to the diameters we obtain when 2D images of those neurons are analyzed by taking the area from the boundary spanned by the outer tips of the dendrites. Rat_golgi denotes diameters obtained with the same approach, but from Golgi-stained neurons (n = 27 for the rats; n = 54 for the monkey). The difference between rat and monkey (Mac_Golgi) was not significant (mean of 227 µm compared to 196 µm, respectively and t test p = 0.059). Inlet to the left intracellularly stained neuron from the rat. Inlet to the right neurons showing a small dROI with clustered dendrites from the monkey’s LN/dentate. Scale bar corresponds to 100 µm for the left and 50 µm for the right neuron
Fig. 2
Fig. 2
Fiber diameter in different DCN subnuclei compared to predictions. a Monkey DCN dendrites exhibited larger diameters than rats. The thickest dendrites were measured within the monkey MN. The largest difference was observed within the PIN (factor of 1.7 between monkey and rats), with 1.19 µm (sd = 0.22) in monkeys compared to 0.7 µm in rats (sd = 0.08). The second largest difference was observed in the MN, (×1.5), with 1.25 µm (sd = 0.3) in monkeys compared to 0.81 µm in rats (sd = 0.14). The LN/dentate showed the smallest difference (1.3), with 1 µm (sd = 0.23) in monkeys compared to 0.79 µm in rats (sd = 0.12). Statistical analysis with a two way-factorial ANOVA showed that both the influence of the species (F = 511; p < 0.0001), and the origin of the probes from the different subnuclei (F = 8.76; p < 0.0001) were highly significant. b As in the dendritic diameters, differences were also observed in the PC axons between the two species. Again, the MN showed the largest increase from 0.54 to 0.75 µm. The differences were statistically significant (two-way ANOVA yielded F = 201.9, p < 10–36 for species vs. F = 8.5; p < 10–6 nucleus). c, d Histograms showing diameter distribution for the dendrites (c) and PCax (d) for different nuclei (color coded) and for the rats (continuous line) and monkey (dashed line). The dendritic diameters (C) of the monkey are shifted to larger diameters. Within the rats, the different DCN are indistinguishable from each other. By contrast, larger differences between the DCN are found in the monkey: the LN/dentate has more of the smaller diameter dendrites (~0.4 μm) and fewer thick dendrites (>1.5 μm). A similar, but smaller pattern is observed in the AIN. Histograms were normalized by the sum of all diameter counts for the respective species and subnucleus. Fiber diameters are plotted as natural logarithms. e Difference calculation between the rhesus monkey and rat dendritic histograms (c) for each DCN. The difference calculation is plotted together with the 99% CI (lighter shaded color). The curves overlie each other and are within their CI up to a diameter of 0.4 µm, at which point the monkey dendritic histogram for the LN/dentate exceeds the others. f Difference calculation between the rhesus monkey and rat PCax histograms (d) for each DCN. As in e, the difference calculation is plotted together with the 99% CI. g, h Sum of the rectified difference curves obtained for different scaling factors. The rat fiber diameters were multiplied with varying scaling factors (scaling factors plotted on the abscissa) and then subtracted from the primate data. The difference was rectified and summed and plotted on the ordinate axis (g dendrites and h PCax). i, j Results for best scaling factors (i dendrites and j PCax). In the case of the dendrites, a scale factor of 1.35 yielded optimal scaling. A wide range of values (1–1.5) yielded similar results in the case of the PCax, i.e., with little difference between the DCN. The optimal dendritic scaling factor, however, also showed an excess of thin dendrites mainly for the monkey LN/dentate and the number of dendritic diameters around 2 µm was lower than predicted. Color code for DCN: MN: black; PIN: blue; AIN: red; NL/dentate: green
Fig. 3
Fig. 3
Dendritic diameter ratio. a, b Double logarithmic plot of dendritic diameter ratio vs. dendritic length density for the rat (a) and the rhesus monkey (b). The four vertical subplots are the data for the MN (black), AIN (red), PIN (blue) and the LN/dentate (green). The diameter ratio was taken between thin diameters (rat: 0.35; monkey: 0.41 µm) and the thick diameters (rat: 1.35; monkey: 2 µm). The PIN and LN generally showed higher dendritic length densities on average. In the primate LN/dentate, a larger number of probes showed a higher dendritic diameter ratios than in the rat (b, lower panel). An ANOVA test showed significant effect of species and DCN classification for the dendritic diameter ratio (F-stat 6.79, DF = 1, p < 0.01 and F-stat: 8.68, DF = 4, p < 0.0001 for species and DCN classification, respectively). A post hoc test ascertained that the primate LN/dentate had a significantly higher diameter ratio than the other subnuclei (post hoc hsd test comparing monkey LN to AIN: p < 0.01; LN to NM: p < 0.0001; LN/ dentate to PIN: p < 0.0005). c Surface models of the rhesus monkey DCN and the dendritic diameter ratio. The upper left models are surface renditions with the different subnuclei color coded: MN (yellow), AIN (red), PIN (blue) and the LN/dentate (green). The left shows the view from dorsal, the upper right from lateral, and the lower right from posterior. The same views are shown again in the larger 3D model version with transparent DCN surfaces. In addition, we plotted the distal–proximal dendritic diameter ratio as the proportion of 0.41-µm diameters divided by the proportion of 2-µm diameters color coded on small spheres, with red for larger ratios (more small diameters) and blue colors for lower ratios (larger thicker diameters)

Similar articles

Cited by

References

    1. Abeles M. Corticonics: neural circuits of the cerebral cortex. Cambridge: Cambridge University Press; 1991.
    1. Aizenman CD, Linden DJ. Regulation of the rebound depolarization and spontaneous firing patterns of deep nuclear neurons in slices of rat cerebellum. J Neurophysiol. 1999;82:1697–1709. - PubMed
    1. Andersen BB, Korbo L, Pakkenberg B. A quantitative study of the human cerebellum with unbiased stereological techniques. J Comp Neurol. 1992;326:549–560. doi: 10.1002/cne.903260405. - DOI - PubMed
    1. Andersen BB, Gundersen HJ, Pakkenberg B. Aging of the human cerebellum: a stereological study. J Comp Neurol. 2003;466:356–365. doi: 10.1002/cne.10884. - DOI - PubMed
    1. Azevedo FA, Carvalho LR, Grinberg LT, Farfel JM, Ferretti RE, Leite RE, Jacob FW, Lent R, Herculano-Houzel S. Equal numbers of neuronal and nonneuronal cells make the human brain an isometrically scaled-up primate brain. J Comp Neurol. 2009;513:532–541. doi: 10.1002/cne.21974. - DOI - PubMed

MeSH terms

Substances

LinkOut - more resources