. 2017 Jun;60(6):1043-1050.
doi: 10.1007/s00125-017-4242-2. Epub 2017 Mar 25.

Pancreatic alpha cell-selective deletion of Tcf7l2 impairs glucagon secretion and counter-regulatory responses to hypoglycaemia in mice

Affiliations

Pancreatic alpha cell-selective deletion of Tcf7l2 impairs glucagon secretion and counter-regulatory responses to hypoglycaemia in mice

Gabriela da Silva Xavier et al. Diabetologia. 2017 Jun.

Abstract

Aims/hypothesis: Transcription factor 7-like 2 (TCF7L2) is a high mobility group (HMG) box-containing transcription factor and downstream effector of the Wnt signalling pathway. SNPs in the TCF7L2 gene have previously been associated with an increased risk of type 2 diabetes in genome-wide association studies. In animal studies, loss of Tcf7l2 function is associated with defective islet beta cell function and survival. Here, we explore the role of TCF7L2 in the control of the counter-regulatory response to hypoglycaemia by generating mice with selective deletion of the Tcf7l2 gene in pancreatic alpha cells.

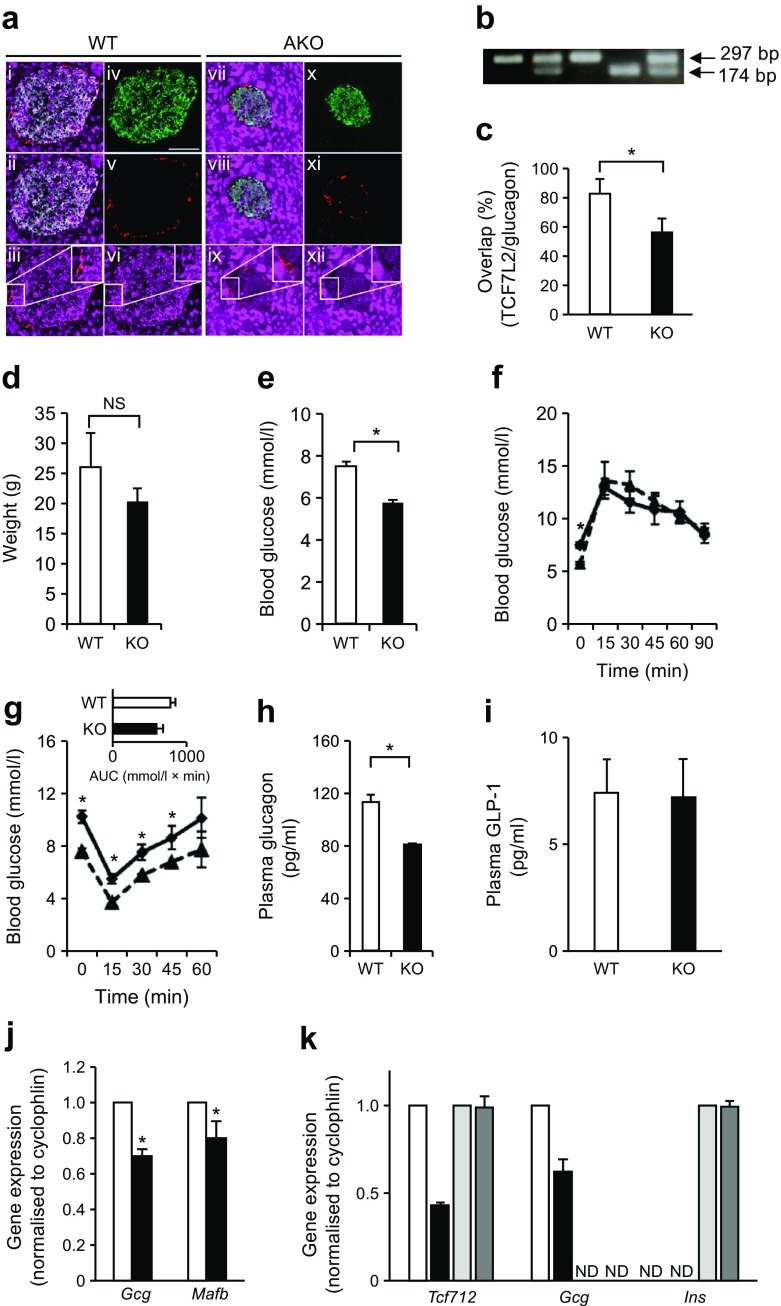
Methods: Alpha cell-selective deletion of Tcf7l2 was achieved by crossing mice with floxed Tcf7l2 alleles to mice bearing a Cre recombinase transgene driven by the preproglucagon promoter (PPGCre), resulting in Tcf7l2AKO mice. Glucose homeostasis and hormone secretion in vivo and in vitro, and islet cell mass were measured using standard techniques.

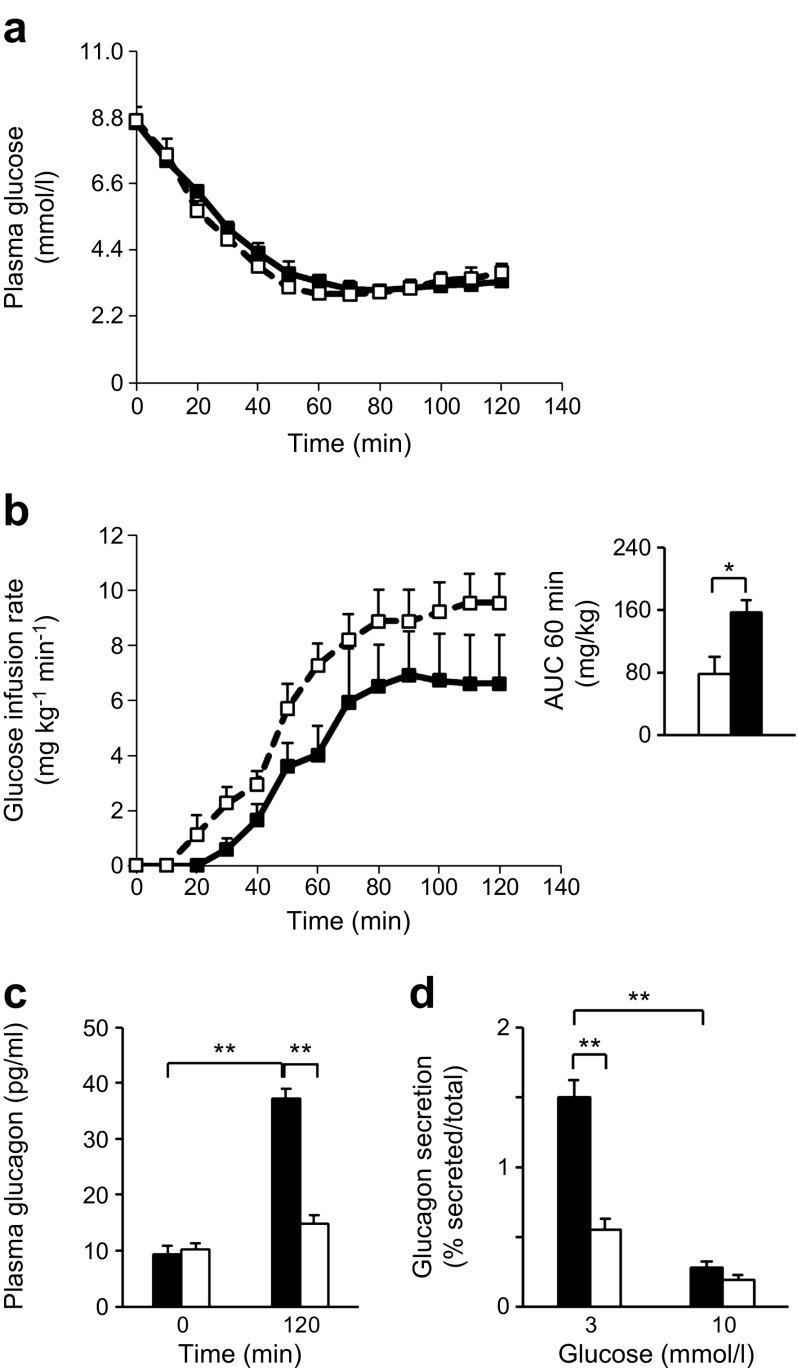
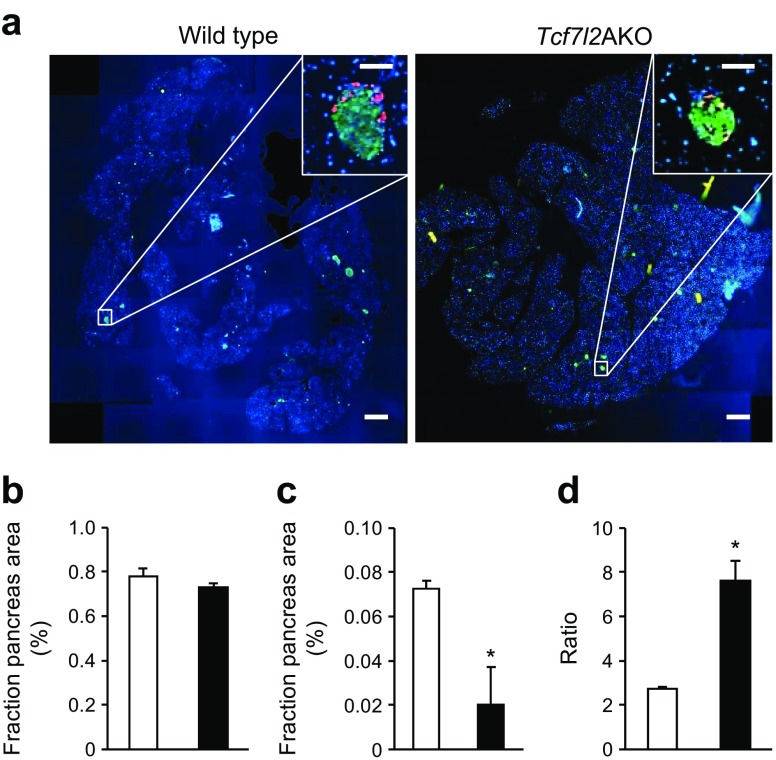
Results: While glucose tolerance was unaffected in Tcf7l2AKO mice, glucose infusion rates were increased (AUC for glucose during the first 60 min period of hyperinsulinaemic-hypoglycaemic clamp test was increased by 1.98 ± 0.26-fold [p < 0.05; n = 6] in Tcf7l2AKO mice vs wild-type mice) and glucagon secretion tended to be lower (plasma glucagon: 0.40 ± 0.03-fold vs wild-type littermate controls [p < 0.01; n = 6]). Tcf7l2AKO mice displayed reduced fasted plasma glucose concentration. Glucagon release at low glucose was impaired in islets isolated from Tcf7l2AKO mice (0.37 ± 0.02-fold vs islets from wild-type littermate control mice [p < 0.01; n = 6). Alpha cell mass was also reduced (72.3 ± 20.3% [p < 0.05; n = 7) in Tcf7l2AKO mice compared with wild-type mice.

Conclusions/interpretation: The present findings demonstrate an alpha cell-autonomous role for Tcf7l2 in the control of pancreatic glucagon secretion and the maintenance of alpha cell mass and function.

Keywords: Alpha cell; Diabetes; GWAS; Gene; Glucagon; Islet.


Conflict of interest statement

Data availability

Data are available on request from the authors.

Funding

GdSX thanks Diabetes UK (BDA 13/0004672), EFSD-MSD and Rosetrees Trust for Project grants. This work was funded by grants to GAR from Diabetes UK (Project BDA 11/0004210), the Wellcome Trust (Programme 081958/Z/07/Z; Senior Investigator Award WT098424AIA), and the MRC (UK; Project GO401641; Programme MR/J0003042/1). The work leading to this publication also received support from the Innovative Medicines Initiative Joint Undertaking under grant agreement no. 155005 (IMIDIA) (GAR, CM, PLH), resources of which are composed of a financial contribution from the European Union’s Seventh Framework Programme (FP7/2007–2013) and EFPIA companies’ in kind contribution.

Duality of interest

The authors declare that there is no duality of interest associated with this manuscript.

Contribution statement

GdSX and GAR conceived and designed the studies and co-wrote the article. PLH provided PPGCre mice, advice and help in the generation of the Tcf7l2AKO mice and interpretation of the data. AM and GdSX designed, generated, genotyped and characterised the conditional knockout mice, and contributed to the interpretation of the data. AM, VM and GdSX performed immunohistochemical analysis and analysed the data. CM, JD and CC-G performed hypoglycaemic clamps and analysed and interpreted the data. All authors revised the article critically for important intellectual content and approved the final version to be published. GdSX is responsible for the integrity of the work as a whole.

Figures

Fig. 1
Fig. 1
Tcf7l2AKO mice display reduced blood glucose, insulin intolerance and plasma glucagon concentration. Tcf7l2 was knocked out using an alpha cell-selective Cre [36]. (a) Representative images of immunohistochemical analysis are shown to confirm knockout by labelling pancreases from wild-type (WT; panels i–vi) and Tcf7l2AKO (panels vii–xii) mice with anti-glucagon (red), anti-insulin (green) and anti-TCF7L2 (magenta) antibodies. Images i and vii show overlay of all three channels, ii and viii show overlay of insulin with TCF7L2, iii and ix show overlay of glucagon with TCF7L2, and iv–vi and x–xii show the individual channels. Inset panels show magnified images of the indicated areas. Scale bar, 50 μm and applies to all micrographs in part (a). (b) PCR genotyping gel to confirm the presence of the wild-type (WT; 174 bp) and conditional knockout (AKO; 297 bp) allele. (c) Graph showing quantification of the degree of overlap between glucagon-positive alpha cells and TCF7L2-positive cells in pancreases from WT and Tcf7l2AKO mice. (d) Tcf7l2AKO mice exhibit normal weight. (eg) i.p. glucose and insulin tolerance tests were conducted on 8–9-week-old mice on a normal chow diet. (e) Fasting glucose but not (f) overall glucose tolerance was altered in Tcf7l2AKO mice compared with WT mice. (g) Insulin tolerance, (h) fasting (16 h) plasma glucagon and (i) plasma GLP-1 were also measured in Tcf7l2AKO mice. (j) Real-time PCR analysis of islets of Langerhans from 20-week-old Tcf7l2AKO mice and WT littermate control mice on normal chow diet. (k) Real-time quantitative PCR analysis of cells captured by laser microdissection for measurements of the indicated genes. In (a–j): white bars and solid lines, WT mice; black bars and dashed lines, Tcf7l2AKO mice. In (k): white bars, glucagon-positive cells from WT mice; black bars, glucagon-positive cells from Tcf7l2AKO mice; light grey bars, insulin-positive cells from WT mice; dark grey bars, insulin-positive cells from Tcf7l2AKO mice. For (ai), n = 5; for (j) and (k), n = 3. ND, non-detectable (i.e. Gcg and Ins expression was undetectable in insulin- and glucagon-positive cells, respectively), NS, non-significant. *p < 0.05
Fig. 2
Fig. 2
Tcf7l2AKO mice display impaired counter-regulatory response to hypoglycaemia. (a) Plasma glucose concentration and (b) glucose infusion rates for hyperinsulinaemic–hypoglycaemic clamp tests in 20-week-old wild-type (solid line/black squares and black bars) and Tcf7l2AKO (dashed lines/white squares and white bars) mice. Insulin was infused at time 0 min; inset in (b) shows AUC for glucose infusion rates. (c) Plasma glucagon levels in mice undergoing hyperinsulinaemic–hypoglycaemic clamp tests at 0 and 120 min of the glucose infusion protocol. (d) Levels of glucagon secretion from isolated islets of Langerhans exposed to glucose at the indicated concentrations. Black bars, wild-type mice; white bars, Tcf7l2AKO mice. n = 6 mice for all;*p < 0.05 and **p < 0.01
Fig. 3
Fig. 3
Tcf7l2AKO mice display reduced alpha cell mass. (a) Representative images from pancreatic sections from wild-type and Tcf7l2AKO mice are shown. Scale bar in large micrographs, 500 μm; scale bar in insets, 100 μm. (b) Beta cell (defined as insulin-positive cells, in green) and (c) alpha cell (defined as glucagon-positive cells, in red) mass, and (d) beta/alpha cell ratio from 20-week-old mice were quantified [44]. White bars, wild-type mice; black bars, Tcf7l2AKO mice. n = 7 mice for all; *p < 0.05

Similar articles

Cited by

References

    1. Marullo L, El-Sayed Moustafa JS, Prokopenko I. Insights into the genetic susceptibility to type 2 diabetes from genome-wide association studies of glycaemic traits. Curr Diab Rep. 2014;14:551. doi: 10.1007/s11892-014-0551-8. - DOI - PubMed
    1. Rutter GA. Dorothy Hodgkin lecture 2014. Understanding genes identified by genome-wide association studies for type 2 diabetes. Diabet Med. 2014;31:1480–1487. doi: 10.1111/dme.12579. - DOI - PubMed
    1. Scott LJ, Mohlke KL, Bonnycastle LL, et al. A genome-wide association study of type 2 diabetes in Finns detects multiple susceptibility variants. Science. 2007;316:1341–1345. doi: 10.1126/science.1142382. - DOI - PMC - PubMed
    1. Grant SF, Thorleifsson G, Reynisdottir I, et al. Variant of transcription factor 7-like 2 (TCF7L2) gene confers risk of type 2 diabetes. Nat Genet. 2006;38:320–323. doi: 10.1038/ng1732. - DOI - PubMed
    1. Zeggini E, Weedon MN, Lindgren CM, et al. Replication of genome-wide association signals in UK samples reveals risk loci for type 2 diabetes. Science. 2007;316:1336–1341. doi: 10.1126/science.1142364. - DOI - PMC - PubMed

Publication types