. 2017 Jun 1;20(6):874-890.e7.
doi: 10.1016/j.stem.2017.02.014. Epub 2017 Mar 23.

Comprehensive Cell Surface Protein Profiling Identifies Specific Markers of Human Naive and Primed Pluripotent States

Affiliations

Comprehensive Cell Surface Protein Profiling Identifies Specific Markers of Human Naive and Primed Pluripotent States

Amanda J Collier et al. Cell Stem Cell. .

Abstract

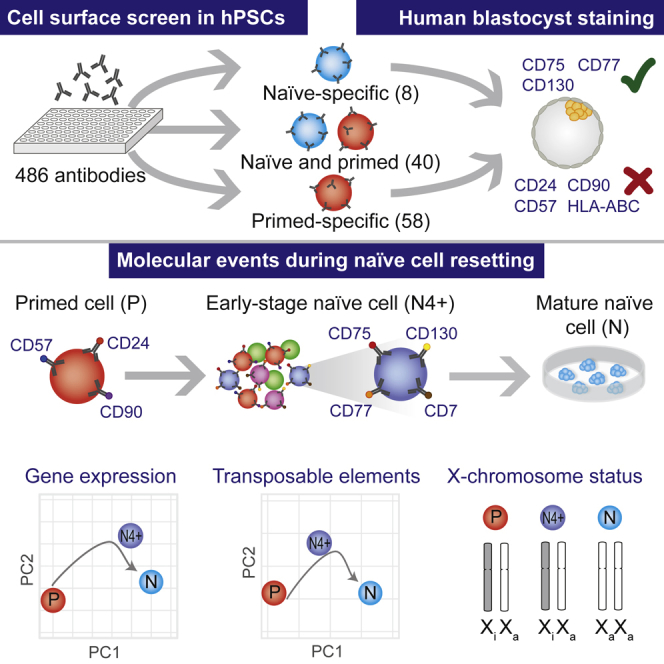
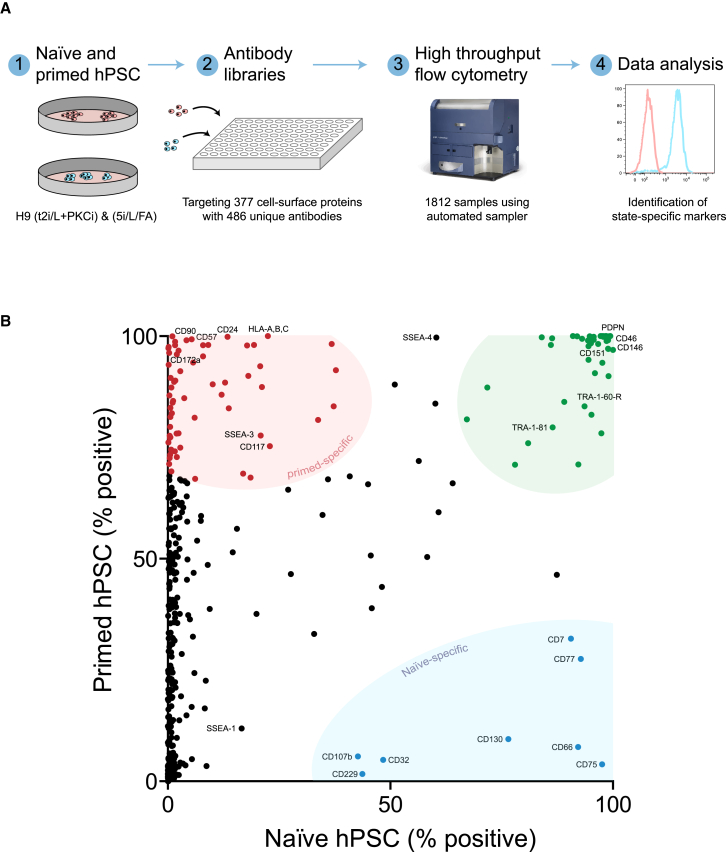
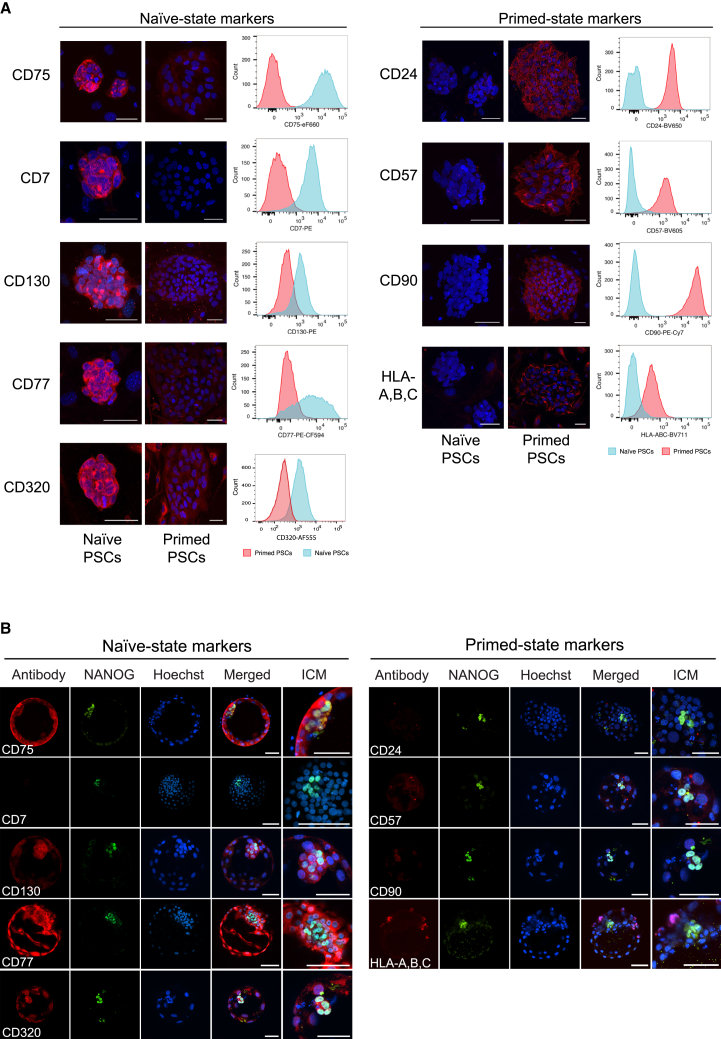
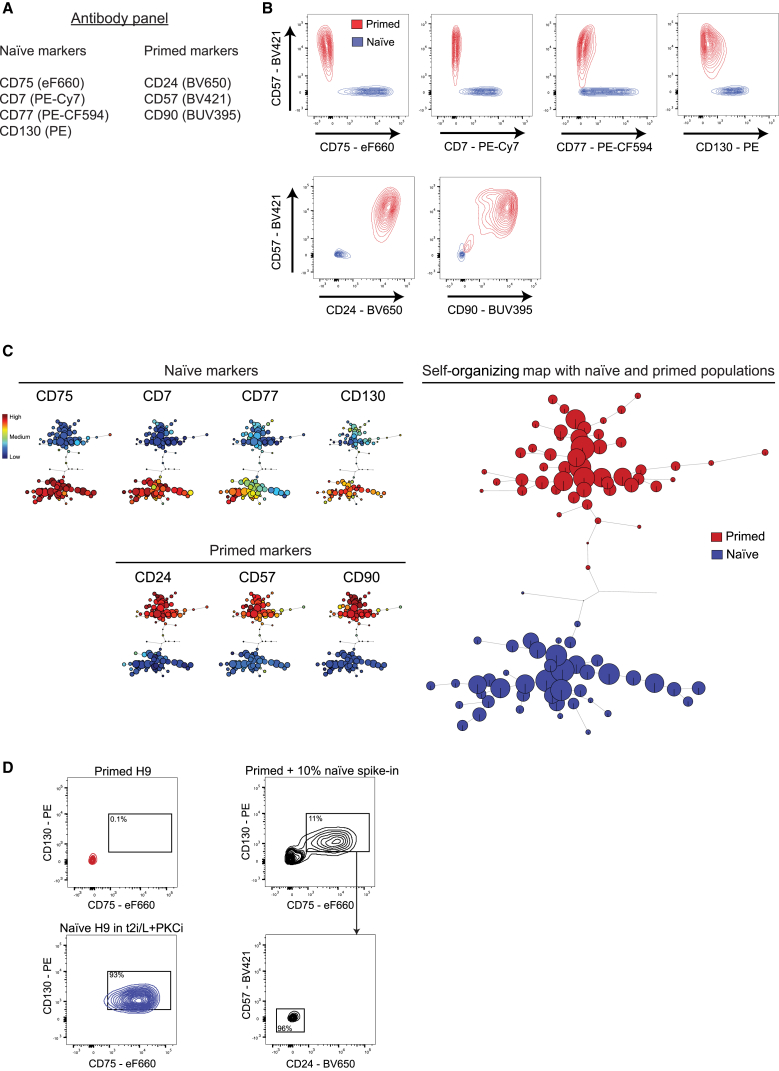
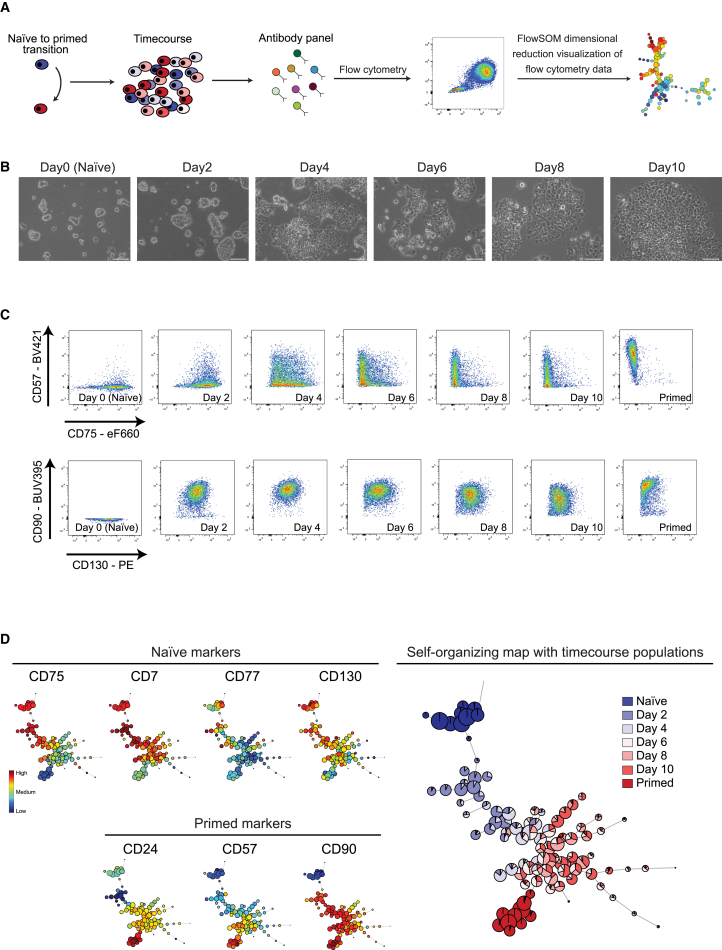
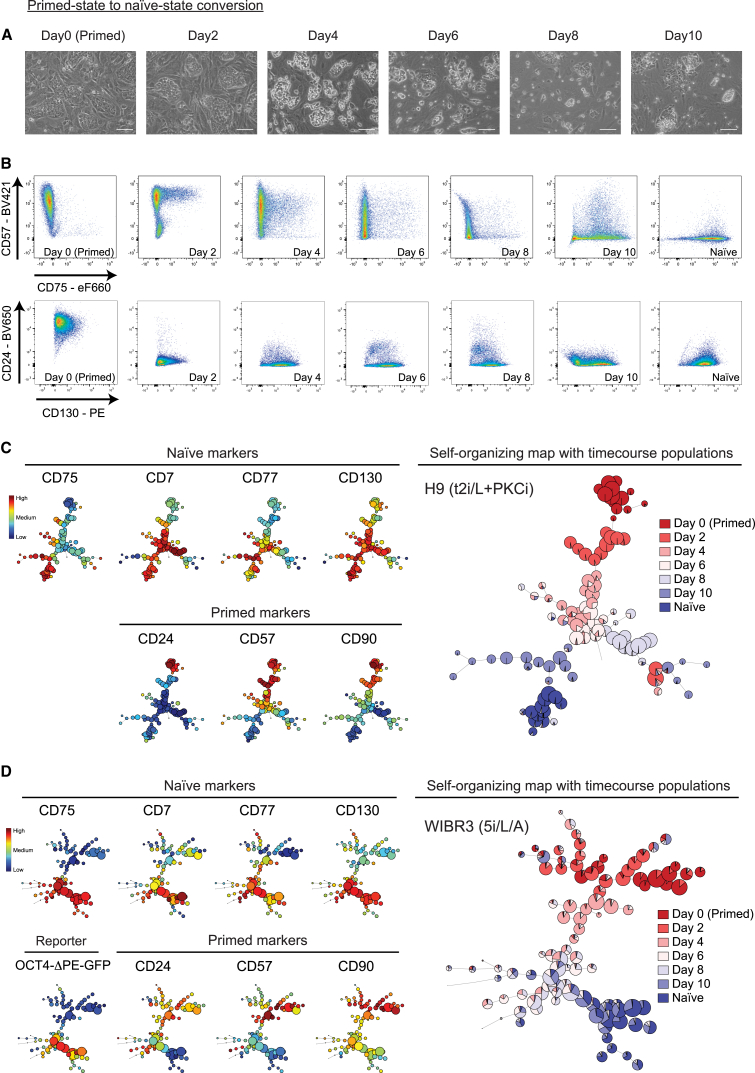
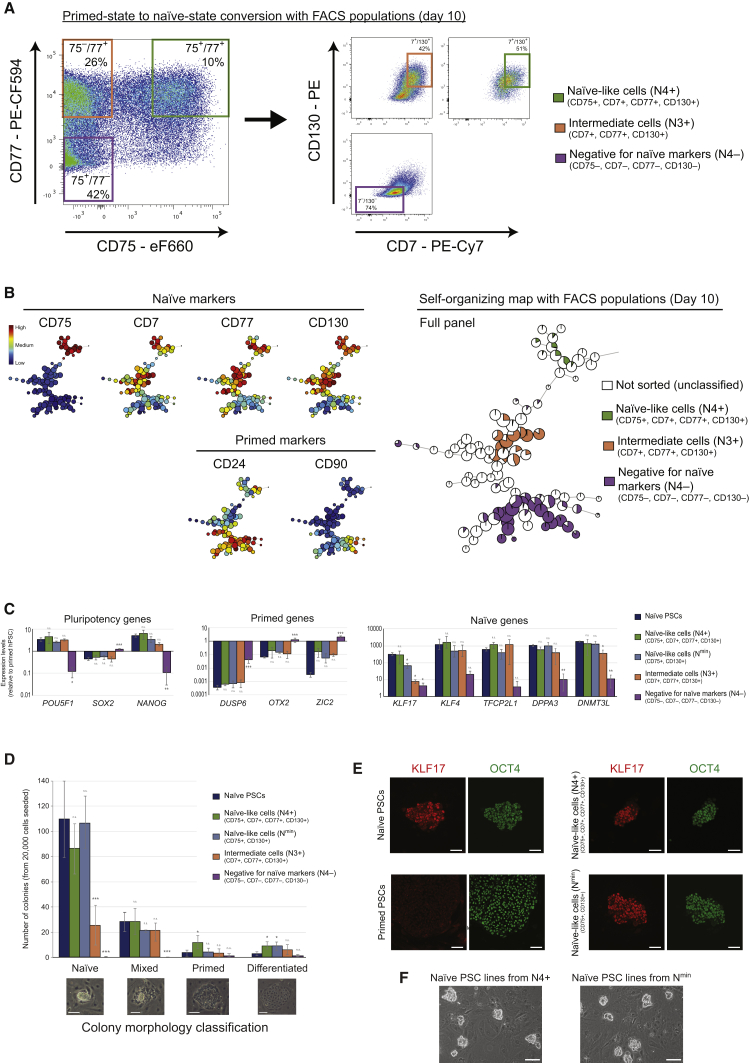
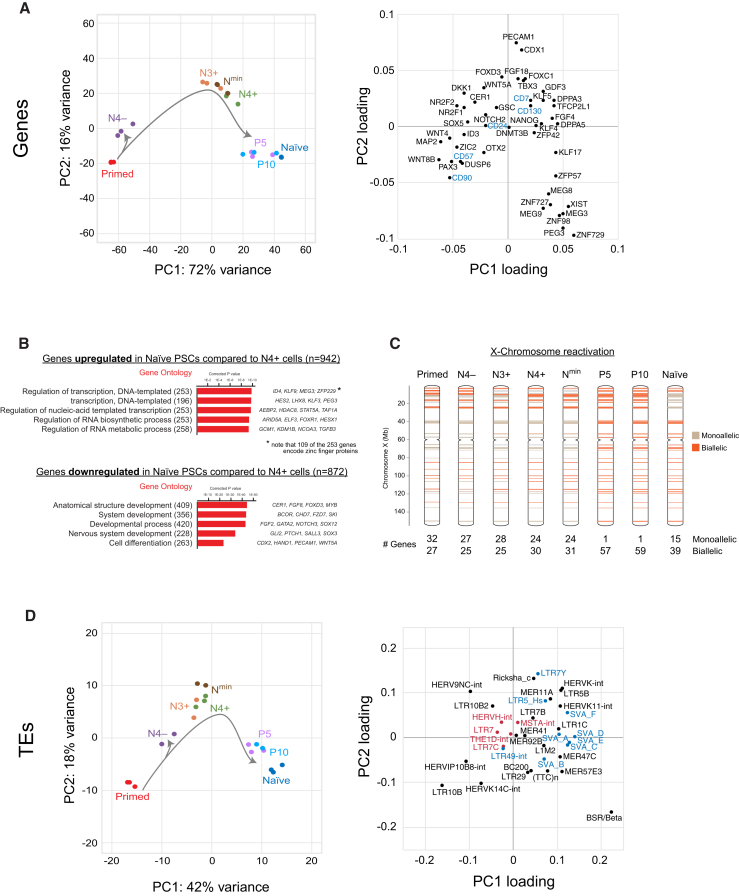
Human pluripotent stem cells (PSCs) exist in naive and primed states and provide important models to investigate the earliest stages of human development. Naive cells can be obtained through primed-to-naive resetting, but there are no reliable methods to prospectively isolate unmodified naive cells during this process. Here we report comprehensive profiling of cell surface proteins by flow cytometry in naive and primed human PSCs. Several naive-specific, but not primed-specific, proteins were also expressed by pluripotent cells in the human preimplantation embryo. The upregulation of naive-specific cell surface proteins during primed-to-naive resetting enabled the isolation and characterization of live naive cells and intermediate cell populations. This analysis revealed distinct transcriptional and X chromosome inactivation changes associated with the early and late stages of naive cell formation. Thus, identification of state-specific proteins provides a robust set of molecular markers to define the human PSC state and allows new insights into the molecular events leading to naive cell resetting.

Keywords: antibody library; blastocyst; cell surface markers; differentiation; embryonic stem cells; pluripotency; reprogramming.


Figures

None
Graphical abstract
Figure 1
Figure 1
A Resource of Human Naive Cell and Primed PSC Surface Proteins (A) Overview of the experimental design. Human primed (cultured under knockout serum replacement [KSR]/mouse embryonic fibroblast [MEF] and E8/Vitronectin conditions) and naive (cultured under t2i/L+PKCi and 5i/L/FA conditions) H9 PSCs were profiled by multiple antibody libraries that targeted 377 cell surface proteins. Samples were analyzed by high-throughput flow cytometry, and quantification of fluorescence intensity values enabled the identification of state-specific cell surface proteins. See Figure S1 for characterization of the primed and naive PSCs and Figure S2 for additional details regarding the experimental design. (B) Summary of the flow cytometry profiling. Each dot represents a different cell surface protein, and their position along the x and y axes is determined by the percent positive value in naive and primed PSC samples (averaged from one to three independent assays per cell type). Flow cytometry data for naive PSCs cultured under t2i/L+PKCi and 5i/L/FA conditions were combined. Based on their position in the chart, a subset of cell surface proteins have been categorized as naive-specific (blue), primed-specific (red), and common to both naive and primed PSCs (green). See Table S1 for the full dataset. The image of the flow cytometer is provided courtesy of and copyrighted to Becton Dickinson and is reprinted with permission.
Figure 2
Figure 2
Validation of the Identified Cell Surface Proteins Using Naive and Primed PSCs and Human Blastocysts (A) Immunofluorescent microscopy of primed (KSR/MEF) and naive (5i/L/FA) H9 PSCs for selected cell surface proteins. Histograms of flow cytometry analysis using fluorophore-conjugated antibodies show separation in the fluorescence signal between primed and 5i/L/FA-cultured naive H9 PSCs for all tested cell surface proteins. See Figure S3 for an analysis of t2i/L+PKCi-cultured and RSeT-cultured H9 PSCs. Scale bars, 50 μm. (B) Immunofluorescence microscopy cross-sections of embryonic day 6 human blastocysts labeled with antibodies that detect the identified naive and primed cell surface markers together with NANOG (to reveal the location of epiblast cells) and the DNA stain Hoechst. Scale bars, 50 μm.
Figure 3
Figure 3
An Antibody Panel to Distinguish between Naive-State and Primed-State Human PSCs (A) A list of antibodies that are combined to form a multiplexed panel. The information in brackets shows the fluorophore conjugation of each antibody. See Table S4 for antibody details and Table S5 for flow cytometer parameters. (B) Flow cytometry contour plots of pairwise antibody combinations. The primed-specific marker CD57 is on the y axes, and different naive-specific (top) and primed-specific (bottom) markers are on the x axes. Primed (red) and t2i/L+PKCi-cultured naive (blue) H9 PSCs are shown for each antibody combination. See Figure S4A for flow cytometry plots that exemplify a typical complete gating scheme for H9 naive PSCs. Note that CD77 shows a greater degree of heterogeneity in naive PSCs compared with the other markers but is still useful when used in combination. (C) FlowSOM visualization of flow cytometry data for all antibodies in the panel. An unsupervised self-organizing map arranges the cells into clusters (represented by circles) according to similarities in their cell surface protein expression profiles (right). Overlaying the identity of the cell type within each cluster reveals a clear separation of naive (blue) and primed (red) populations. The heatmap panels (left) show the expression level of each cell surface protein in the cell clusters. Clusters are arranged in the same position as for the minimal spanning tree of the self-organizing map. See Figures S4B and S4C for analyses of additional ESC and iPSC lines. (D) Flow cytometry contour plots show that the identified panel of state-specific markers can discriminate between primed and naive PSCs when the cells are mixed together. Left: the expression levels of two naive-specific proteins (CD130 and CD75) in primed (top) and naive (bottom) H9 PSCs. Top right: the expression levels of the same proteins in a sample of 90% primed + 10% naive PSCs. Bottom right: CD75+/CD130+ cells do not express the primed-specific markers CD57 and CD24. Gates were drawn based on unstained, live, human PSCs.
Figure 4
Figure 4
Cell Surface Protein Expression Levels Track the Dynamics of Naive-to-Primed PSC Transition (A) Overview of the experimental design. Shown is a time course experiment of PSCs undergoing a transition from the naive state to the primed state, with flow cytometry analysis every 48 hr. (B) Phase contrast images of H9 PSCs reveal the morphological changes that occur during naive state-to-primed state transition under t2i/L+PKCi conditions. Scale bars, 100 μm. (C) Flow cytometry dotplots of pairwise antibody combinations over the time course. Shown are primed-specific markers on the y axis (CD57, top; CD90, bottom) and naive-specific markers on the x axis (CD75, top; CD130, bottom). (D) FlowSOM visualization of the flow cytometry time course data for H9 PSCs. The minimal spanning tree of the self-organizing map displays an unsupervised clustering of the samples based on their cell surface protein expression levels (right). The results reveal a progressive change in cell surface protein expression during conversion from the naive state to the primed state. The heatmap shows the expression level of each cell surface protein marker in the cell clusters (left).
Figure 5
Figure 5
Monitoring the Dynamics of Primed-State to Naive-State PSC Conversion Using Cell Surface Protein Markers (A) Phase contrast images of H9 PSCs reveal the morphological changes that occur during primed-state to naive-state conversion under t2i/L+PKCi conditions. Doxycycline-inducible NANOG and KLF2 transgenes were activated for the first 8 days in t2i/L, and then doxycycline was withdrawn and PKCi was added. Scale bars, 100 μm. (B) Flow cytometry dotplots of pairwise antibody combinations over the time course. Shown are primed-specific markers on the y axis (CD57, top; CD24, bottom) and naive-specific markers on the x axis (CD75, top; CD130, bottom). (C and D) FlowSOM visualization of the flow cytometry time course data for (C) H9 PSCs under t2i/L+PKCi conditions and (D) WIBR3 under 5i/L/A conditions. Note that 5i/L/A conversion is transgene-free and that 5i/L/A was added on day 1. The minimal spanning trees of the self-organizing maps display an unsupervised clustering of the samples based on their cell surface protein expression levels (right). The heatmap shows the expression level of each cell surface protein marker in the cell clusters (left).
Figure 6
Figure 6
Prospective Isolation of Early-Stage Naive Cells (A) Flow cytometry dotplots of day 10 cells during primed-state to naive-state conversion of H9 PSCs under t2i/L+PKCi conditions. Left: the levels of two naive-specific markers, CD75 and CD77. Based on unstained, live, human day 10 samples, three cell sorting gates have been drawn that correspond to CD75+/CD77+ (green box), CD75/CD77+ (orange box), and CD75/CD77 (purple box) cell populations. Right: the levels of CD7 and CD130 proteins for the same three gated cell populations. Boxed areas indicate the N4+ (green), N3+ (orange), and N4 (purple) cell populations that were used for subsequent experiments. The percentage of cells within each cell sorting gate relative to all live, human cells is shown. Note that the values do not take into account additional gates; for example, to exclude primed-state markers. See Figure S5C for the Nmin gating strategy. (B) FlowSOM visualization of the flow cytometry data for day 10 cells during primed to naive conversion. The minimal spanning tree of the self-organizing map displays an unsupervised clustering of the sample based on the cell surface protein expression levels (right). The cells corresponding to each cell sorting population, N4+, N3+, and N4, are indicated. The heatmap shows the expression level of each cell surface protein marker in the cell clusters (left). See Figure S5A for FlowSOM visualization of WIBR3 PSCs on day 10 of primed state-to-naive state conversion and Figure S5D for FlowSOM visualization of Nmin cells. (C) qRT-PCR analysis of gene expression levels in the different cell-sorted populations and established naive PSCs. Expression levels are shown on a log scale relative to primed PSCs. Data show the mean ± SD of three or four biological replicates and were compared to established naive PSCs using an ANOVA with Dunnett’s multiple comparisons test (p < 0.05, ∗∗p < 0.005, ∗∗∗p < 0.0005). (D) Scoring of colony morphology after transferring the different cell-sorted populations into naive PSC conditions. Colonies were categorized as naive, mixed, primed, and differentiated; examples are shown below. Data show the mean ± SD of three or four biological replicates and were compared to established naive PSCs using an ANOVA with Dunnett’s multiple comparisons test (p < 0.05, ∗∗p < 0.005, ∗∗∗p < 0.0005). Scale bars, 100 μm. (E) Immunofluorescence microscopy for KLF17 (a naive-specific protein) and OCT4 (a protein expressed by naive and primed PSCs) reveals that N4+ and Nmin cell-sorted populations can generate KLF17+/OCT4+ colonies that are similar to established naive PSCs. Scale bars, 100 μm. (F) Phase contrast images showing representative fields of view of N4+ and Nmin cell-sorted populations that have been propagated under t2i/L+PKCi naive PSC conditions for three passages. Scale bars, 100 μm. See Figure S5B for similar results using WIBR3 PSCs under 5i/L/FA conditions.
Figure 7
Figure 7
Distinct Molecular Changes during Naive Cell Formation (A) PCA of RNA-sequencing gene expression data from the different cell-sorted populations (left). Right: the contribution of selected genes to the first and second PCs. (B) Top GO terms of genes that were differentially expressed between N4+ and established naive PSCs. Numbers of genes are shown; example genes within each GO category are listed (right). Corrected p values were calculated using a modified Fisher’s exact test followed by Bonferroni’s multiple comparisons test. See Table S2 for the full dataset. (C) Schematic of X chromosomes that summarize the results from an allelic analysis of RNA-seq data for the indicated cell types. Informative SNPs within X-linked genes of the H9 PSC line (Vallot et al., 2017) were used to classify expression as monoallelic (brown, <25% from minor allele), biallelic (orange, 25%–75% from minor allele), or not expressed (gray, <10 reads/sample). The number of monoallelic and biallelic genes is shown below. (D) PCA of TE classes from the different cell-sorted populations (left). Right: the contribution of TEs to the first and second PC. Selected TEs are labeled as having a previously defined naive (blue) or primed (red) TE signature (Theunissen et al., 2016).

Comment in

References

    1. Aken B.L., Achuthan P., Akanni W., Amode M.R., Bernsdorff F., Bhai J., Billis K., Carvalho-Silva D., Cummins C., Clapham P. Ensembl 2017. Nucleic Acids Res. 2017;45(D1):D635–D642. - PMC - PubMed
    1. Blakeley P., Fogarty N.M.E., del Valle I., Wamaitha S.E., Hu T.X., Elder K., Snell P., Christie L., Robson P., Niakan K.K. Defining the three cell lineages of the human blastocyst by single-cell RNA-seq. Development. 2015;142:3151–3165. - PMC - PubMed
    1. Brandenberger R., Wei H., Zhang S., Lei S., Murage J., Fisk G.J., Li Y., Xu C., Fang R., Guegler K. Transcriptome characterization elucidates signaling networks that control human ES cell growth and differentiation. Nat. Biotechnol. 2004;22:707–716. - PubMed
    1. Carbon S., Ireland A., Mungall C.J., Shu S., Marshall B., Lewis S., Ami G.O., AmiGO Hub. Web Presence Working Group AmiGO: online access to ontology and annotation data. Bioinformatics. 2009;25:288–289. - PMC - PubMed
    1. Carpenter M.K., Rosler E.S., Fisk G.J., Brandenberger R., Ares X., Miura T., Lucero M., Rao M.S. Properties of four human embryonic stem cell lines maintained in a feeder-free culture system. Dev. Dyn. 2004;229:243–258. - PubMed

Publication types

MeSH terms

Substances