. 2017 Apr 11;8(4):907-918.
doi: 10.1016/j.stemcr.2017.02.014. Epub 2017 Mar 23.

A Genome-wide Analysis of Human Pluripotent Stem Cell-Derived Endothelial Cells in 2D or 3D Culture

Affiliations

A Genome-wide Analysis of Human Pluripotent Stem Cell-Derived Endothelial Cells in 2D or 3D Culture

Jue Zhang et al. Stem Cell Reports. .

Abstract

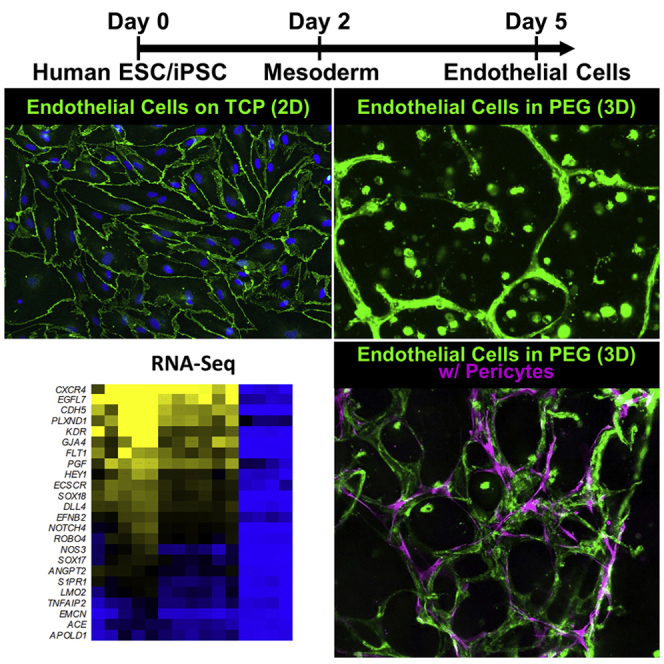
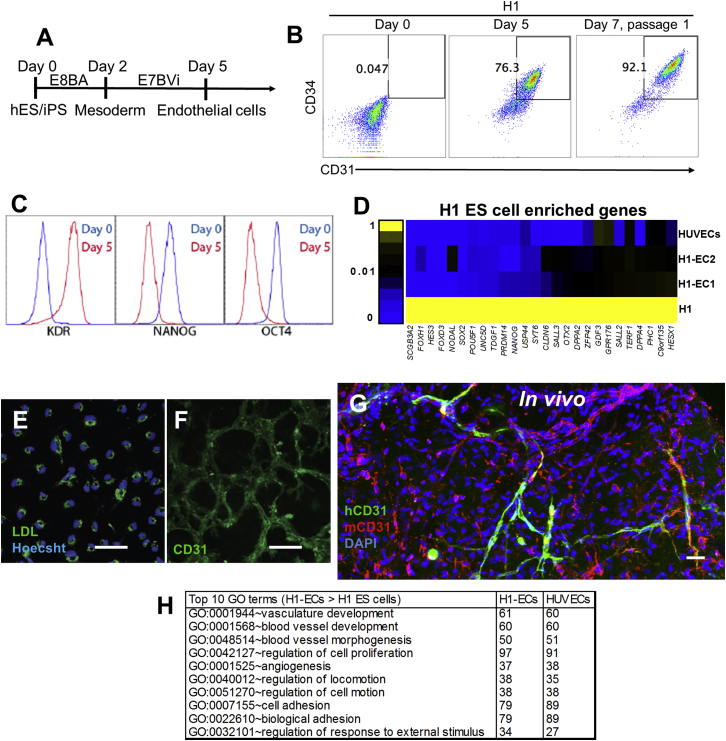
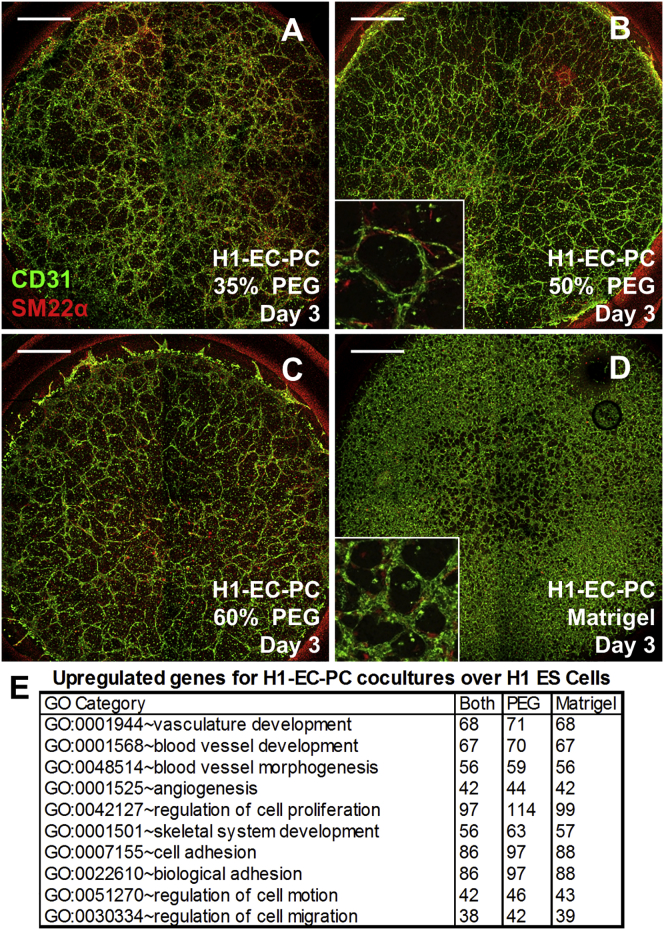
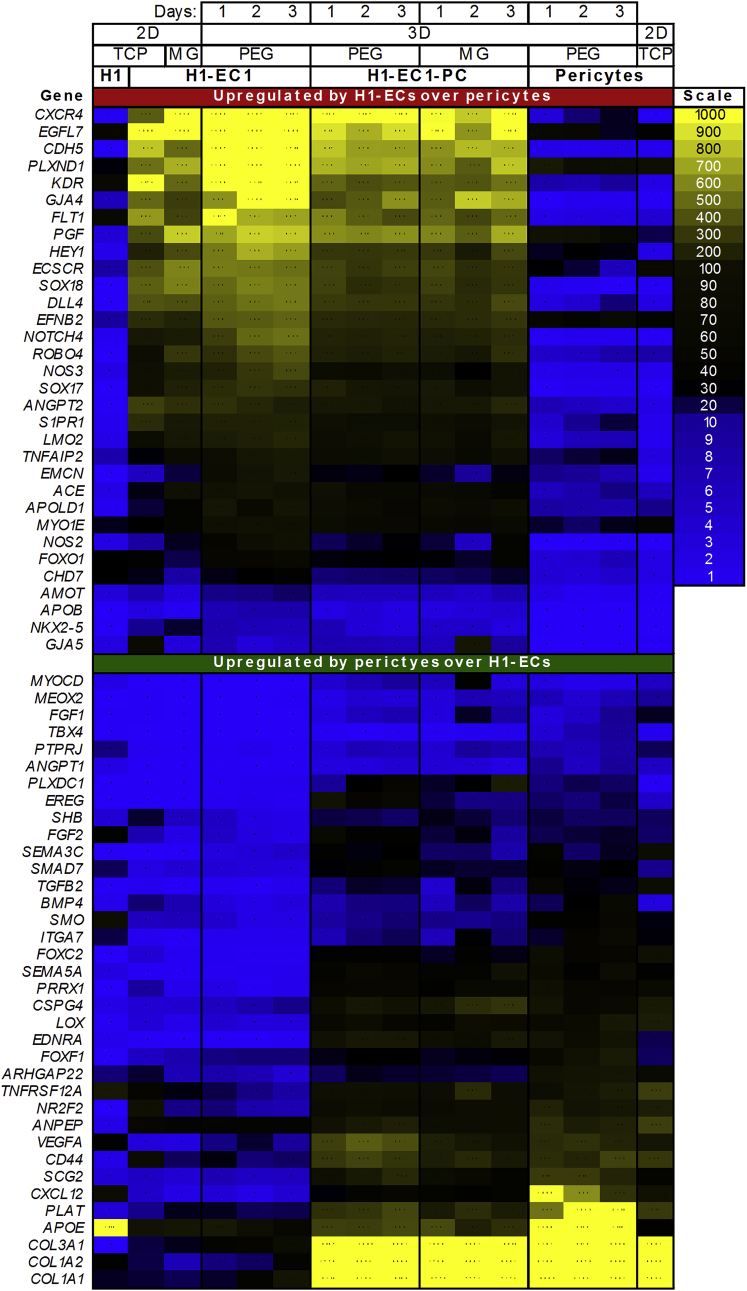
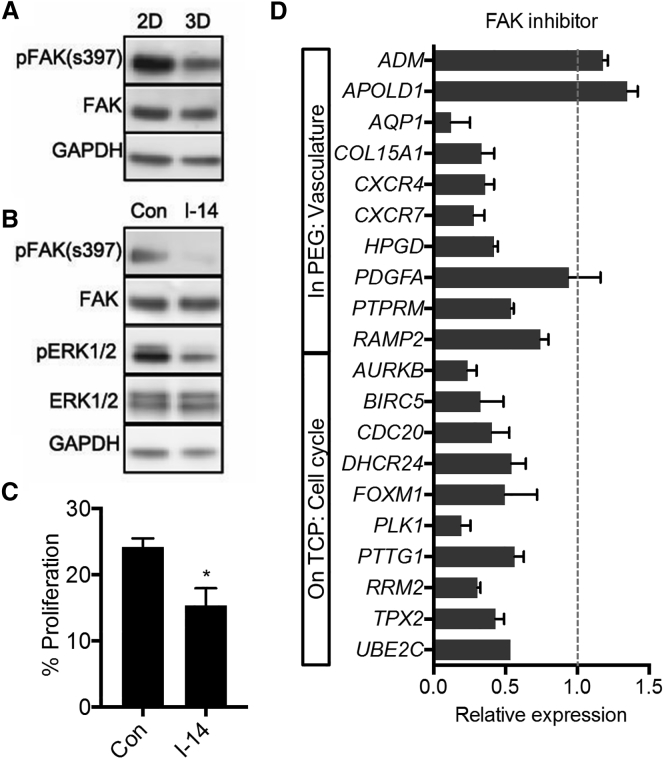
A defined protocol for efficiently deriving endothelial cells from human pluripotent stem cells was established and vascular morphogenesis was used as a model system to understand how synthetic hydrogels influence global biological function compared with common 2D and 3D culture platforms. RNA sequencing demonstrated that gene expression profiles were similar for endothelial cells and pericytes cocultured in polyethylene glycol (PEG) hydrogels or Matrigel, while monoculture comparisons identified distinct vascular signatures for each cell type. Endothelial cells cultured on tissue-culture polystyrene adopted a proliferative phenotype compared with cells cultured on or encapsulated in PEG hydrogels. The proliferative phenotype correlated to increased FAK-ERK activity, and knockdown or inhibition of ERK signaling reduced proliferation and expression for cell-cycle genes while increasing expression for "3D-like" vasculature development genes. Our results provide insight into the influence of 2D and 3D culture formats on global biological processes that regulate cell function.

Keywords: 3D culture; MAPK; Matrigel; differentiation; endothelial cells; focal adhesion kinase; human pluripotent stem cells; hydrogel; tissue engineering; xeno-free.


Figures

None
Graphical abstract
Figure 1
Figure 1
Protocol for Deriving Endothelial Cells from Human Pluripotent Stem Cells (A) Human PSCs were differentiated into endothelial cells via a mesoderm intermediate (Figure S1 provides representative data for the modified “E8BAC” protocol). (B) Representative yields (CD34+CD31+ cells) by flow cytometric analysis for ESC-derived endothelial cells (H1-ECs) after 5 days of differentiation followed by one passage (to day 7). (C and D) H1-ECs (C) upregulated KDR and downregulated NANOG and OCT4 by FACS analysis and (D) downregulated pluripotent genes by RNA-seq. H1-EC1, original differentiation protocol; H1-EC2, modified differentiation protocol; HUVECs, human umbilical vein endothelial cells. (E–G) H1-ECs also (E) took up LDL and formed capillary networks in Matrigel (F) in vitro (CD31, green) and (G) in vivo (human CD31, green; mouse CD31, red). For the in vivo condition, 5 × 105 endothelial cells were suspended in 100 μL of E7V medium and 200 μL of Matrigel, injected subcutaneously into the neck of nude mice, and harvested for immunostaining after 2 weeks. Scale bars, 50 μm. (H) The top ten gene ontology (GO) terms identified using the DAVID functional annotation database for upregulated genes by H1-endothelial cells relative to H1 ESCs cultured on TCP surfaces. Upregulated genes for HUVECs are shown in the same GO categories. Undifferentiated H1 ESCs treated with the same antibodies were used as gating controls for FACS experiments illustrated in (A) and (B). See Table S2 for full DE gene lists.
Figure 2
Figure 2
A Comparison of H1-ECs Cocultured with Pericytes in PEG Hydrogels or Matrigel (A–D) H1-ECs were cocultured with primary human pericytes (PCs) in (A–C) polyethylene glycol (PEG) hydrogels with 35%–60% MMP-degradable peptide crosslinks or (D) Matrigel. Scale bars, 1000 μm. (E) GO terms for genes upregulated by H1-EC-PC cocultures over H1 ESCs (FDR ≤ 0.005) were identified using the DAVID functional annotation database. The top ten GO terms are shown for upregulated genes that overlapped for H1-EC-PC cocultures in both PEG hydrogels and Matrigel on each of the first three days of culture (“Both”). The number of upregulated genes that overlapped on days 1–3 for H1-EC-PC cocultures in PEG hydrogels alone (“PEG”) or Matrigel alone (“Matrigel”) for the same GO categories are also shown. See Table S3 for full lists of DE genes and GO terms.
Figure 3
Figure 3
Vasculature Development Genes Robustly Expressed by H1-ECs or Pericytes Upregulated genes (FDR ≤ 0.005) for H1-ECs (top) or pericyte (bottom, reverse order) that overlapped on days 1–3 of culture in PEG hydrogels (data from RNA-seq experiment #1). Genes were ranked within the GO category “vasculature development (GO:0001944)” based on average normalized expression (TPM) for H1-ECs or pericytes in 3D culture on days 1–3. H1 ESCs, 2D monocultured H1-ECs, pericytes, and H1-EC-PC cocultures in PEG hydrogels or Matrigel are shown for comparison. See Table S4 for comparisons of normalized expression for H1-ECs and HUVECs from RNA-seq experiment #2.
Figure 4
Figure 4
FAK Signaling and Differentially Expressed Genes for H1-ECs Cultured on TCP Surfaces or in PEG Hydrogels (A and B) Western blot analysis for H1-ECs cultured on TCP surfaces or in PEG hydrogels. (A) Total and phosphorylated FAK expression by H1-ECs cultured on TCP (2D) or in PEG hydrogels (3D). (B) Total and phosphorylated FAK or ERK1/2 expression by H1-ECs cultured on TCP surfaces after treatment with 0 μM (untreated control) or 20 μM Inhibitor-14 (I-14, pFAK inhibitor). Protein was collected 1 day after encapsulation for H1-ECs in PEG hydrogels and 2 days after plating on TCP surfaces (cells were 100% confluent). (C) I-14 treatment for H1-ECs in 2D culture resulted in decreased proliferation (FACS analysis of 5-ethynyl-2′-deoxyuridine [EdU] expression). Data are presented as mean ± SD (n = 3 independent experiments; p < 0.05). (D) qRT-PCR was used to investigate changes in gene expression for H1-ECs cultured on TCP surfaces in response to treatment with pFAK inhibitor (I-14). Gene expression was normalized to untreated control (dashed line, RE = 1). Data are presented as mean ± SD (n = 4 technical replicates; triplicate samples prepared from separate cryopreserved vials of the same differentiation were pooled for analysis; p < 0.05 for all genes except ADM and PDGFA). RNA-seq was used to identify differentially expressed genes upregulated by H1-ECs cultured in PEG hydrogels (top, associated with AmiGO term “GO:0001944: vasculature development”) or on TCP surfaces (bottom, from the AmioGO term “GO:0007049: cell cycle”), as described in Supplemental Experimental Procedures. See also Figure S3 and Table S5.
Figure 5
Figure 5
The ERK/MAPK Signaling Pathway Modulates H1-EC Phenotypes for Cells on TCP Surfaces or in PEG Hydrogels (A and B) Western blot analysis for H1-ECs cultured on TCP surfaces or in PEG hydrogels. (A) Total and phosphorylated ERK and VEGFR2/KDR for H1-ECs cultured on TCP surfaces (2D) or in PEG hydrogels (3D). (B) Total and phosphorylated ERK expression as a function of MEK inhibitor concentration (U0126, μM) for H1-ECs cultured on TCP surfaces. Protein was collected 1 day after encapsulation for H1-ECs in PEG hydrogels and 2 days after plating on TCP surfaces (cells were 100% confluent). (C) Click-it EdU assay demonstrates that 4 μM U0126 treatment decreases H1-EC proliferation. Data are presented as mean ± SD (n = 3 independent experiments; p < 0.05). (D and E) qRT-PCR was used to investigate changes in gene expression for H1-ECs cultured on TCP surfaces in response to (D) treatment with the MEK inhibitor UO126 or (E) knockdown of ERK2 by siRNA. Gene expression was normalized to DMSO control for MEK inhibition and to a non-targeting (NT) control for ERK2 knockdown by siRNA. Data are presented as mean ± SD (n = 4 technical replicates; triplicate samples prepared from separate cryopreserved vials of the same differentiation were pooled for analysis; p < 0.05 for all genes except 10 μM CXCR4 and 4 μM FOXM1 for MEK inhibition; p < 0.05 for all genes except ADM and PDGFA for ERK2 knockdown). RNA-seq was used to identify differentially expressed genes upregulated by H1-ECs cultured in PEG hydrogels (top, associated with AmiGO term “GO:0001944: vasculature development”) or on TCP surfaces (bottom, from the AmioGO term “GO:0007049: cell cycle”), as described in Supplemental Experimental Procedures. See also Figure S3 and Table S5.

Similar articles

Cited by

References

    1. Ahn N.G., Seger R., Bratlien R.L., Diltz C.D., Tonks N.K., Krebs E.G. Multiple components in an epidermal growth factor-stimulated protein kinase cascade. In vitro activation of a myelin basic protein/microtubule-associated protein 2 kinase. J. Biol. Chem. 1991;266:4220–4227. - PubMed
    1. Arnaoutova I., George J., Kleinman H.K., Benton G. The endothelial cell tube formation assay on basement membrane turns 20: state of the science and the art. Angiogenesis. 2009;12:267–274. - PubMed
    1. Ashburner M., Ball C.A., Blake J.A., Botstein D., Butler H., Cherry J.M., Davis A.P., Dolinski K., Dwight S.S., Eppig J.T. Gene Ontology: tool for the unification of biology. Nat. Genet. 2000;25:25–29. - PMC - PubMed
    1. Bauer J., Margolis M., Schreiner C., Edgell C.J., Azizkhan J., Lazarowski E., Juliano R.L. In vitro model of angiogenesis using a human endothelium-derived permanent cell line—contributions of induced gene expression, G-proteins, and integrins. J. Cell Physiol. 1992;153:437–449. - PubMed
    1. Belair D., Whisler J., Valdez J., Velazquez J., Molenda J., Vickerman V., Lewis R., Daigh C., Hansen T., Mann D. Human vascular tissue models formed from human induced pluripotent stem cell derived endothelial cells. Stem Cell Rev. Rep. 2015;11:511–525. - PMC - PubMed

MeSH terms