. 2017 Apr 10;31(4):532-548.e7.
doi: 10.1016/j.ccell.2017.02.017. Epub 2017 Mar 23.

Development of Peptidomimetic Inhibitors of the ERG Gene Fusion Product in Prostate Cancer

Affiliations

Development of Peptidomimetic Inhibitors of the ERG Gene Fusion Product in Prostate Cancer

Xiaoju Wang et al. Cancer Cell. .

Erratum in

Abstract

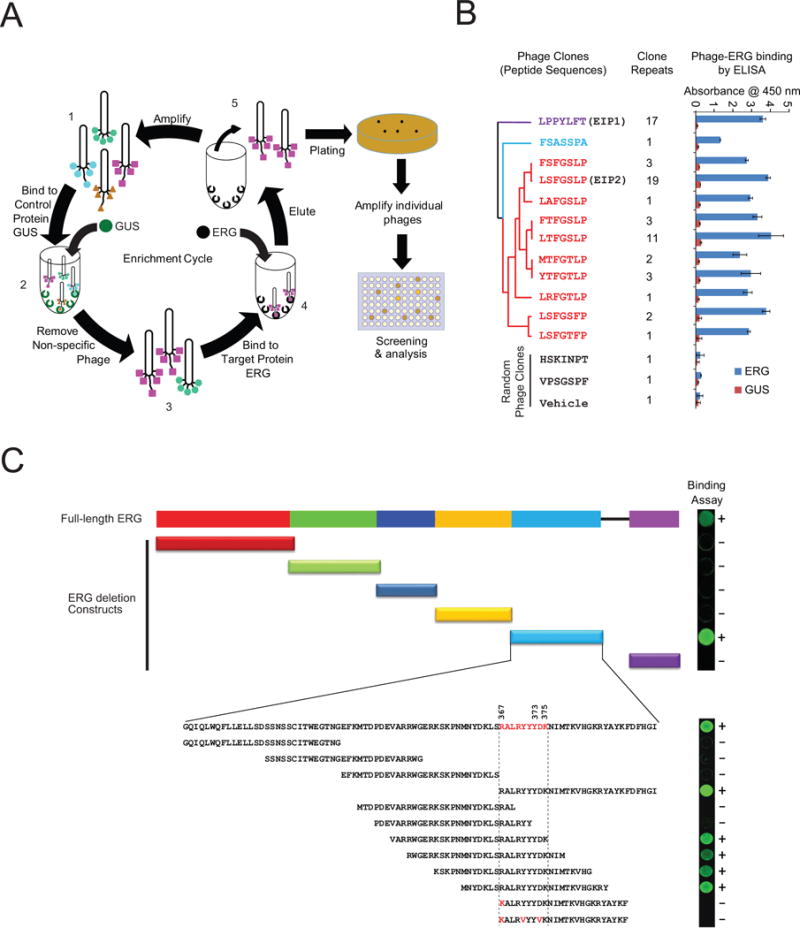
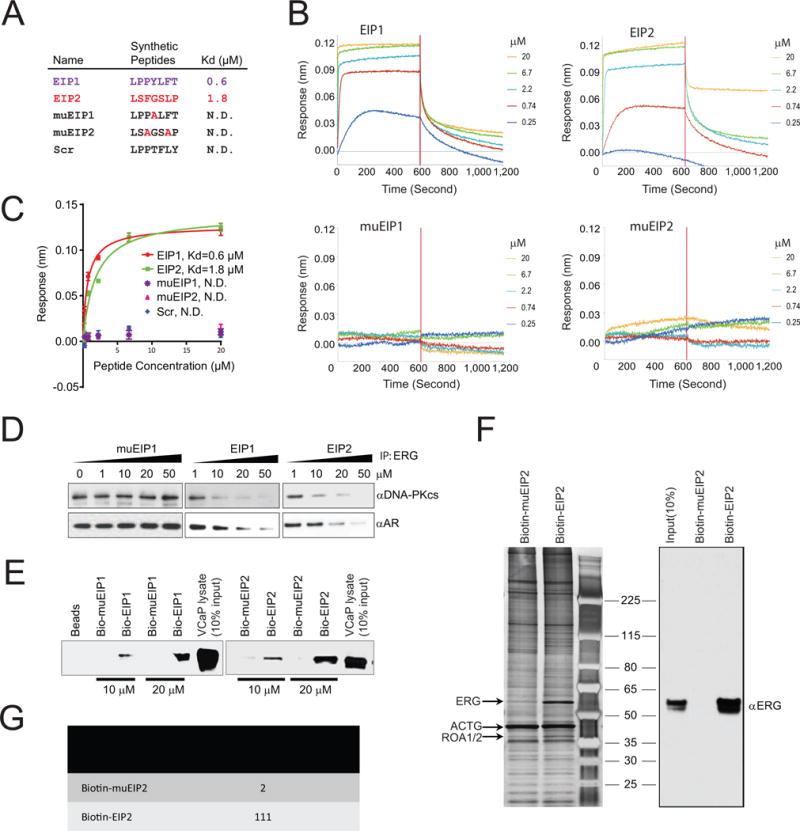
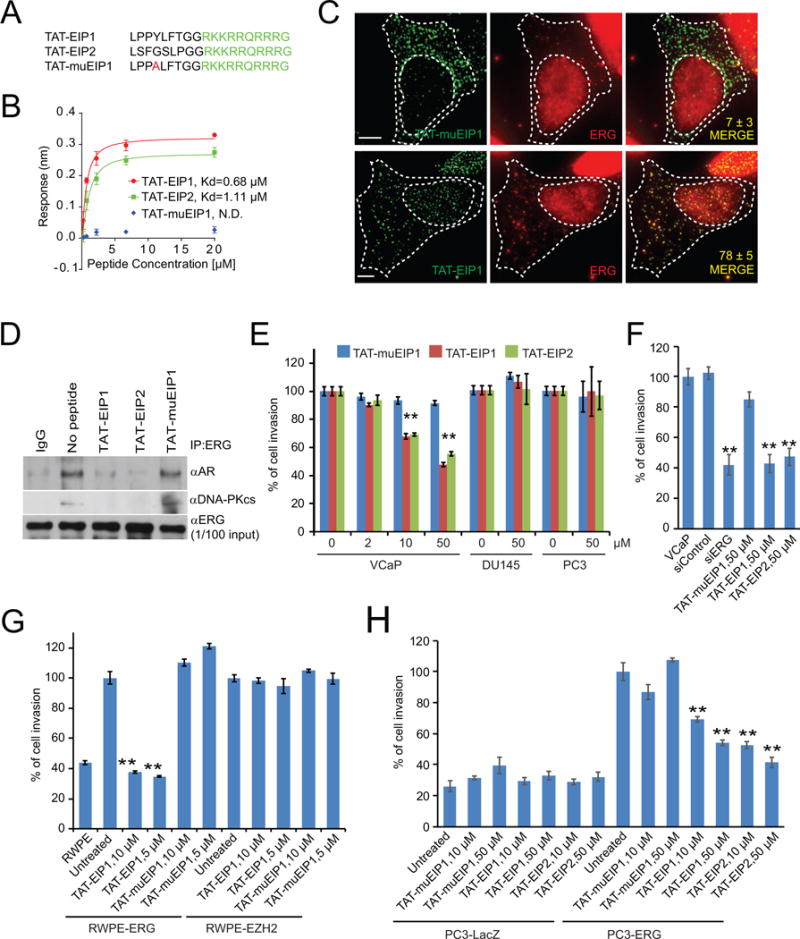
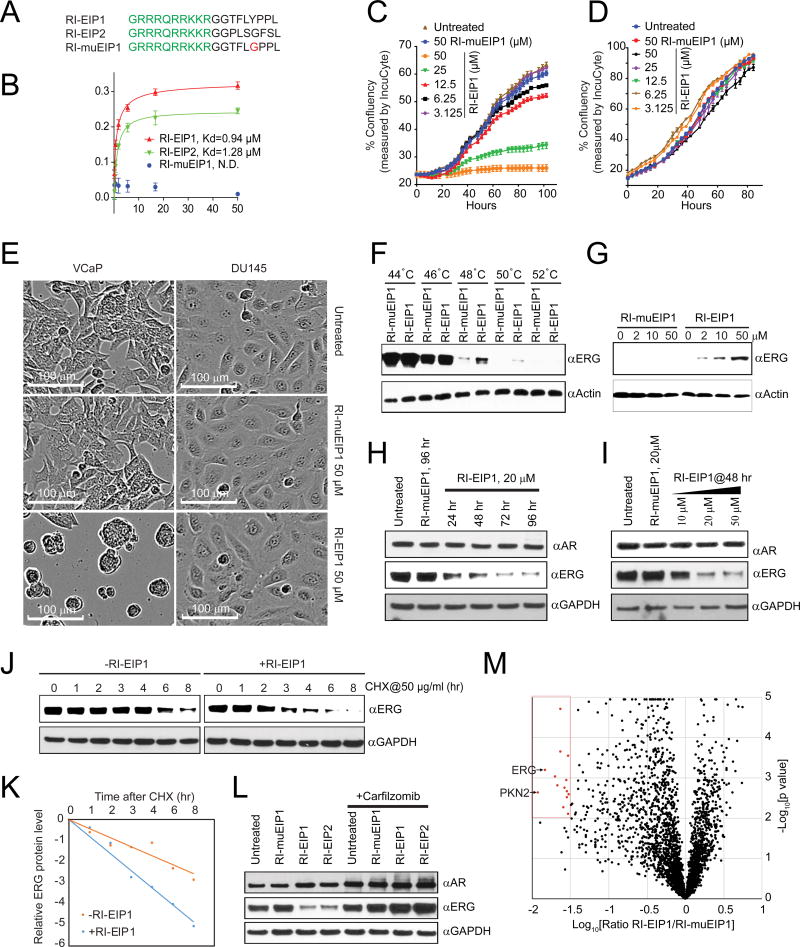
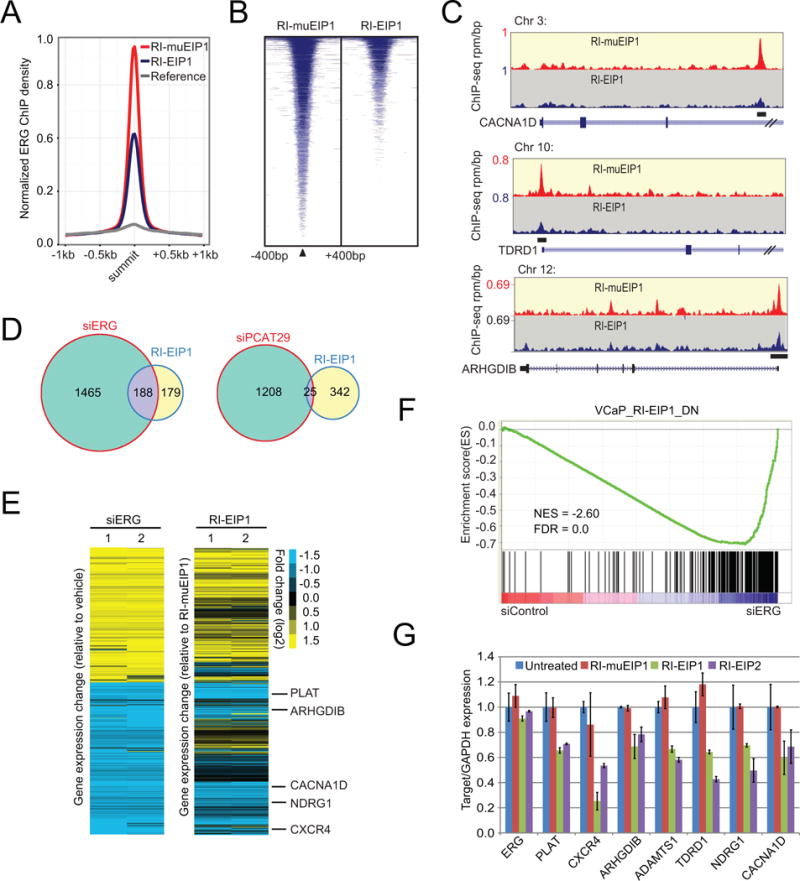
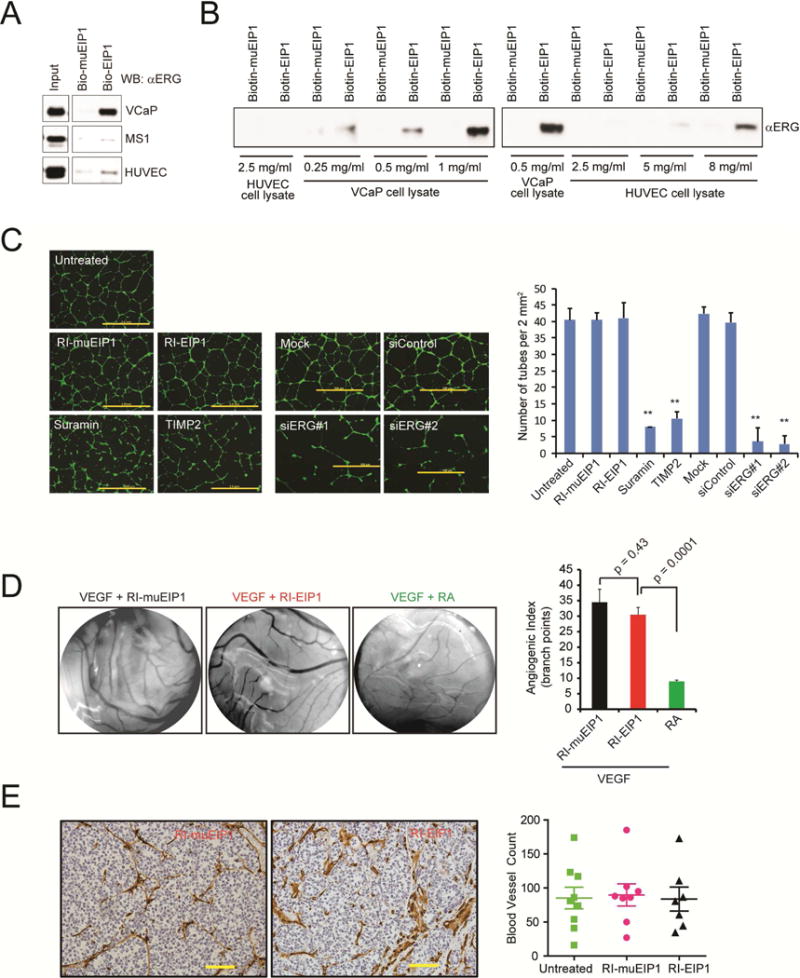
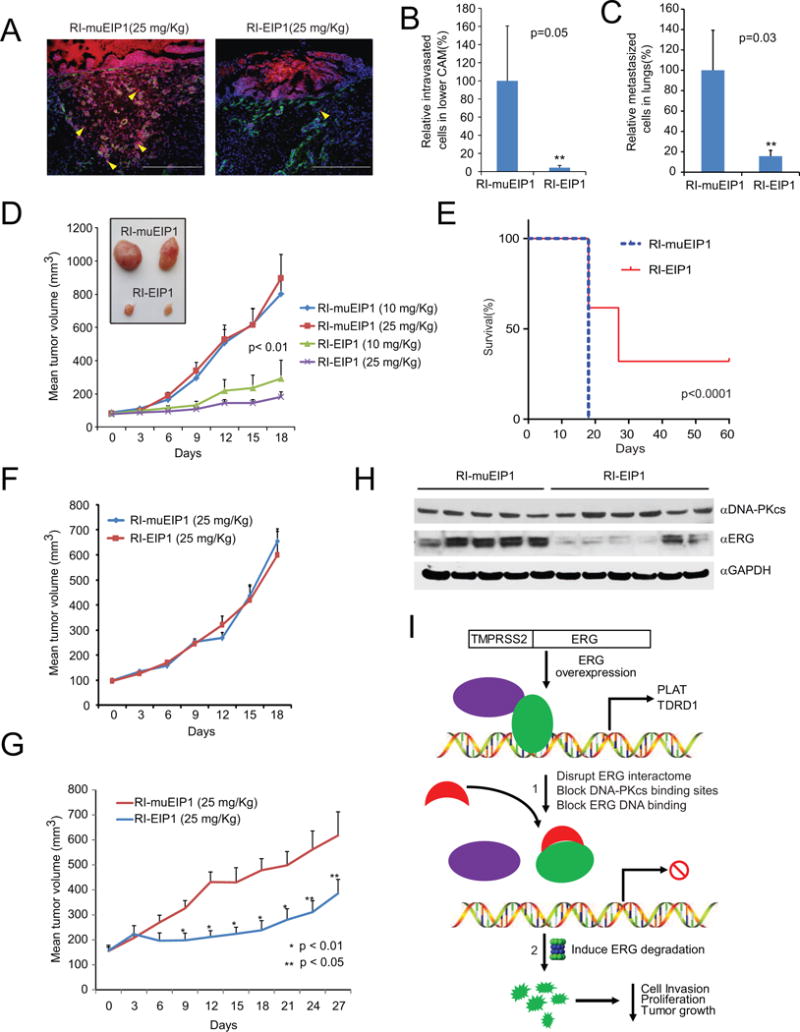
Transcription factors play a key role in the development of diverse cancers, and therapeutically targeting them has remained a challenge. In prostate cancer, the gene encoding the transcription factor ERG is recurrently rearranged and plays a critical role in prostate oncogenesis. Here, we identified a series of peptides that interact specifically with the DNA binding domain of ERG. ERG inhibitory peptides (EIPs) and derived peptidomimetics bound ERG with high affinity and specificity, leading to proteolytic degradation of the ERG protein. The EIPs attenuated ERG-mediated transcription, chromatin recruitment, protein-protein interactions, cell invasion and proliferation, and tumor growth. Thus, peptidomimetic targeting of transcription factor fusion products may provide a promising therapeutic strategy for prostate cancer as well as other malignancies.

Keywords: ERG transcription factor; peptidomimetic inhibitor; prostate cancer.


Figures

Figure 1
Figure 1. Identification and characterization of ERG-binding phage peptides
(A) Schematic representation of the phage display workflow to identify ERG-binding peptides. A random seven amino acid phage display library (1) was pre-adsorbed onto purified GUS control protein (2) to remove nonspecific peptides, pre-cleared phage peptides were then enriched for ERG-binding peptides by employing purified recombinant ERG protein as bait (3), bound phage clones were then eluted (4) and propagated (5). After 4 rounds of selection, enriched ERG-binding phage clones were individually cultured and amplified for further analysis. (B) The 12 unique phage peptides were classified into three groups, indicated by different colors, using Clustal Omega (http://www.ebi.ac.uk/Tools/msa/clustalo/). Phage peptide LPPYLFT was designated as EIP1 and LSFGSLP as EIP2. A total of 17 clone repeats were enriched for EIP1 sequence and 19 clones for EIP2 sequence. The phage peptide-ERG interaction was further validated by ELISA. Phage clones randomly selected from the original phage library and phage vehicle (without DNA insert) were used as negative controls. For all experiments, mean ± SEM is shown. (C) Mapping of the phage peptide binding residues to the ERG ETS domain. The images (right) represent images from protein array analysis where positive interactions are indicated by “+” and negative by “−”. See also Figure S1.
Figure 2
Figure 2. Binding properties of synthetic peptides
(A) The synthetic peptide sequences and corresponding binding affinity (Kd) as determined by OctetRED biolayer interferometry. Point mutations with alanine substitution and scrambled peptide were used as negative controls where Kd could not be determined (N.D.). (B) Real-time binding was measured by immobilization of biotinylated ERG protein to the streptavidin biosensors and subsequent interactions with varying concentrations of synthetic peptides as indicated. (C) The plots show the response versus peptide concentration curves derived from the raw binding data. Dissociation constants (Kd) represent the peptide concentration yielding half-maximal binding to ERG. For all experiments, mean ± SEM is shown. (D) Halo-tagged ERG protein was expressed by in vitro transcription/translation. Pull-downs followed by immunoblot analysis were performed on mixtures of either Halo-ERG and GST-AR or Halo-ERG and DNA-PKcs in the presence of varying concentrations of peptide, as indicated. (E) Biotin-EIP1/2 or biotin-muEIP was incubated with VCaP cell lysates. Eluates from the pull-downs were subjected to immunoblot analysis using an anti-ERG antibody. (F) Pull-down experiment was performed as in (E) followed by silver staining (left panel) and parallel immunoblot analysis (right panel). (G) Candidate ERG bands identified in (F) were subjected to mass spectrometric analysis. Spectral counts for the ERG peptide, NTGGAAFIFPNTSVYPEATQR, are shown for both biotinylated-EIP2 and muEIP2 pull-downs. All error bars represent ± SEM. See also Figure S2 and Table S1.
Figure 3
Figure 3. Cell-permeable EIPs block ERG-mediated cell invasion
(A) Sequences of TAT (shown in green) conjugated peptides. (B) Kinetic binding data for TAT-EIPs and ERG. (C) Representative pseudocolored images of VCaP cells treated with FITC-labeled (green, left) control peptide muEIP1 (top panels) or EIP1 (bottom panels) and stained for ERG (red, middle). Overlay of red and green channels are represented in the “Merge” panel. Values in each “Merge” image depict the extent of green-red colocalization in the nucleus, wherein a value of ‘0’ represents no colocalization and value of ‘100’ represents complete colocalization. The colocalization numbers are represented by mean ±SEM. Scale bar, 5 μm (n >20 cells). (D) IP-immunoblot analysis of VCaP cells treated with either TAT-EIPs or -muEIP1, or untreated. Cell lysates (1/100 IP input) were used as positive controls. (E–H) Boyden chamber transwell invasion assays of VCaP, DU145 and PC3 (E), VCaP (F), RWPE-ERG and –EZH2 (G), PC3-LacZ and –ERG (H) were performed in chambers pre-coated with Matrigel. Cells were pretreated as indicated for 48 hours and allowed to incubate for an additional 48 hours prior to fixation, imaging, and quantification of cell invasion. The data shown are the mean of three independent experiments. All error bars represent ± SEM. **p< 0.05. See also Figure S3.
Figure 4
Figure 4. Retroinverso EIPs specifically bind to and destabilize ERG
(A) Sequences of the retroinverso peptidomimetics; except glycine, all amino acids are D-isomer. TAT sequences are shown in green. (B) The kinetic binding curve for RI-EIPs as measured by OctetRED, as in Figure 2C. The data shown are the mean of three independent experiments. (C, D) Confluence rates of VCaP (C) or DU145 (D) cells treated as indicated were measured by IncuCyte. (E) Comparison of cell morphology of VCaP and DU145, untreated or treated with 50 μM of indicated peptide for four days. (F) Evaluation of RI-EIPs target engagement in VCaP cells after the treatment of RI-EIP1 for three hours was analyzed over temperature shift from 42°C to the indicated temperatures. The presence of the target ERG protein in the soluble fraction of the cell lysates was detected by Western blot analysis. (G) Isothermal dose-response fingerprint at 50°C in VCaP cells shows levels of soluble ERG protein at varying concentrations of RI-EIPs. (H, I) Immunoblot analysis of ERG, AR, and GAPDH from VCaP cells treated with RI-EIP1 or RI-muEIP1 with 20 μM at indicated time points (H) and for 48 hr at indicated concentrations (I). (J) Immunoblot analysis of ERG and GAPDH from VCaP cells treated with or without RI-EIP1. Where indicated, 50 μg/ml cycloheximide (CHX) was added, and cells were harvested at the indicated time points. (K) ERG protein abundance in (J) was quantified by ImageJ and plotted as indicated. (L) Immunoblot analysis of ERG, AR, and GAPDH from VCaP cells treated with 20 μM RI-EIP1 or RI-muEIP1 for 48 hours with and without proteasome inhibitor carfilzomib (100 nM). (M) The degradation analysis of 3020 proteins as mean ratio from three replicates of each protein, represented by a black spot (n = 3). The y axis represents p value (−log10 transformed) derived from t test across three biological replicates for each protein compared with the biological replicates of negative control proteins. The relative fold change is shown on the × axis as the log10 ratio RI-EIP1/RI-muEIP1. Proteins with a p<0.01 and a fold change <−1.5 are overlaid by the blue box. The top most degraded proteins are labeled by arrows. All error bars represent ± SEM. See also Figure S4.
Figure 5
Figure 5. Retroinverso EIPs specifically inhibit ERG binding to target loci, disrupting ERG transcriptional activity
(A) ChIP-seq using the ERG antibody was performed in VCaP cells treated with 50 μM RI-EIP1 or RI-muEIP1 for 12 hours. Normalized ERG signal profiles for RI-EIP and RI-muEIP1 treated groups were calculated at the summit of the most significant ERG peaks (4th quartile) in the RI-muEIP1 sample. (B) Heatmap representation of ERG binding peaks in both RI-EIP1 and RI-muEIPs treatment groups. Genomic target regions are rank-ordered based on the level of ERG enrichment at each ERG binding sites between −400bp and +400bp flanking genomic region. (C) Representative ChIP-seq profile at ERG target gene loci. The y-axis denotes reads per million per base pair (rpm/bp); x-axis denotes the genomic position. (D) Venn diagram illustrating the overlap of disregulated genes (greater than 2-fold, FDR<0.01) between siERG- and RI-EIP1-treated VCaP cells and between siPCAT29- and RI-EIP1-treated VCaP cells. (E) Heatmap from microarray analysis of ERG knockdown by siERG or RI-EIP1 treatment in VCaP cells, comparing gene expression changes upon siERG knockdown and RI-EIP1 treatment. (F) Gene Set Enrichment Analysis (GSEA) of the down-regulated genes (VCAP_RI-EIP1_DN) by RI-EIP1 versus ERG knockdown in VCaP cells. NES, normalized enrichment score; FDR, false discovery rate. (G) The relative expression of several ERG target genes in VCaP upon RI-EIP1 treatment assessed by quantitative PCR. For all experiments, mean ± SEM is shown. See also Figure S5.
Figure 6
Figure 6. RI-EIPS have no effects on ERG-mediated angiogenesis
(A) Biotin-EIP1 or biotin-muEIP was incubated with the cell lysates and eluates from the pull-downs were subjected to immunoblot analysis using an anti-ERG antibody. (B) Pulldown assay as in (A) with varying amounts of cell lysates as indicated. (C) Representative microphotographs of a 3D culture of human umbilical vein endothelial cells (HUVEC) (scale bar, 2.0 m) in the presence of inhibitors or siRNA as indicated. The bar graphs present the number of tubes/area of cells analyzed by ImageJ software. The average lengths were calculated for each transductant from microphotographs captured in duplicate experiments performed. (D) Effect of RI-peptides or retinoic acid (RA, a known inhibitor of angiogenesis) on VEGF-induced angiogenesis assessed by chorioallantoic membrane assay. The bar graphs represent the angiogenic index by counting vessel branch points using ImageJ software in a double-blinded manner. Data represents the mean of 4 replicates. (E) A representative immunohistochemistry (IHC) image of mouse CD31, an endothelial cell marker in FFPE sections of VCaP xenograft tumors treated with RI-muEIP1 or RI-EIP1 for 24 consecutive days. Scale bar: 10 μm. The dot plots represent the quantitative data of IHC staining. Number of blood vessels was determined in a view area at 200× magnification. Error bars represent ± SEM. **p value < 0.05.
Figure 7
Figure 7. Retroinverso EIPs suppress tumor growth in vivo
(A) Chicken chorioallantoic membrane (CAM) invasion assays were performed using VCaP cells that stably overexpress Cherry Red (red fluorescence emission). The xenografts were treated with a single dose of RI-EIP1 or RI-muEIP1 at 25 mg/kg. At 72 hours post-treatment, the upper CAM was harvested and the frozen sections were stained for chicken-specific type IV collagen (green fluorescence). Yellow arrowheads indicate invaded cells through the upper CAM. White dotted line indicates CAM basement membrane. Scale bar: 200 μm. (B, C) CAM intravasation (B) and lung metastasis (C) assays were performed on VCaP CAM xenografts. Total cell number was determined using a standard curve generated by varying amounts of VCaP cells as input. Y-axis shows the relative cell numbers normalized by RI-muEIP1-treated CAM group. **p<0.05. (D) VCaP-xenografted mice were treated with RI-EIP1 or RI-muEIP1 at indicated doses for 18 consecutive days. Average tumor volume (in mm3) was measured by Caliper every three days. Inset shows the representative VCaP tumors treated by RI-EIP1 or RI-muEIP1. (E) Kaplan–Meier survival data plotted as percent of animals surviving in each group using a predefined cutoff tumor volume of 1,500 mm3. (F) PC3-xenografts mice were treated with 25 mg/kg RI-EIP1 or RI-muEIP1, and average tumor volume was calculated as in (D). (G) An ETV1-positive human primary prostate cancer serial xenograft was treated as in (D). (H) Immunoblot analysis of ERG, DNA-PKcs, and GAPDH in VCaP xenograft tumors treated with 25 mg/kg RI-EIP1 or RI-muEIP1 24 hours after the final treatment in (D). (I) Schematic depicting the mechanisms of EIPs therapeutically targeting TMPRSS2:ERG fusion products in prostate cancer. 1. In cells, EIPs immediately bind to ERG upon addition of the peptides, inducing a conformational change in the ERG protein, consequently blocking its interaction with co-factors and attenuating DNA binding. 2. In this disrupted state, the ERG protein is targeted for proteolytic degradation, thereby inhibiting cell invasion, proliferation, and tumor growth in vivo. For all experiments, mean ± SEM is shown. See also Figure S6.

Comment in

Similar articles

Cited by

References

    1. Albihn A, Johnsen JI, Henriksson MA. MYC in oncogenesis and as a target for cancer therapies. Adv Cancer Res. 2010;107:163–224. - PubMed
    1. An J, Ren S, Murphy SJ, Dalangood S, Chang C, Pang X, Cui Y, Wang L, Pan Y, Zhang X, et al. Truncated ERG Oncoproteins from TMPRSS2-ERG Fusions Are Resistant to SPOP-Mediated Proteasome Degradation. Molecular cell. 2015;59:904–916. - PubMed
    1. Asangani IA, Dommeti VL, Wang X, Malik R, Cieslik M, Yang R, Escara-Wilke J, Wilder-Romans K, Dhanireddy S, Engelke C, et al. Therapeutic targeting of BET bromodomain proteins in castration-resistant prostate cancer. Nature. 2014;510:278–282. - PMC - PubMed
    1. Attard G, Swennenhuis JF, Olmos D, Reid AH, Vickers E, A’Hern R, Levink R, Coumans F, Moreira J, Riisnaes R, et al. Characterization of ERG, AR and PTEN gene status in circulating tumor cells from patients with castration-resistant prostate cancer. Cancer Res. 2009;69:2912–2918. - PubMed
    1. Barbieri CE, Baca SC, Lawrence MS, Demichelis F, Blattner M, Theurillat JP, White TA, Stojanov P, Van Allen E, Stransky N, et al. Exome sequencing identifies recurrent SPOP, FOXA1 and MED12 mutations in prostate cancer. Nature genetics. 2012;44:685–689. - PMC - PubMed

Publication types

MeSH terms