

Investigation of the in vitro performance difference of drug-Soluplus® and drug-PEG 6000 dispersions when prepared using spray drying or lyophilization
- PMID: 28344498
- PMCID: PMC5357108
- DOI: 10.1016/j.jsps.2016.09.013
Investigation of the in vitro performance difference of drug-Soluplus® and drug-PEG 6000 dispersions when prepared using spray drying or lyophilization
Abstract
Purpose: To evaluate the physicochemical and in vitro characteristics of solid dispersions using BCS II model drugs with Soluplus® and one of its component homopolymers, PEG 6000.
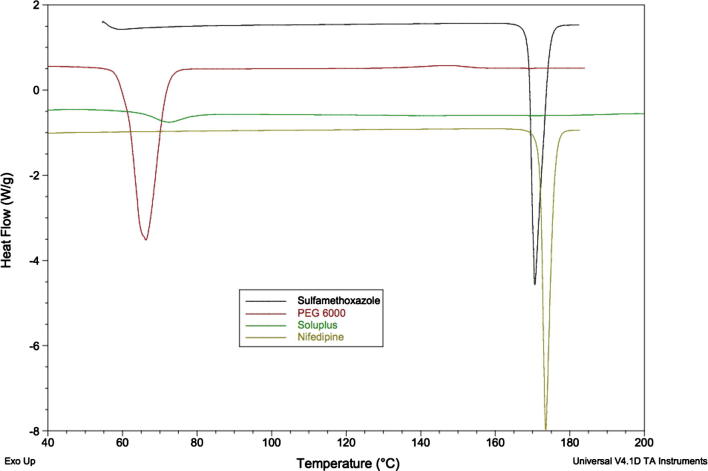
Methods: Nifedipine (NIF) and sulfamethoxazole (SMX) of 99.3% and 99.5% purity, respectively, were selected as BCS II model drugs, such that an improved dissolution rate and concentration in the gastrointestinal tract should increase oral bioavailability. Soluplus® is an amorphous, tri-block, graft co-polymer with polyvinyl caprolactam, polyvinyl acetate, and polyethylene glycol (PCL:PVAc:PEG6000) in the ratio 57:30:13. PEG 6000 (BASF) is a waxy material with melting point of about 60 °C. Solid dispersions were prepared using lyophilization or spray drying techniques. Dissolution study, crystallinity content, and analysis for new chemical bond formation have been used to evaluate the dispersed materials.
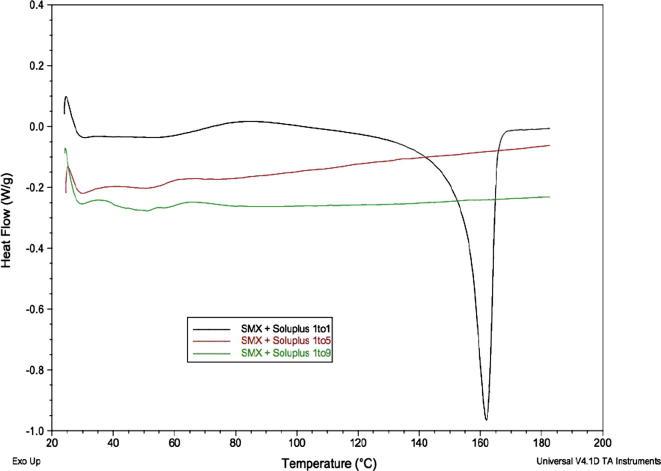
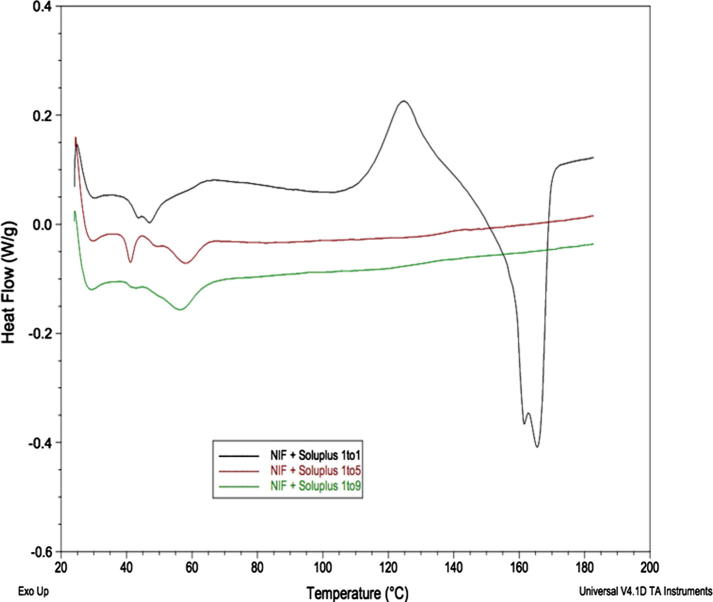
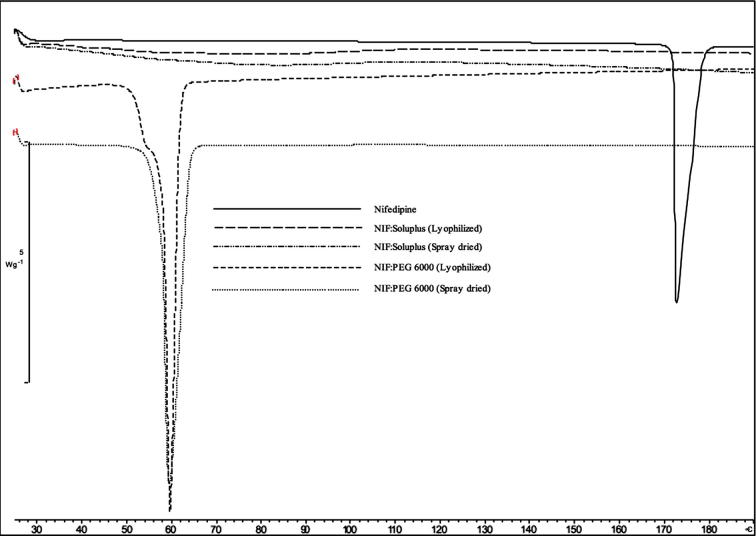
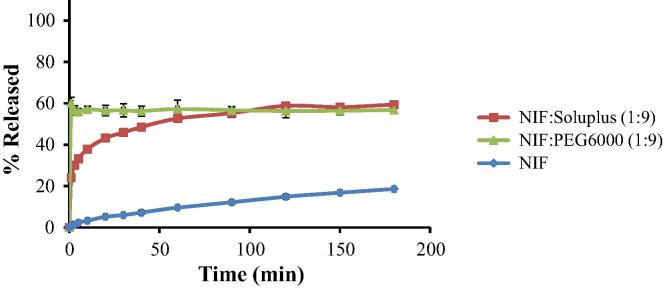
Results: Although each polymer improved the drug dissolution rate, dissolution from Soluplus® was slower. Enhanced dissolution rates were observed with NIF solid dispersions, but the dissolution profiles were quite different due to the selected technique, polymer, and dissolution medium. For SMX, there was similarity across the dissolution profiles despite the medium, polymer, or applied technique. Each polymer was able to maintain an elevated drug concentration over the three hour duration of the dissolution profile, i.e., supersaturation was supported by the polymer. DSC thermograms revealed no melting endotherm, suggesting that the drug is amorphous or molecularly dispersed.
Conclusion: NIF and SMX solid dispersions were successfully prepared by spray drying and lyophilization using Soluplus® or PEG 6000. Each polymer enhanced the drug dissolution rate; NIF dissolution rate was improved to a greater extent. Dispersions with PEG 6000 had a faster dissolution rate due to its hydrophilic nature. DSC analysis showed that no crystalline material exists in the dispersions.
Keywords: Dissolution; Lyophilization; Nifedipine; PEG 6000; Solid dispersion; Soluplus®; Spray drying; Sulfamethoxazole.
Figures


Similar articles
-
Molecular interaction between glimepiride and Soluplus®-PEG 4000 hybrid based solid dispersions: Characterisation and anti-diabetic studies.Int J Pharm. 2015 Dec 30;496(2):741-50. doi: 10.1016/j.ijpharm.2015.11.007. Epub 2015 Nov 12. Int J Pharm. 2015. PMID: 26581773
-
Solubility and dissolution performances of spray-dried solid dispersion of Efavirenz in Soluplus.Drug Dev Ind Pharm. 2017 Jan;43(1):42-54. doi: 10.1080/03639045.2016.1205598. Epub 2016 Jul 17. Drug Dev Ind Pharm. 2017. PMID: 27349377
-
Preparation and characterization of celecoxib dispersions in soluplus(®): comparison of spray drying and conventional methods.Iran J Pharm Res. 2015 Winter;14(1):35-50. Iran J Pharm Res. 2015. PMID: 25561910 Free PMC article.
-
Kollidon® VA 64 and Soluplus® as modern polymeric carriers for amorphous solid dispersions.Polim Med. 2022 Jan-Jun;52(1):19-29. doi: 10.17219/pim/150267. Polim Med. 2022. PMID: 35766434 Review.
-
Improved dissolution behavior of lipophilic drugs by solid dispersions: the production process as starting point for formulation considerations.Expert Opin Drug Deliv. 2011 Sep;8(9):1121-40. doi: 10.1517/17425247.2011.598147. Epub 2011 Jul 2. Expert Opin Drug Deliv. 2011. PMID: 21722000 Review.
Cited by
-
Fast In Vitro Release and In Vivo Absorption of an Anti-Schizophrenic Drug Paliperidone from Its Soluplus®/TPGS Mixed Micelles.Pharmaceutics. 2022 Apr 19;14(5):889. doi: 10.3390/pharmaceutics14050889. Pharmaceutics. 2022. PMID: 35631475 Free PMC article.
-
Composites of N-butyl-N-methyl-1-phenylpyrrolo[1,2-a]pyrazine-3-carboxamide with Polymers: Effect of Crystallinity on Solubility and Stability.Int J Mol Sci. 2023 Jul 30;24(15):12215. doi: 10.3390/ijms241512215. Int J Mol Sci. 2023. PMID: 37569589 Free PMC article.
-
In vitro dissolution and bioavailability study of furosemide nanosuspension prepared using design of experiment (DoE).Saudi Pharm J. 2019 Jan;27(1):96-105. doi: 10.1016/j.jsps.2018.09.002. Epub 2018 Sep 3. Saudi Pharm J. 2019. PMID: 30662312 Free PMC article.
-
Amorphous Solid Dispersion of Epigallocatechin Gallate for Enhanced Physical Stability and Controlled Release.Pharmaceuticals (Basel). 2017 Nov 9;10(4):88. doi: 10.3390/ph10040088. Pharmaceuticals (Basel). 2017. PMID: 29120370 Free PMC article.
-
Overview of the Manufacturing Methods of Solid Dispersion Technology for Improving the Solubility of Poorly Water-Soluble Drugs and Application to Anticancer Drugs.Pharmaceutics. 2019 Mar 19;11(3):132. doi: 10.3390/pharmaceutics11030132. Pharmaceutics. 2019. PMID: 30893899 Free PMC article. Review.
References
-
- Abdelwahed W., Degobert G., Stainmesse S., Fessi H. Freeze-drying of nanoparticles: formulation, process and storage considerations. Adv. Drug Deliv. Rev. 2006;58(15):1688–1713. - PubMed
-
- Altamimi M.A., Neau S.H. Use of the Flory-Huggins theory to predict the solubility of nifedipine and sulfamethoxazole in the triblock, graft copolymer Soluplus. Drug Dev. Ind. Pharm. 2016;42(3):446–455. - PubMed
-
- Baird J.A., Van Eerdenbrugh B., Taylor L.S. A classification system to assess the crystallization tendency of organic molecules from undercooled melts. J. Pharm. Sci. 2010;99(9):3787–3806. - PubMed
-
- Chan K.L.A., Fleming O.S., Kazarian S.G., Vassou D., Chryssikos G.D., Gionis V. Polymorphism and devitrification of nifedipine under controlled humidity: a combined FT-Raman, IR and Raman microscopic investigation. J. Raman Spectrosc. 2004;35(5):353–359.
LinkOut - more resources
Full Text Sources
Other Literature Sources
