

Assessment of REPLI-g Multiple Displacement Whole Genome Amplification (WGA) Techniques for Metagenomic Applications
- PMID: 28344519
- PMCID: PMC5363268
- DOI: 10.7171/jbt.17-2801-008
Assessment of REPLI-g Multiple Displacement Whole Genome Amplification (WGA) Techniques for Metagenomic Applications
Erratum in
-
[No title available]J Biomol Tech. 2017 Jul;28(2):96. doi: 10.7171/jbt.17-2801-008CX. Epub 2017 Jun 8. J Biomol Tech. 2017. PMID: 28630600 Free PMC article.
Abstract
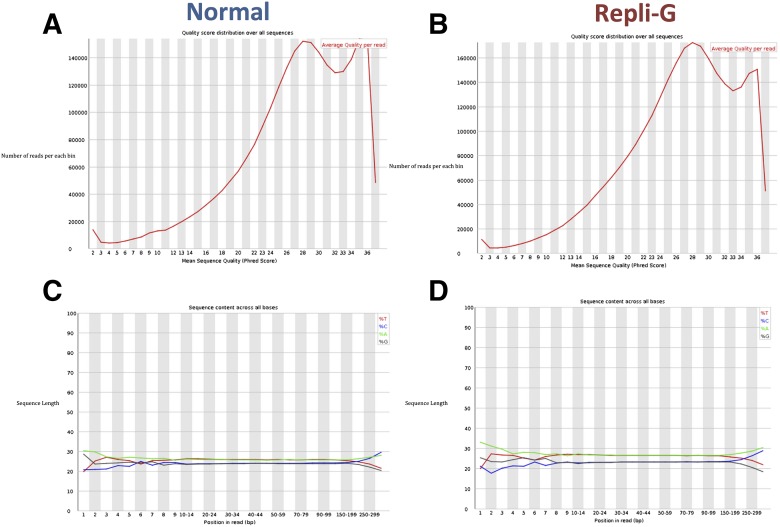
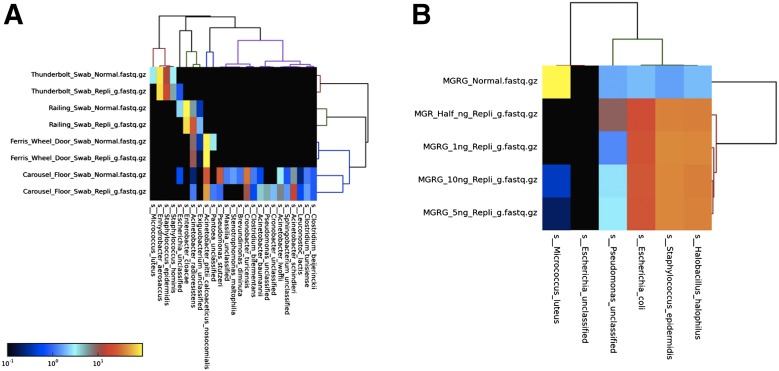
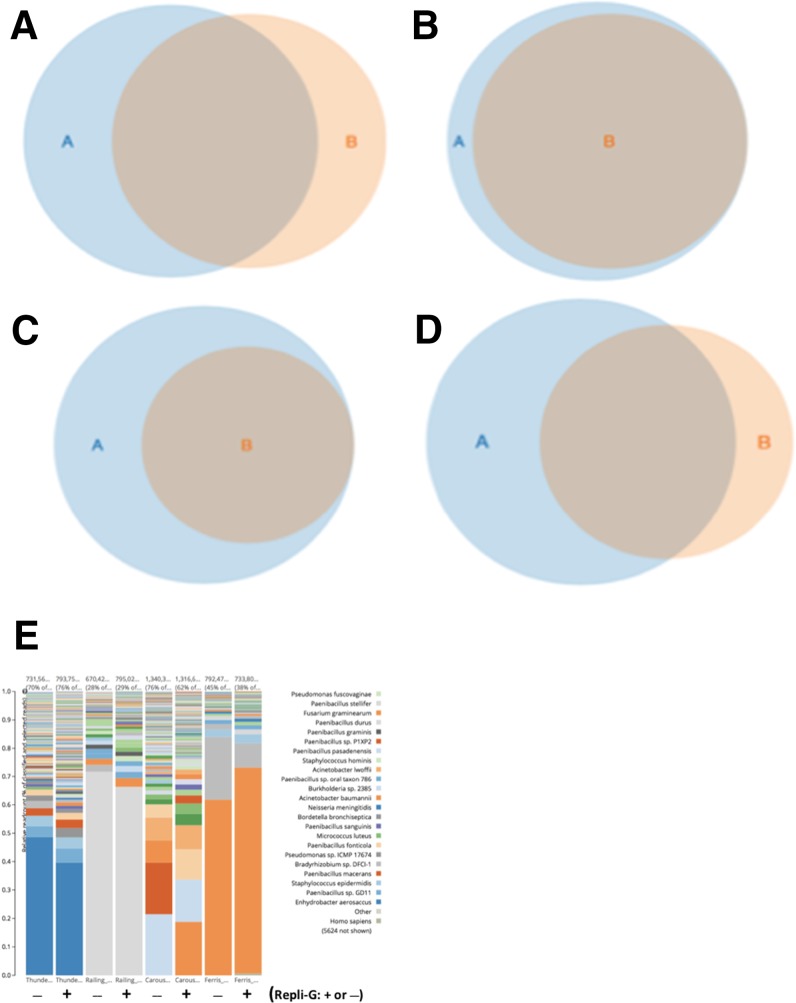
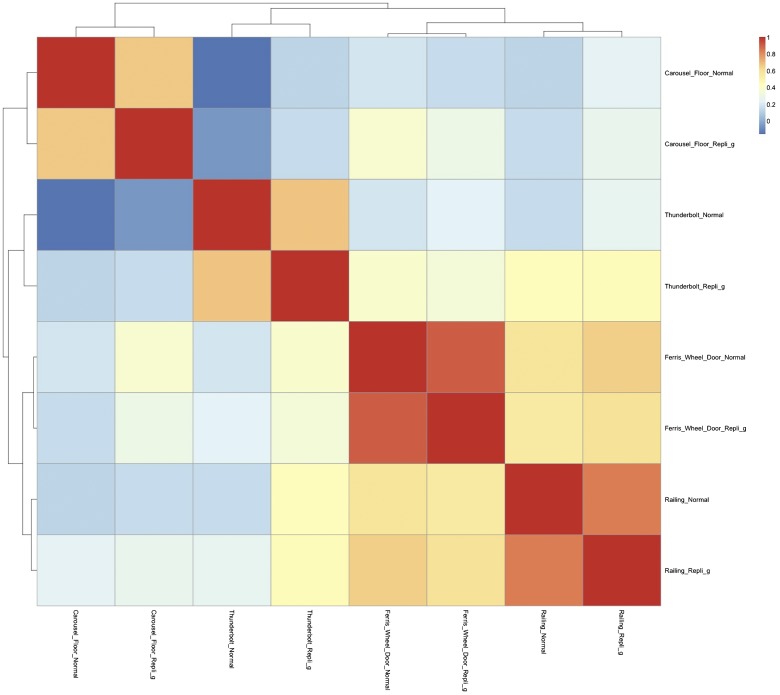
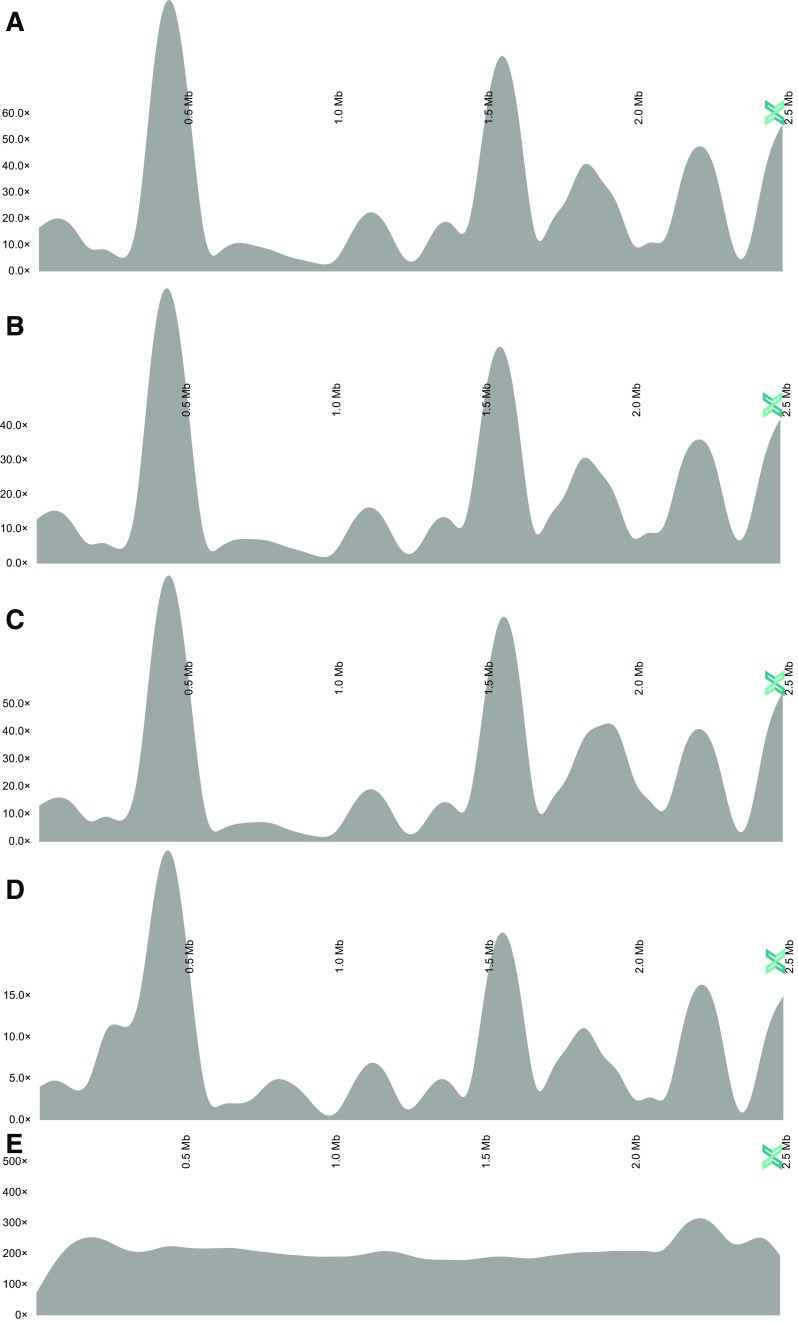
Amplification of minute quantities of DNA is a fundamental challenge in low-biomass metagenomic and microbiome studies because of potential biases in coverage, guanine-cytosine (GC) content, and altered species abundances. Whole genome amplification (WGA), although widely used, is notorious for introducing artifact sequences, either by amplifying laboratory contaminants or by nonrandom amplification of a sample's DNA. In this study, we investigate the effect of REPLI-g multiple displacement amplification (MDA; Qiagen, Valencia, CA, USA) on sequencing data quality and species abundance detection in 8 paired metagenomic samples and 1 titrated, mixed control sample. We extracted and sequenced genomic DNA (gDNA) from 8 environmental samples and compared the quality of the sequencing data for the MDA and their corresponding non-MDA samples. The degree of REPLI-g MDA bias was evaluated by sequence metrics, species composition, and cross-validating observed species abundance and species diversity estimates using the One Codex and MetaPhlAn taxonomic classification tools. Here, we provide evidence of the overall efficacy of REPLI-g MDA on retaining sequencing data quality and species abundance measurements while providing increased yields of high-fidelity DNA. We find that species abundance estimates are largely consistent across samples, even with REPLI-g amplification, as demonstrated by the Spearman's rank order coefficient (R2 > 0.8). However, REPLI-g MDA often produced fewer classified reads at the species, genera, and family level, resulting in decreased species diversity. We also observed some areas with the PCR "jackpot effect," with varying input DNA values for the Metagenomics Research Group (MGRG) controls at specific genomic loci. We visualize this effect in whole genome coverage plots and with sequence composition analyses and note these caveats of the MDA method. Despite overall concordance of species abundance between the amplified and unamplified samples, these results demonstrate that amplification of DNA using the REPLI-g method has some limitations. These concerns could be addressed by future improvements in the enzymes or methods for REPLI-g to be considered a >99% robust method for increasing the amount of high-fidelity DNA from low-biomass samples or at the very least, accounted for during computational analysis of MDA samples.
Keywords: REPLI-g; jackpot effect; metagenomics; next-generation sequencing; whole genome amplification.
Figures
References
-
- Hutchison III CA, Venter JC. Single-cell genomics. Nat Biotechnol 2006;24:657–658. - PubMed
-
- Gonzalez JM, Portillo MC, Saiz-Jimenez C. Multiple displacement amplification as a pre-polymerase chain reaction (pre-PCR) to process difficult to amplify samples and low copy number sequences from natural environments. Environ Microbiol 2005;7:1024–1028. - PubMed
Publication types
MeSH terms
Substances
Grants and funding
LinkOut - more resources
Full Text Sources
Other Literature Sources
Miscellaneous