. 2017 Jan 9;6(2):e1258504.
doi: 10.1080/2162402X.2016.1258504. eCollection 2017.

CD13hi Neutrophil-like myeloid-derived suppressor cells exert immune suppression through Arginase 1 expression in pancreatic ductal adenocarcinoma

Affiliations

CD13hi Neutrophil-like myeloid-derived suppressor cells exert immune suppression through Arginase 1 expression in pancreatic ductal adenocarcinoma

Jing Zhang et al. Oncoimmunology. .

Abstract

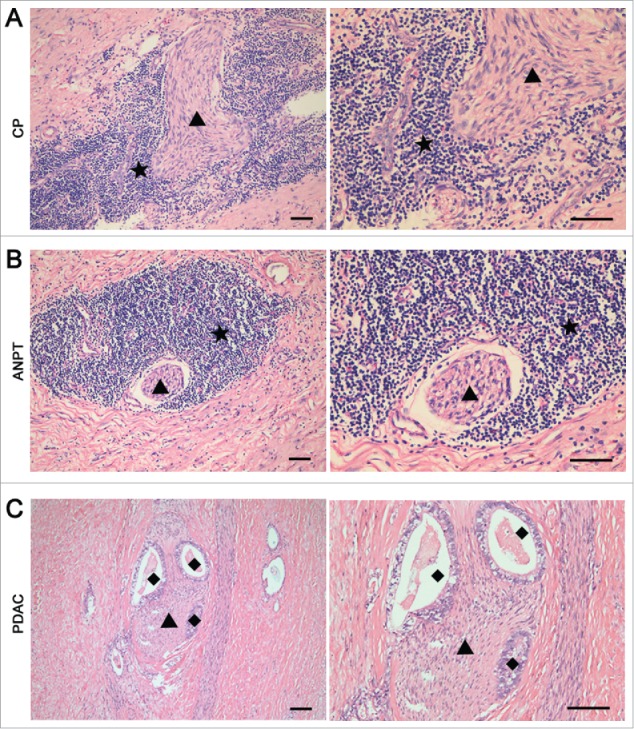
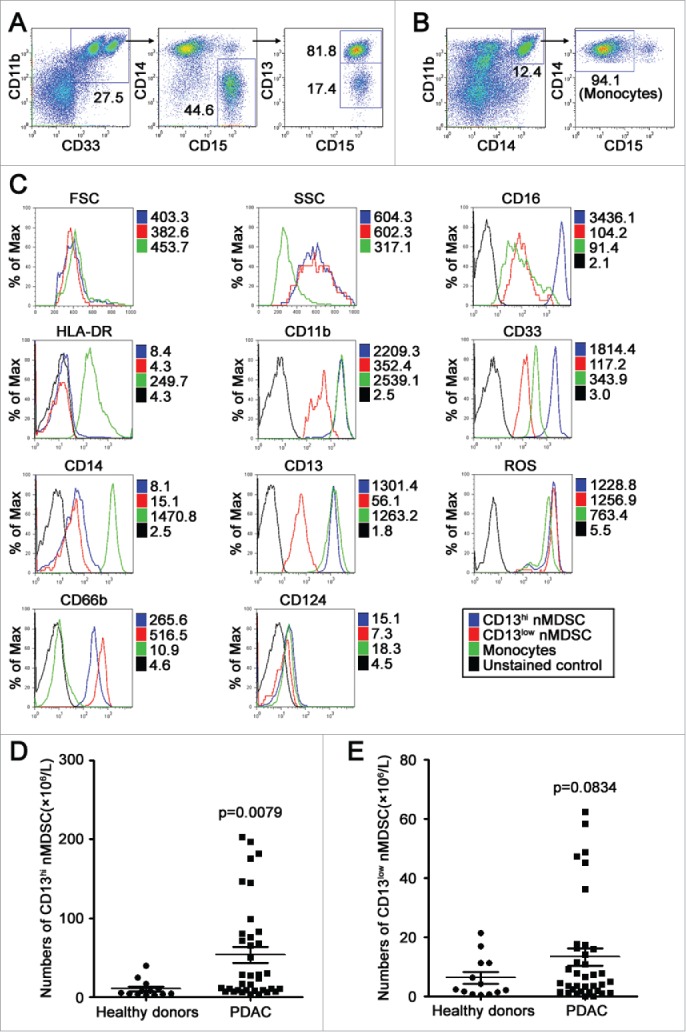
Perineural invasion and immunosuppressive tumor microenvironment are the distinct features of pancreatic ductal adenocarcinoma (PDAC). Heterogeneous myeloid-derived suppressor cells (MDSCs) are potent suppressors of antitumor immunity, posing obstacles for cancer immunotherapy. Increasing evidences have demonstrated the accumulation of MDSCs in PDAC patients. However, the role of MDSCs in perineural invasion of PDAC and the existence of novel MDSC subsets during PDAC remain unclear. This study found that lymphocytic perineural cuffs were frequently present in chronic pancreatitis (CP) tissues and adjacent non-neoplastic pancreatic tissues (ANPTs), but not in PDAC with perineural invasion. Meanwhile, we found that neutrophil-like MDSCs (nMDSCs), but not monocyte-like MDSCs (mMDSCs), were significantly increased in PBMCs and tumor tissues of PDAC patients. Further observation identified two distinct subsets of nMDSCs, CD13hi and CD13low nMDSCs in PDAC patients, which have not been reported previously. Despite a similar morphology, CD13hi nMDSCs expressed higher levels of CD11b, CD33, CD16 and arginase 1 but lower levels of CD66b than CD13low nMDSCs. Importantly, CD13hi MDSCs, compared with CD13low nMDSCs, more effectively suppressed alloreactive T cell responses via an arginase-1-related mechanism. After tumor resection, the circulating CD13hi nMDSCs were decreased markedly. PDAC patients with more CD13hi nMDSCs had a shorter overall survival than those with less CD13hi nMDSCs. To conclude, we identified two novel MDSC subsets with different characteristics and functions in PDAC, demonstrated the association of the two MDSC subsets with cancer progression, and explored their roles in perineural invasion and immune escape of PDAC.

Keywords: Immune escape; myeloid-derived suppressor cells; pancreatic ductal adenocarcinoma; tumor microenvironment.


Figures

Figure 1.
Figure 1.
Pathological changes in chronic pancreatitis, ANPT and PDAC tissues. Pathological changes in chronic pancreatitis (CP), ANPT and PDAC tissues were analyzed by H&E staining. Perineural cuffs containing inflammatory immune cells (indicated by star) were prominent in CP (A) and ANPT tissues (B). Such perineural cuffs were absent in PDAC tissues with perineural invasion (C). The triangle indicates the nerve branch and the square in C indicates the invading cancer cells. Scale bar = 100 μm.
Figure 2.
Figure 2.
Analysis of MDSCs in tumor tissues and PBMC of patients with PDAC. (A) In situ immunofluorescence analysis of CD11b+ CD33+ myeloid-derived suppressor cells in PDAC tissues. Double immunofluorescence staining for CD11b (green) and CD33 (red) and merged images (yellow). Scale bar = 50 μm. (B) CD11b+ CD33+ MDSCs in various tissues including normal pancreatic tissues of PDAC (n = 30), CP tissues (n = 10), ANPT (n = 30) and PDAC tissue (n = 30) were counted and the data were shown as mean ± SD and statistically analyzed by ANOVA. (C, D) The numbers of MDSCs was examined in the PB of patients with PDAC and in healthy donors by multi-parameter flow cytometry. PBMCs were obtained from patients with PDAC (n = 36) and from healthy donors (n = 13), and then stained for MDSCs using fluorochrome-labeled antibodies against CD11b, CD14, HLA-DR, CD33 and CD15. Monocyte-like MDSCs were defined as the CD11b+ CD14+ HLA-DR−/low population and neutrophil-like MDSCs were defined as the CD11b+ CD33+ CD14 CD15+ population in phenotype. (C) Representative multi-parameter dot plots of monocyte-like MDSCs are shown as CD11b+ CD14+ HLA-DR−/low population in PBMCs from healthy donors and from patients with PDAC. Numbers in plots indicate the percentages of gated populations and the percentages in bracket indicate the frequency of monocyte-like MDSCs in PBMCs. The numbers of monocyte-like MDSCs in PBMCs were calculated as “the frequency of cells in PBMCs × (the numbers of WBC cells in blood − the numbers of granulocytes in blood).” The numbers of monocyte-like MDSCs in PBMCs from healthy donors was compared with those from patients with PDAC and the data was statistically analyzed by unpaired t test. (D) Representative multi-parameter dot plots of neutrophil-like MDSCs are shown as CD11b+ CD33+ CD14 CD15+ population in PBMCs from healthy donors and from patients with PDAC. Numbers in plots indicate the percentages of gated populations and the percentages in bracket indicate the frequency of neutrophil-like MDSCs in PBMCs. The numbers of neutrophil-like MDSCs in PBMCs were calculated as “the frequency of cells in PBMCs × (the numbers of WBC cells in blood − the numbers of granulocytes in blood).” The numbers of neutrophil-like MDSCs in PBMCs from healthy donors was compared with that from patients with PDAC and the data was statistically analyzed by unpaired t test. (E) Representative multi-parameter dot plots of neutrophil-like MDSCs (nMDSCs) are shown as CD45+ HLA-DR CD11b+ CD33+ CD14 CD15+ population in purified tissue-infiltrating immune cells from CP tissues (n = 8) and PDAC tumor tissues (n = 10). Numbers in plots indicate the percentages of gated populations and the percentages in bracket indicate the frequency of neutrophil-like MDSCs in tissue-infiltrating immune cells. (F) nMDSCs in tissue-infiltrating immune cells from normal pancreatic tissues of PDAC (n = 10), CP tissues (n = 8) and PDAC tumor tissue (n = 10) were calculated as “(the frequency of cells in tissue-infiltrating immune cells × the numbers of isolated tissue-infiltrating immune cells)/the weight of tissue for cell isolation” and the data were shown as mean ± SEM and statistically analyzed by ANOVA.
Figure 3.
Figure 3.
Phenotype and identification of neutrophil-like MDSC subsets in PBMC of patients with PDAC. (A) Phenotype of neutrophil-like MDSCs (nMDSCs) in PBMC of patients with PDAC was analyzed by multi-parameter flow cytometry. PBMCs were obtained from patients with PDAC, and then stained using fluorochrome-labeled antibodies against CD11b, CD14, HLA-DR, CD33, CD15, CD13 (one of neutrophil markers) and CD16. Representative multi-parameter dot plots of CD13 expression of nMDSCs from patients with PDAC are shown. nMDSCs can be divided into two subsets including CD13hi and CD13low nMDSCs according to CD13 expression. Numbers in plots indicate the percentages of gated populations. (B) Monocytes in PBMC of patients with PDAC were defined as CD14hi CD11bhi CD15 population. Representative dot plots of monocytes in PBMC of patients with PDAC are shown. Numbers in plots indicate the percentages of gated populations. (C) Three populations including monocytes, CD13hi nMDSCs and CD13low nMDSCs in PBMC of patients with PDAC are compared in phenotype. Representative histograms of several markers expression including FSC/SSC, CD11b, CD33, CD16, HLA-DR, CD13, CD66b, CD124, ROS and CD14 are shown. Numbers in the right of histograms indicate gMFI of several markers expression. (D and E) The numbers of nMDSC subsets in PBMCs were calculated as “the frequency of cells in PBMCs × (the numbers of WBC cells in blood − the numbers of granulocytes in blood).” The numbers of CD13hi nMDSCs (D) or CD13low nMDSCs (E) in PBMCs from healthy donors (n = 13) were compared with those from patients with PDAC (n = 36) and the data was statistically analyzed by unpaired t test.
Figure 4.
Figure 4.
Identification of neutrophil-like MDSC subsets in tumor tissues of patients with PDAC. (A) Representative multi-parameter dot plots of CD45+ HLA-DR CD11b+ CD33+ CD14 CD15+ CD13hi nMDSCs or CD13low nMDSCs are shown in purified tissue-infiltrating immune cells from CP tissues (n = 8) and PDAC tumor tissues (n = 10). Numbers in plots indicate the percentages of gated populations and the percentages in bracket indicate the frequency of nMDSC subsets in tissue-infiltrating cells. (B) nMDSC subsets in tissue-infiltrating immune cells from normal pancreatic tissues of PDAC (n = 10), CP tissues (n = 8) and PDAC tumor tissue (n = 10) were calculated as “(the frequency of cells in tissue-infiltrating immune cells × the numbers of isolated tissue-infiltrating immune cells)/the weight of tissue for cell isolation” and the data were shown as mean ± SEM and statistically analyzed by ANOVA.
Figure 5.
Figure 5.
Properties of two neutrophil-like MDSC subsets in PBMC of patients with PDAC. PBMCs were obtained from patients with PDAC, and stained using fluorochrome-labeled antibodies against CD11b, CD14, CD33, CD15 and CD13. Then, three populations including CD11bhi CD14hi CD15 monocytes (Mono), CD11b+ CD33+ CD14 CD15+ CD13hi nMDSCs (Hi) and CD11b+ CD33+ CD14 CD15+ CD13low nMDSCs (Low) in PBMC of patients with PDAC are sorted by Moflo. (A) Representative cytospin images of sorted monocytes and nMDSCs with Wright-Giemsa staining are shown (Scale bars = 50 μm). (B and C) Expression of Arg 1 and β-actin are detected for by Western blot in sorted cells. Representative images are shown (B) and expression levels of Arg 1 protein are normalized by β-actin (C). Data are shown as a representative of three independent experiments. (D) Sorted cells are stimulated with or without 500 ng/mL LPS for 24 h, and then supernatants are collected and assayed for cytokine production by CBA assays. Data are shown as mean ± SD of triplicate cultures of one representative experiment. Similar results are obtained in three independent experiments. **p < 0.01 vs. respective “Ctrl” group; #p < 0.01 between “Hi” group and “Low” group after LPS stimulation.
Figure 6.
Figure 6.
Immunosuppressive function of neutrophil-like MDSC subsets in PBMC of patients with PDAC. Monocytes, non-specific nMDSCs (MDSCs), CD13hi nMDSCs and CD13low nMDSCs in PBMCs from patients with PDAC are sorted. CD3+ T cells in PBMCs from healthy donor are purified and stained with CFSE. Then, CD3+ T cells are co-cultured with monocytes and/or nMDSCs at the ratio of 10:1 (T cells: monocytes or nMDSCs). In some groups, Arg-1-specific inhibitor nor-NOHA is used. After 7 d, cells are collected and stained with fluorochrome-labeled antibodies against CD4+ and CD8+ for flow cytometry. Representative histograms of CFSE dilution in CD4+ T cells (A) or CD8+ T cells (B) in various groups are shown. Numbers in histograms indicate the percentages of CFSElow cells in CD4+ or CD8+ T cells. (C) The results in triplicate cultures in each group were expressed as proliferating CFSElow T cells (% Mono/T group) and the value in Mono/T group was set as 100%. The data are shown as mean ± SD in one representative experiment and analyzed by ANOVA. Similar results are obtained in three independent experiments. **p < 0.01.
Figure 7.
Figure 7.
Changes of nMDSC subsets in PBMC of PDAC patients after operation and the association between CD13hi nMDSC and OS. The frequencies or numbers of CD13hi and CD13low nMDSCs were quantitated in the PB of patients with PDAC before operation and 7 d after operation by multi-parameter flow cytometry. PBMCs were obtained from patients with PDAC (n = 13), and then stained for MDSCs using fluorochrome-labeled antibodies against CD11b, CD14, CD33, CD15 and CD13. (A) Representative dot plots of CD13hi and CD13low nMDSCs in PBMCs from two patients with PDAC are shown. Numbers in plots indicate the percentages of gated populations and the percentages in bracket indicate the frequency of CD13hi and CD13low nMDSCs in PBMCs. (B and C) The numbers of CD13hi and CD13low nMDSCs in PBMCs from patients with PDAC before operation were compared with that 7 d after operation and the data was statistically analyzed by paired Student's t test. The “before-after” graph and “scatter plot” graph of the data are shown in B and C, respectively. (D) Kaplan–Meier curves for 36 PDAC cases including 15 cases (CD13hi nMDSCs <1%) and 21 cases (CD13hi nMDSCs >1%) were shown. The p value was determined using the log-rank test.

References

    1. Khaled YS, Ammori BJ, Elkord E. Myeloid-derived suppressor cells in cancer: recent progress and prospects. Immunol Cell Biol 2013; 91:493-502; PMID:23797066; http://dx.doi.org/10.1038/icb.2013.29 - DOI - PubMed
    1. Gabrilovich DI, Ostrand-Rosenberg S, Bronte V. Coordinated regulation of myeloid cells by tumours. Nat Rev Immunol 2012; 12:253-68; PMID:22437938; http://dx.doi.org/10.1038/nri3175 - DOI - PMC - PubMed
    1. Ostrand-Rosenberg S, Sinha P. Myeloid-derived suppressor cells: linking inflammation and cancer. J Immunol 2009; 182:4499-506; PMID:19342621; http://dx.doi.org/10.4049/jimmunol.0802740 - DOI - PMC - PubMed
    1. Solito S, Marigo I, Pinton L, Damuzzo V, Mandruzzato S, Bronte V. Myeloid-derived suppressor cell heterogeneity in human cancers. Ann N Y Acad Sci 2014; 1319:47-65; PMID:24965257; http://dx.doi.org/10.1111/nyas.12469 - DOI - PubMed
    1. Greten TF, Manns MP, Korangy F. Myeloid derived suppressor cells in human diseases. Int Immunopharmacol 2011; 11:802-7; PMID:21237299; http://dx.doi.org/10.1016/j.intimp.2011.01.003 - DOI - PMC - PubMed

Publication types