. 2017 Jan 20;6(2):e1273300.
doi: 10.1080/2162402X.2016.1273300. eCollection 2017.

The differentiation and plasticity of Tc17 cells are regulated by CTLA-4-mediated effects on STATs

Affiliations

The differentiation and plasticity of Tc17 cells are regulated by CTLA-4-mediated effects on STATs

Aditya Arra et al. Oncoimmunology. .

Abstract

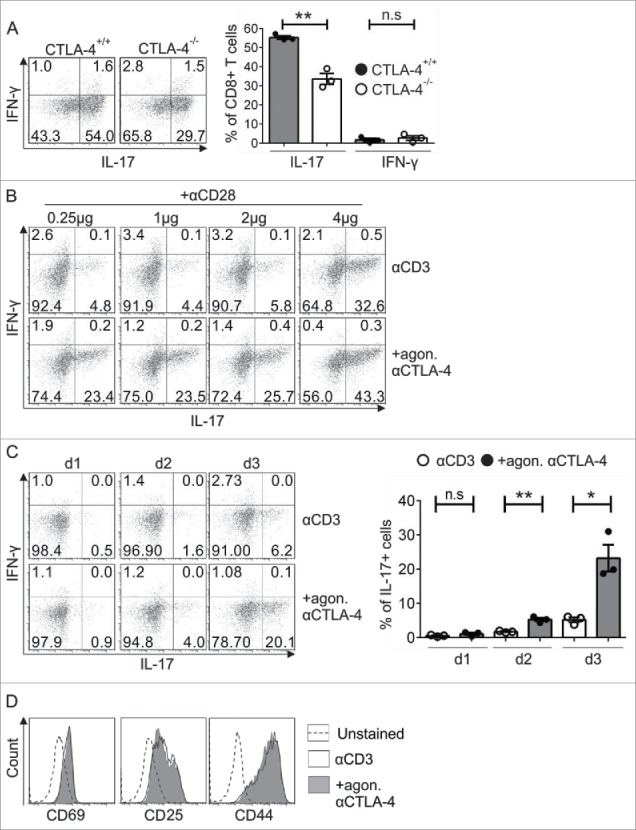
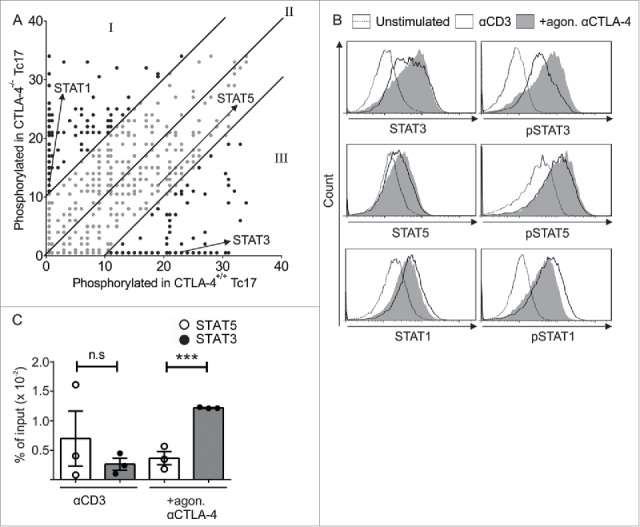
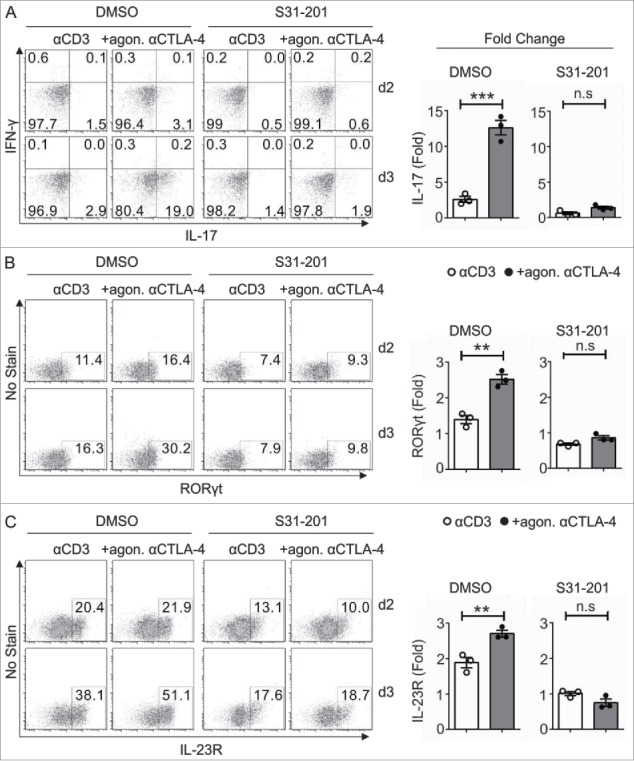
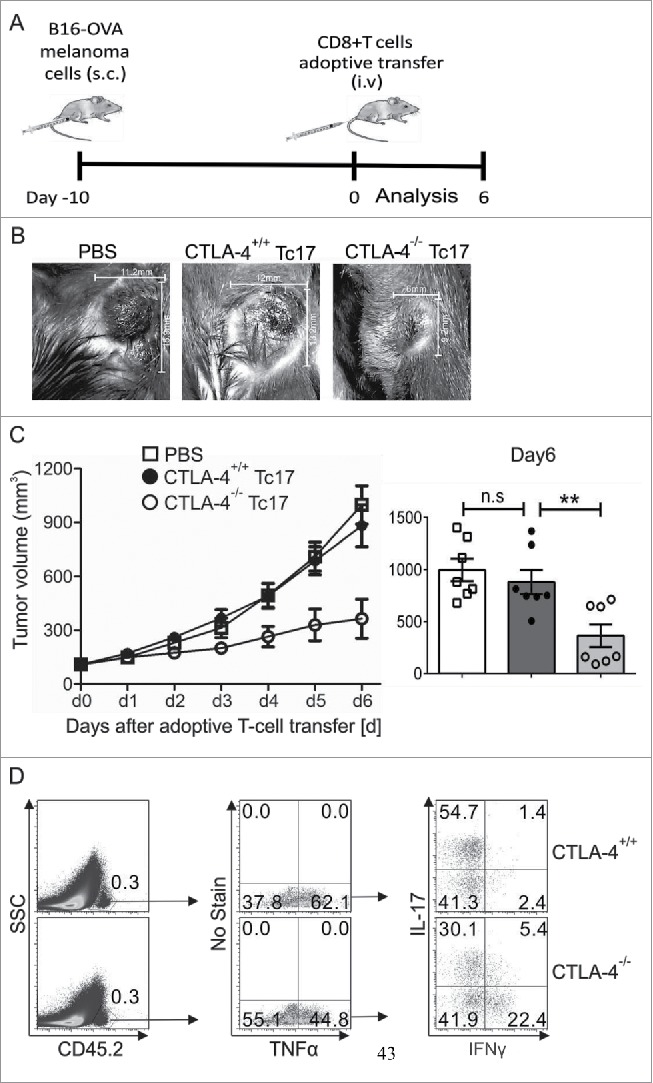
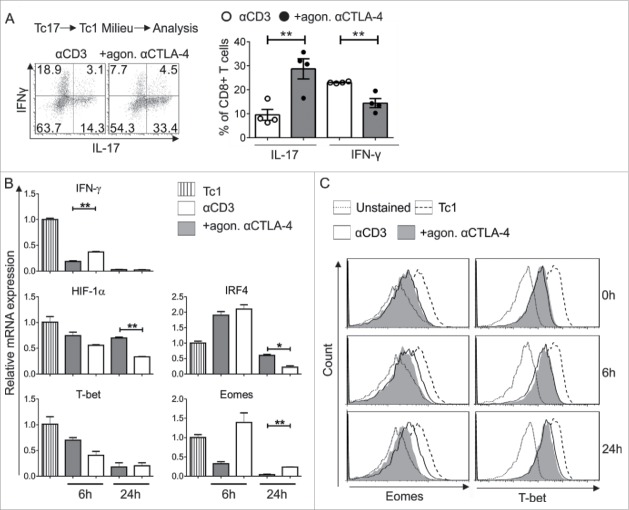
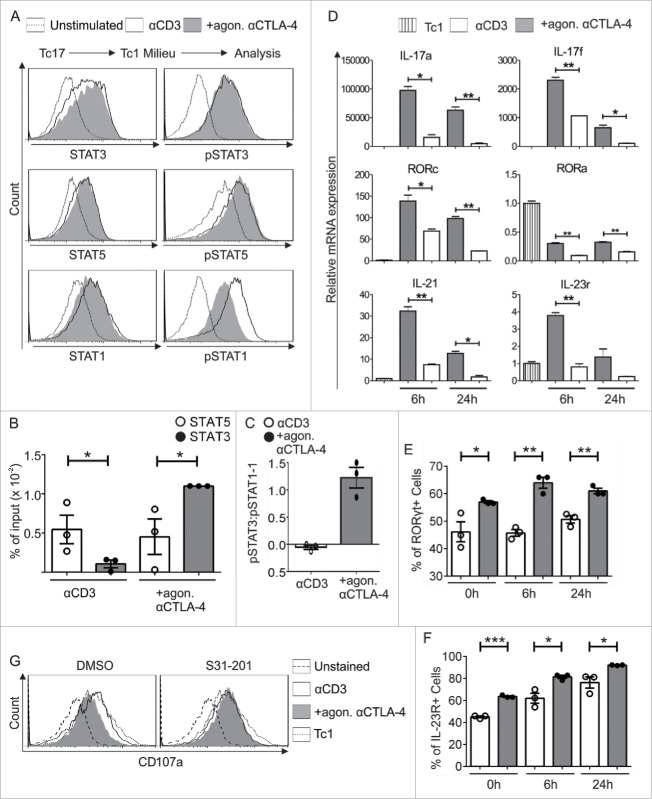
As the blockade of inhibitory surface-molecules such as CTLA-4 on T cells has led to recent advances in antitumor immune therapy, there is great interest in identifying novel mechanisms of action of CD8+ T cells to evoke effective cytotoxic antitumor responses. Using in vitro and in vivo models, we investigated the molecular pathways underlying the CTLA-4-mediated differentiation of IL-17-producing CD8+ T cells (Tc17 cells) that strongly impairs cytotoxicity. Our studies demonstrate that Tc17 cells lacking CTLA-4 signaling have limited production of STAT3-target gene products such as IL-17, IL-21, IL-23R and RORγt. Upon re-stimulation with IL-12, these cells display fast downregulation of Tc17 hallmarks and acquire Tc1 characteristics such as IFNγ and TNF-α co-expression, which is known to correlate with tumor control. Indeed, upon adoptive transfer, these cells were highly efficient in the antigen-specific rejection of established OVA-expressing B16 melanoma in vivo. Mechanistically, in primary and re-stimulated Tc17 cells, STAT3 binding to the IL-17 promoter was strongly augmented by CTLA-4, associated with less binding of STAT5 and reduced relative activation of STAT1 which is known to block STAT3 activity. Inhibiting CTLA-4-induced STAT3 activity reverses enhancement of signature Tc17 gene products, rendering Tc17 cells susceptible to conversion to Tc1-like cells with enhanced cytotoxic potential. Thus, CTLA-4 critically shapes the characteristics of Tc17 cells by regulating relative STAT3 activation, which provides new perspectives to enhance cytotoxicity of antitumor responses.

Keywords: CTL; IFNγ; IL-17; STATs; T cell differentiation; plasticity.


Figures

Figure 1.
Figure 1.
Analysis of the exclusive role of CTLA-4 in Tc17 differentiation. (A) Naive CD8+ T cells from CTLA-4+/+ and CTLA-4−/− OT.1 mice were activated with the specific antigen OVA257–264 in the presence of APCs under Tc17 conditions. IL-17 and IFNγ expression in these cells was analyzed by flow cytometry for 72 h after primary stimulation (left). Cumulative staining results are shown on the right. The data are representative of three independent experiments. (B) CD8+ T cells from C57BL/6JRj mice were stimulated under Tc17 conditions by crosslinking the cells with plate-bound immobilized anti-CD3 (3 μg/mL) and anti-CD28 (0.25–4 µg/mL) in the presence (+agon. αCTLA-4) or absence (αCD3) of immobilized anti-CTLA-4 (10 μg/mL). Three days after the primary stimulation, IL-17 expression in these cells was analyzed by flow cytometry. The data are from one representative experiment. (C) IL-17 and IFNγ expression in CD3-stimulated (3 μg/mL) cells in the presence or absence of CTLA-4 crosslinking (10 μg/mL) was analyzed by flow cytometry every day until day 3. Cumulative staining results are shown on the right. The data are representative of three independent experiments. (D) CD8+ T cells from C57BL/6JRj mice were cultured as in (C) and analyzed for the surface expression of CD69, CD25 and CD44 on day 3 by flow cytometry. The data are from a single experiment that is representative of three independent experiments. The error bars denote ± SEM. **p < 0.01, *p < 0.05, n.s.: not significant, unpaired t-test.
Figure 2.
Figure 2.
CTLA-4-regulated STAT phosphorylation determines Tc17 differentiation. (A) Dot plot representing the phosphorylation status of the kinase-specific peptide substrates spotted on the PepChip array. Different kinase activities in the lysates from the CTLA-4+/+ and CTLA-4−/− Tc17 cells are shown using a ranking method; each spot represents the extent of phosphorylation of a specific peptide substrate. Using the ranking method, a bisymmetric distribution of peptides is generated, in which phosphorylation was either significantly increased or decreased by CTLA-4 signaling. Peptide substrates that were phosphorylated in the absence of CTLA-4 signaling are reflected by an equivalent peptide with altered or unaltered phosphorylation in response to CTLA-4 signaling. The ranks of the differentially phosphorylated peptides of interest (STAT3, STAT5 and STAT1) are marked by arrows. Spots representing peptides with significantly decreased (I), increased (III) or unaltered (II) phosphorylation as a result of CTLA-4 signaling are shown. (B) Tc17 cells were stimulated with anti-CD3 in the presence or absence of additional CTLA-4 crosslinking for 3 d, harvested, and analyzed for the expression of total and phosphorylated STAT3, STAT1 and STAT5. The data are from a single experiment that is representative of two independent experiments. (C) ChIP analysis of Tc17 cells that were stimulated with CD3 in the presence or absence of additional CTLA-4 crosslinking for 3 d. Tc17 cells were stimulated with IL-6+IL-23 or IL-2 for 30 min, and protein–DNA complexes were crosslinked with formaldehyde and immunoprecipitated with anti-STAT3 or anti-STAT5. The bound DNA was purified and amplified by quantitative PCR with primers designed for the IL-17a promoter site. The results are presented relative to the input DNA. The data are representative of three independent experiments. The error bars denote ± SEM. ***p < 0.001, n.s.: not significant, unpaired t-test.
Figure 3.
Figure 3.
Impact of STAT3 on CTLA-4-mediated Tc17 differentiation. CD8+ T cells from C57BL/6JRj mice primed under Tc17 conditions with anti-CD3 in the presence or absence of additional CTLA-4 crosslinking were untreated (DMSO) or treated with the STAT3 inhibitor (S31–201) 24 h after stimulation. The expression levels of the Tc17 signature molecules RORγt (A) IL-17, IFNγ (B) and IL-23R (C) were analyzed by flow cytometry at the indicated time points (left), and the d3 results are shown as the fold increase compared with the d2 control cells (right). The data are from a single experiment that is representative of three independent experiments. The error bars denote ± SEM. ***p < 0.001, **p < 0.01, n.s.: not significant, unpaired t-test.
Figure 4.
Figure 4.
CTLA-4 regulates the cytotoxic activity of Tc17 cells. (A) Schematic of the tumor experiment. Recipient Ly5.1 mice were s.c. injected with B16-OVA melanoma cells. Approximately 10 d later, when a visible tumor was present, CTLA-4+/+ and CTLA-4−/− OT.1 CD8+ T cells that had been stimulated under Tc17 conditions for 3 d were adoptively transferred into the recipient mice through intravenous (i.v.) injection, and tumor growth was measured for the next 6 d. (B) Pictorial representation of tumor size in the recipient mice on day 6 after adoptive transfer with PBS or CTLA-4+/+ or CTLA-4−/− OT.1 Tc17 cells. (C) Tumor growth in the mice receiving PBS or CTLA-4+/+ or CTLA-4−/− OT.1 Tc17 cells was measured on a daily basis until day 6. Results represent ± SEM of seven mice per group from three independent experiments. Cumulative bar graphs of tumor volume in the recipient mice on day 6 are shown on the right. Results represent ± SEM of seven mice per group from three independent experiments. (D) Adoptively transferred CD45.2+ cells were surface stained ex vivo in the splenocytes of the tumor-bearing mice 6 d after the transfer of CTLA-4+/+ or CTLA-4−/− OT.1 Tc17 cells and were analyzed for TNF-α, IL-17 and IFNγ production by flow cytometry. The data are from one representative experiment. The error bars denote ± SEM. **p < 0.01, n.s.: not significant, Mann–Whitney U-test.
Figure 5.
Figure 5.
Impact of CTLA-4 on Tc17 stability and plasticity. (A) Tc17 cells that had been stimulated for 3 d (as in Fig. 1C) were washed twice with medium and stimulated again with fresh plate-bound immobilized anti-CD3 in the presence or absence of additional crosslinking with anti-CTLA-4 coupled with IL-12 and IL-2 cytokines. Twenty-four hours later, IL-17 and IFNγ expression in these cells was determined using flow cytometry (left). Cumulative staining results are shown on the right. The data are representative of four independent experiments. (B) Tc17 cells were harvested on day 3 after primary stimulation (considered as 0 h before re-stimulation), re-activated as described above, and harvested at the indicated time points. The harvested cells were lysed, RNA was extracted, and RT was used to synthesize cDNA. The expression levels of the indicated genes relative to the housekeeping gene, HPRT, are shown as the mean ± SEM of duplicates from a single experiment that is representative of three experiments. (C) Tc17 cells were stimulated as in (B) and analyzed for the expression of Eomes and T-bet by flow cytometry at the indicated time points. The data are from a single experiment that is representative of 2 independent experiments. The error bars denote ± SEM. ***p < 0.001, **p < 0.01, *p < 0.05, n.s.: not significant, unpaired t-test.
Figure 6.
Figure 6.
CTLA-4-regulated STAT phosphorylation determines Tc17 plasticity. (A) Tc17 cells were re-activated in a Tc1 environment for 24 h (as described in Fig. 5A), harvested, and analyzed for the expression of the total and phosphorylated forms of STAT3, STAT1 and STAT5. The data are from a single experiment that is representative of two independent experiments. (B) ChIP analysis of Tc17 cells that were re-stimulated with Tc1-inducing cytokines for 24 h. The re-activated Tc17 cells were stimulated with IL-6+IL-23 or IL-2 for 30 min, and the protein–DNA interactions were crosslinked with formaldehyde and immunoprecipitated with anti-STAT3 or anti-STAT5. The bound DNA was purified and amplified by quantitative PCR with primers designed for the IL-17a promoter site. The results are presented relative to the input DNA. The data are representative of three independent experiments. (C) STAT3 and STAT1 phosphorylation levels in the re-stimulated cells were normalized to those in unstimulated cells, and the pSTAT3/pSTAT1 ratio was compared among cells that were crosslinked with anti-CD3 in the presence or absence of CTLA-4. The data are representative of three independent experiments. (D) Tc17 cells were harvested on day 3 after primary stimulation (considered 0 h before re-stimulation), re-stimulated as described in (A), and harvested at the indicated time points. The harvested cells were lysed, RNA was extracted, and RT was used to synthesize cDNA. The expression levels of the indicated genes relative to the housekeeping gene HPRT are shown as the mean ± SEM of duplicates from a single experiment that is representative of three experiments. (E, F) Tc17 cells were stimulated as in (D) and analyzed for the expression of (E) RORγt and (F) IL-23R by flow cytometry at the indicated time points. The data are representative of three independent experiments. (G) 3-d-cultured Tc17 cells in the presence (S31–201) or absence (DMSO) of STAT3 inhibitor were re-stimulated as in (A) and analyzed for the expression of degranulation-associated surface molecule CD107a on CD8+ T cell. The data are from a single experiment that is representative of three independent experiments. The error bars denote ± SEM. ***p < 0.001, **p < 0.01, *p < 0.05, n.s.: not significant, unpaired t-test.

References

    1. Pearce EL, Mullen AC, Martins GA, Krawczyk CM, Hutchins AS, Zediak VP, Banica M, DiCioccio CB, Gross DA, Mao CA et al.. Control of effector CD8+ T cell function by the transcription factor eomesodermin. Science 2003; 302:1041-43; PMID:14605368; http://dx.doi.org/10.1126/science.1090148 - DOI - PubMed
    1. Intlekofer AM, Takemoto N, Wherry EJ, Longworth SA, Northrup JT, Palanivel VR, Mullen AC, Gasink CR, Kaech SM, Miller JD et al.. Effector and memory CD8+ T cell fate coupled by T-bet and eomesodermin. Nat Immunol 2005; 6:1236-44; PMID:16273099; http://dx.doi.org/10.1038/ni1268 - DOI - PubMed
    1. Nguyen HH, Kim T, Song SY, Park S, Cho HH, Jung S, Ahn J, Kim H, Lee J, Kim H et al.. Naive CD8(+) T cell derived tumor-specific cytotoxic effectors as a potential remedy for overcoming TGF-beta immunosuppression in the tumor microenvironment. Sci Rep 2016; 6:28208; PMID:27306834; http://dx.doi.org/10.1038/srep28208 - DOI - PMC - PubMed
    1. Pedicord VA, Montalvo W, Leiner IM, Allison JP. Single dose of anti-CTLA-4 enhances CD8+ T-cell memory formation, function, and maintenance. Proc Natl Acad Sci U S A 2011; 108:266-71; PMID:21173239; http://dx.doi.org/10.1073/pnas.1016791108 - DOI - PMC - PubMed
    1. Yuan J, Adamow M, Ginsberg BA, Rasalan TS, Ritter E, Gallardo HF, Xu Y, Pogoriler E, Terzulli SL, Kuk D et al.. Integrated NY-ESO-1 antibody and CD8+ T-cell responses correlate with clinical benefit in advanced melanoma patients treated with ipilimumab. Proc Natl Acad Sci U S A 2011; 108:16723-28; PMID:21933959; http://dx.doi.org/10.1073/pnas.1110814108 - DOI - PMC - PubMed

Publication types