. 2017 Mar 3;2(9):eaal2192.
doi: 10.1126/sciimmunol.aal2192.

Single-cell RNA-seq and computational analysis using temporal mixture modelling resolves Th1/Tfh fate bifurcation in malaria

Affiliations

Single-cell RNA-seq and computational analysis using temporal mixture modelling resolves Th1/Tfh fate bifurcation in malaria

Tapio Lönnberg et al. Sci Immunol. .

Abstract

Differentiation of naïve CD4+ T cells into functionally distinct T helper subsets is crucial for the orchestration of immune responses. Due to extensive heterogeneity and multiple overlapping transcriptional programs in differentiating T cell populations, this process has remained a challenge for systematic dissection in vivo. By using single-cell transcriptomics and computational analysis using a temporal mixtures of Gaussian processes model, termed GPfates, we reconstructed the developmental trajectories of Th1 and Tfh cells during blood-stage Plasmodium infection in mice. By tracking clonality using endogenous TCR sequences, we first demonstrated that Th1/Tfh bifurcation had occurred at both population and single-clone levels. Next, we identified genes whose expression was associated with Th1 or Tfh fates, and demonstrated a T-cell intrinsic role for Galectin-1 in supporting a Th1 differentiation. We also revealed the close molecular relationship between Th1 and IL-10-producing Tr1 cells in this infection. Th1 and Tfh fates emerged from a highly proliferative precursor that upregulated aerobic glycolysis and accelerated cell cycling as cytokine expression began. Dynamic gene expression of chemokine receptors around bifurcation predicted roles for cell-cell in driving Th1/Tfh fates. In particular, we found that precursor Th cells were coached towards a Th1 but not a Tfh fate by inflammatory monocytes. Thus, by integrating genomic and computational approaches, our study has provided two unique resources, a database www.PlasmoTH.org, which facilitates discovery of novel factors controlling Th1/Tfh fate commitment, and more generally, GPfates, a modelling framework for characterizing cell differentiation towards multiple fates.


Conflict of interest statement

Competing interests The authors declare no competing interests.

Figures

Figure 1
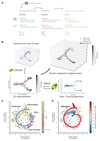
Figure 1. Single-cell mRNA-sequencing of PbTII cells.
(A) PbTII cells were transferred from a single donor to multiple recipients. The numbers denote single cells from which mRNA-seq data was successfully recorded. Numbers in parentheses refer to the replicate experiment presented in Fig. S12. (B-C) Representative FACS plots showing bifurcation of splenic Th1 (T-bet+IFNγ+) and Tfh (Bcl6+CXCR5+) PbTII CD4+ T cells at day 7 post-infection with PcAS. (D) Flow cytometry data indicate concurrent differentiation of Th1 (IFNγ+) and Tfh (CXCR5+) PbTII CD4+T cells within the spleen of PcAS-infected mice (n=4). Index expression is the product of MFI (mean fluorescence intensity) and proportion IFNγ+ or CXCR5+. Data are representative of two independent experiments. (E) PCA of single PbTII cells at day 7 post-infection with PcAS. The arrows represent Pearson correlation with PC1 and PC2. Cell size refers to the number of detected genes. “Th1 signature” and “Tfh signature” refer to cumulative expression of genes associated with Th1 or Tfh phenotypes (total TPM of all genes in the set) (15). (F) Expression levels of the leading 50 genes with the largest PC2 loadings at day 7 (D). Genes were annotated either as Th1- or Tfh-associated based on public datasets (15, 37, 44, 45). *Cdk2ap2 appears twice because two alternative genomic annotations exist.
Figure 2
Figure 2. GPfates modelling of bifurcation processes using scRNA-seq data.
(A) Overview of the analysis workflow that underlies GPfates, consisting of dimensionality reduction of high-dimensional single-cell transcriptomes (left), inference of a pseudo temporal ordering of the cells (middle) and the reconstruction of trajectories using temporal mixture modelling (right). These individual steps build on models derived using the Gaussian process framework. Once fitted, GPfates enables for different downstream analyses, including cell orderings, bifurcation time point estimates and inference of the genes that drive bifurcation events. (B) Illustration of intermediate results obtained from GPfates. Left: a low-dimensional representation as well as a pseudo temporal ordering of the cells is inferred using a non-linear dimensionality reduction (Gaussian process latent variable model). Temporal trajectories and bifurcations are then reconstructed using a temporal mixture model (Overlapping Mixture of Gaussian Processes), with data-trend assignments per cell. (C) The low-dimensional representation (2D) of the complete datasets (408 single-cell transcriptomes). The blue line depicts the inferred progression of pseudotime. Text labels illustrate features typical features of cells in the corresponding pseudotime region. (D) Inference of two simultaneous trends based on the pseudotime using the temporal mixture model.
Figure 3
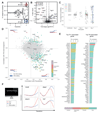
Figure 3. The relationship of known Th1 and Tfh transcriptomics signatures and the GPfates trajectories.
(A) Th1 and Tfh assignment probabilities of individual cells. For differential expression analysis (B), Th1 and Tfh were defined as cells with assignment probability of ≥0.8 for the respective trend. (B) Differential expression patterns between cells assigned to Th1 and Tfh states. Shown are fold differences (x-axis) and the corresponding adjusted pvalue (y-axis) of differential expression for expressed genes (in at least 20% of cells). Statistical significance was determined using Wilcoxon rank sum test, with Benjamini & Hochberg correction for multiple testing. The horizontal and vertical dashed lines denote adjusted p-value of 0.05 and twofold change, respectively. (C) Parallel Th1 and Tfh differentiation within cells of a single CD4+ T cell clone. Colors correspond to individual clones determined by sequence analysis of endogenous T cell receptor genes (Supplementary Tables 2 and 3). (D) Identification of genes associated with Th1 and Tfh trajectories. For each gene, shown is the expression correlation with pseudotime (x-axis) versus the correlation with the Tfh trend assignment (y-axis). Gene relevance was determined using the bifurcation statistic (methods, Figure S9C). The top 248 bifurcating genes, with bifurcation statistic > 49, are represented in colors according to the functional classification of the genes (Supplementary Methods and Supplementary Table 4). (E) Genes with the strongest association with Th1 or Tfh differentiation, filtered using the bifurcation score as in (D). The genes are ranked in descending order of association with the respective trend. Cdk2ap2 appears twice because of alternative genomic annotations. (F) Web address for GPfates database, where the expression kinetics of genes of interest can be visualized. Examples illustrate the top-ranking bifurcating genes from (E).
Figure 4
Figure 4. The bifurcation of T cell fates is accompanied by changes in transcription, proliferation and metabolism.
(A) The expression kinetics of Mki67, encoding the proliferative marker Ki-67, as a function of pseudotime. (B) Representative FACS plots showing kinetics of CellTrace™ Violet (CTV) dilution and Ki67, IFNγ or CXCR5 expression, with summary graphs showing % of PbTII cells expressing these (after 106 PbTII cells transferred) in uninfected (Day 0) and PcAS-infected mice at indicated days post-infection (n=4 mice/time point, with data from individual mice shown in summary graphs; solid line in summary graphs indicates temporal trends fit using a third order polynominal regression). Data are representative of two independent experiments. (C) Relative cell-cycle speed of PbTII cells, determined by measuring the fraction of cells in S, G2, or M phases. Shown are results when allocating cells to cell cycle phases using flow cytometry (Figure S16C) or computational assignments based on the scRNA-seq data. (D) Cell size estimation using FSC (Forward Scatter) measurements of PbTII cells. (E) Cellular metabolic activity of PbTII cells in naive mice (n=3) and at days 4 and 7 post-infection (n=6) as determined by flow cytometric assessment of ribosomal protein S6 phosphorylation (p-S6). Histogram and proportions are representative of two independent experiments. Statistics are one-way ANOVA and Tukey's multiple comparisons tests ***p<0.001. (F)Expression kinetics of genes associated with the cell cycle (251 genes derived from Cyclebase (46), glycolysis (41 genes, GO:0006096) and oxidative phosphorylation (30 genes, GO:0006119) during PcAS infection. Shown are cumulative expression levels of genes in the respective categories per single cell. Data from all cells and mice (Fig. 1A) were pooled. (G) Differential Expression analysis comparing the experiment-corrected expression of genes associated with cell cycle (p-value < 10-103), glycolysis (p-value < 10-4) and oxidative phosphorylation (p-value < 10-5) (F) in Ifng positive (≥10 TPM) and Ifng negative cells (<10 TPM) at day 4 post infection with PcAS from both experiments combined.
Figure 5
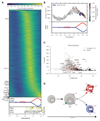
Figure 5. Temporal gene expression dynamics during PcAS infection.
(A) Expression patterns over pseudotime shown for top 2061 dynamic genes, (defined by D-statistic >50). Genes are ordered per peak expression time. Th1 and Tfh probability trajectories from the GPfates OMGP model presented at the bottom to depict bifurcation and provide temporal context between the gene expressions and cellular fates. Various dynamically expressed immune receptors, transcription factors and secreted molecules are annotated. (B) The relationship of transcriptional activity and the divergence of Th1 and Tfh fates. The number of detected genes per cell is shown across pseudotime. The color of the data points represents trend assignment probability (Fig. 2). Th1 and Tfh trajectories from the GPfates OMGP model presented to depict relation to the bifurcating behaviour. (C) Gene expression dynamics assessed using D-statistic and optimal Squared Exponential kernel lengthscales. Genes with a D-statistic >50 selected as displaying non-linear expression patterns over pseudotime. The optimal lengthscales of the squared exponential kernels of the Gaussian Processes plotted on x-axis, where small values indicate that some rapid change in expression over pseudotime occur. (D) A model summarizing the expression patterns of key chemokine receptors and the transcription factors Id2 and Tcf7 during Th1-Tfh cell fate determination. The size of the cell represents proliferative capacity (Fig. 4A-F).
Figure 6
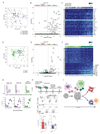
Figure 6. Myeloid cells influence Th bifurcation in uncommitted PbTII cells.
(A-C) Splenic CD8α+ and CD11b+ CD8α- cDCs from a naïve mouse, mixed cDCs from an infected mouse, and (D-F) Ly6Chi monocytes from naïve and infected mice were analysed by scRNA-seq, with mRNA reads filtered by minimum expression of 100 TPM in at least 2 cells. (A& D) PCA showing clustering of (A) cDCs or (D) monocytes. (B & E) Fold-change and confidence for differentially expressed genes (19) between infected and naive (B) cDCs or (E) monocytes; genes filtered on expression in >10 cells; genes satisfying qval < 0.05 are colored per function. (C& F) Differentially expressed genes (qval<0.05) in (C) cDCs and (F) monocytes, between naive and infected mice: cells and genes are ordered according to PC score and loading respectively. Common genes between heatmaps are annotated in (F). (G) Representative FACS histograms and proportions of splenic CD8α+ cDCs, CD8α- cDCs and Ly6Chi monocytes expressing CXCL9 in naive and infected mice; data shows individual mice with line at mean, and is representative of two independent experiments (n=4 mice/time point/experiment). (H) PbTII cells were transferred into LysMCre x iDTR mice 1 day prior to infection. At 3 days p.i., mice were treated with diphtheria toxin (DT) or saline. Proportions of Th1 (T-bethiIFNγ+) and Tfh (CXCR5+) PbTII cells at 7 days p.i.; data pooled from three independent experiments (n=5-6/experiment). Statistics: Mann-Whitney U Test. ****p<0.0001; NS, not significant. (I) Summary model proposing chemokine interactions between non-bifurcated PbTII cells and myeloid cells support a Th1 fate, while B cells support a Tfh fate.

References

    1. World malaria report 2016. World Health Organization; Geneva Switzerland: 2016.
    1. Pinzon-Charry A, et al. Low doses of killed parasite in CpG elicit vigorous CD4+ T cell responses against blood-stage malaria in mice. J Clin Invest. 2010;120:2967–2978. - PMC - PubMed
    1. Boyle MJ, et al. Human antibodies fix complement to inhibit Plasmodium falciparum invasion of erythrocytes and are associated with protection against malaria. Immunity. 2015;42:580–590. - PMC - PubMed
    1. Obeng-Adjei N, et al. Circulating Th1-Cell-type Tfh cells that exhibit impaired B cell help are preferentially activated during acute malaria in children. Cell Rep. 2015;13:425–439. - PMC - PubMed
    1. Perez-Mazliah D, Langhorne J. CD4 T-cell subsets in malaria: TH1/TH2 revisited. Front Immunol. 2015;5:671. - PMC - PubMed