

Geographic Disparities in Availability of Opioid Use Disorder Treatment for Medicaid Enrollees
- PMID: 28345210
- PMCID: PMC5785305
- DOI: 10.1111/1475-6773.12686
Geographic Disparities in Availability of Opioid Use Disorder Treatment for Medicaid Enrollees
Abstract
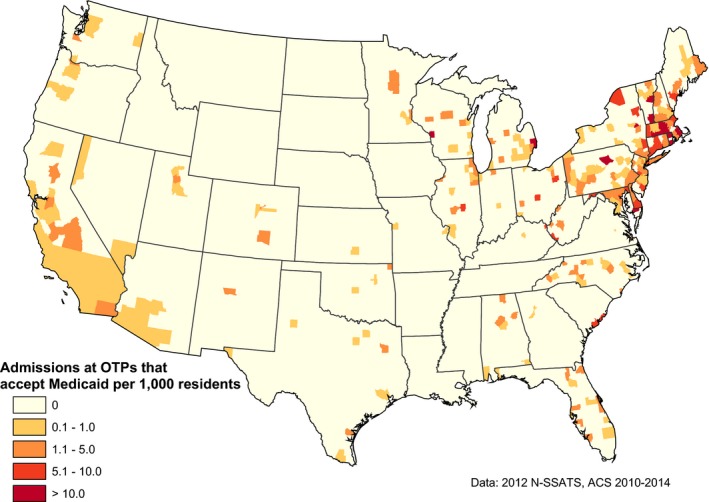
Objective: To examine county-level geographic variation in treatment admissions among opioid treatment programs (OTPs) that accept Medicaid in the continental United States.
Data sources/study setting: Data come from the 2012 National Survey of Substance Abuse Treatment Services.
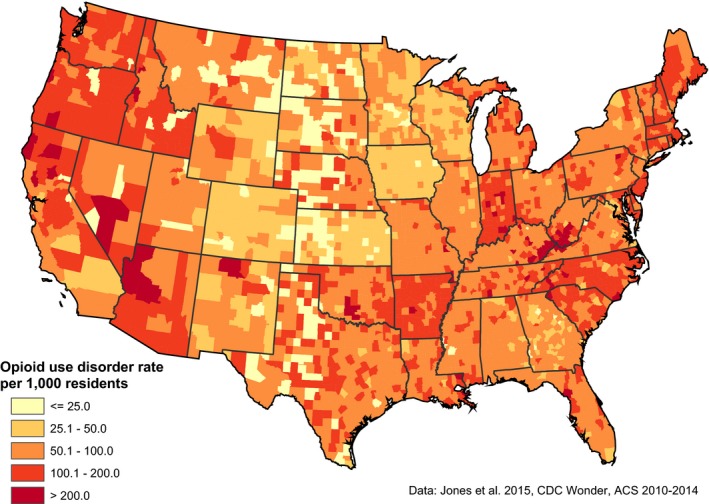
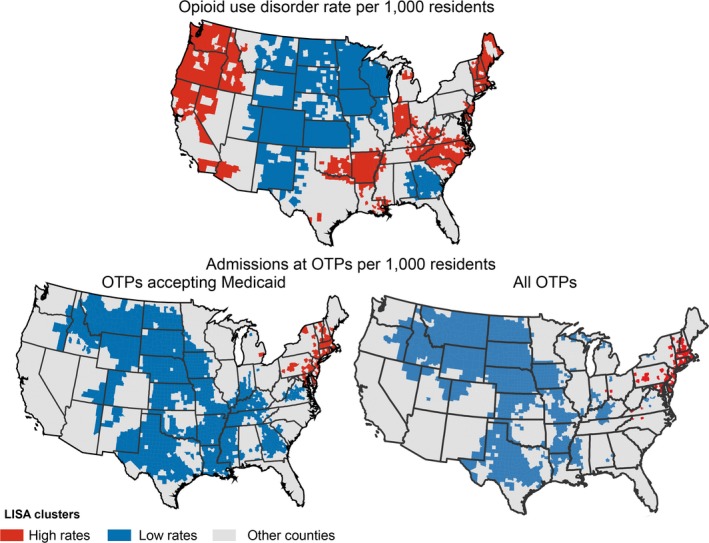
Study design/data collection: We used local measures of spatial autocorrelation (LISA) analysis to identify (1) clusters of counties with higher and lower than average rates of opioid use disorders and (2) clusters of counties with higher and lower than average treatment admissions among OTPs that accept Medicaid, adjusting for county population size.
Principal findings: Our results reveal several clusters of counties with higher than average rates of opioid use disorder (OUD) and lower than average treatment admissions among OTPs that accept Medicaid. These clusters are highly concentrated in the Southeast region of the country and include Arkansas, Kentucky, Louisiana, Mississippi, and Tennessee.
Conclusions: Medicaid enrollees in areas in the Southeast have the largest gaps between county-level OUD rates and estimated county-level capacity for treatment, as measured by county-level total treatment admissions among OTPs that accept Medicaid. Policy makers should consider strategies to increase the availability of OTPs with the capacity to serve Medicaid enrollees.
Keywords: Medicaid; access; opioid treatment programs; opioid use disorder.
© Health Research and Educational Trust.
Figures
References
-
- Andrews, C. M. 2014. “The Relationship Between State Medicaid Coverage to Medicaid Acceptance among Substance Abuse Providers in the United States.” Journal of Behavioral Health Services & Research 41 (4). - PubMed
-
- Anselin, L. 1995. “Local Indicators of Spatial Association‐LISA.” Geographical Analysis 27 (2): 93–115.
-
- Baker, L. , and Royalty A. B.. 1998. “Medicaid Policy, Physician Behavior, and Health Care for the Low‐Income Population.” Journal of Human Resources 35 (3): 480–502.
-
- Berman, S. , Dolins J., Tang S. F., and Yudkowsky B.. 2002. “Factors That Influence the Willingness of Private Primary Care Pediatricians to Accept More Medicaid Patients.” Pediatrics 110 (2 Pt 1): 239–48. - PubMed
Publication types
MeSH terms
LinkOut - more resources
Full Text Sources
Other Literature Sources
Medical
