

Genetic risk scores, sex and dietary factors interact to alter serum uric acid trajectory among African-American urban adults
- PMID: 28345493
- PMCID: PMC5679207
- DOI: 10.1017/S0007114517000411
Genetic risk scores, sex and dietary factors interact to alter serum uric acid trajectory among African-American urban adults
Abstract
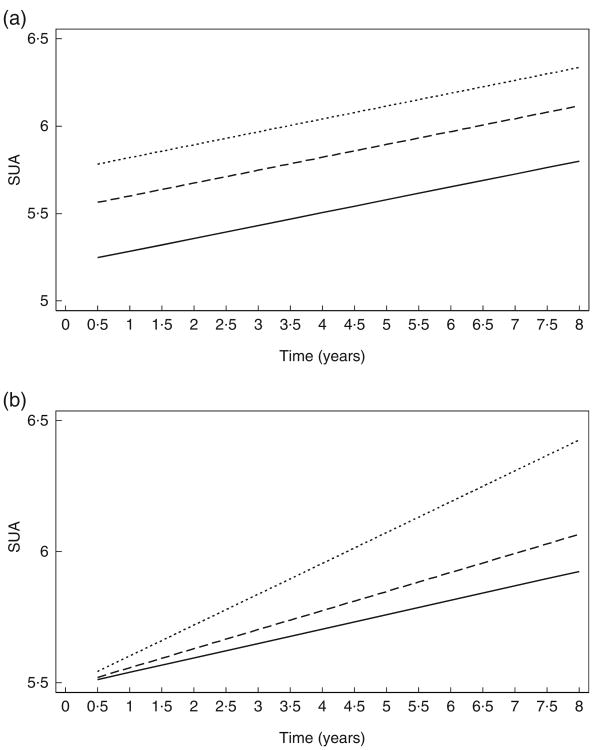
Serum uric acid (SUA), a causative agent for gout among others, is affected by both genetic and dietary factors, perhaps differentially by sex. We evaluated cross-sectional (SUAbase) and longitudinal (SUArate) associations of SUA with a genetic risk score (GRS), diet and sex. We then tested the interactive effect of GRS, diet and sex on SUA. Longitudinal data on 766 African-American urban adults participating in the Healthy Aging in Neighborhood of Diversity across the Lifespan study were used. In all, three GRS for SUA were created from known SUA-associated SNP (GRSbase (n 12 SNP), GRSrate (n 3 SNP) and GRStotal (n 15 SNP)). Dietary factors included added sugar, total alcohol, red meat, total fish, legumes, dairy products, caffeine and vitamin C. Mixed-effects linear regression models were conducted. SUAbase was higher among men compared with that among women, and increased with GRStotal tertiles. SUArate was positively associated with legume intake in women (γ=+0·14; 95 % CI +0·06, +0·22, P=0·001) and inversely related to dairy product intake in both sexes combined (γ=-0·042; 95 % CI -0·075, -0·009), P=0·010). SUAbase was directly linked to alcohol consumption among women (γ=+0·154; 95 % CI +0·046, +0·262, P=0·005). GRSrate was linearly related to SUArate only among men. Legume consumption was also positively associated with SUArate within the GRStotal's lowest tertile. Among women, a synergistic interaction was observed between GRSrate and red meat intake in association with SUArate. Among men, a synergistic interaction between low vitamin C and genetic risk was found. In sum, sex-diet, sex-gene and gene-diet interactions were detected in determining SUA. Further similar studies are needed to replicate our findings.
Keywords: AA African-American; GRS genetic risk score; HANDLS Healthy Aging in Neighborhoods of Diversity Across the Lifespan; SLC2A9 solute carrier family 2 (facilitated GLUT); SUA serum uric acid; UA uric acid; member 9; African-Americans; Diets; Genetic risk scores; Serum uric acid; Urban adults.
Conflict of interest statement
None of the authors has any conflicts of interest to declare.
Figures
Similar articles
-
Dietary factors are associated with serum uric acid trajectory differentially by race among urban adults.Br J Nutr. 2018 Oct;120(8):935-945. doi: 10.1017/S0007114518002118. Epub 2018 Aug 31. Br J Nutr. 2018. PMID: 30168404 Free PMC article.
-
The Dietary Fructose:Vitamin C Intake Ratio Is Associated with Hyperuricemia in African-American Adults.J Nutr. 2018 Mar 1;148(3):419-426. doi: 10.1093/jn/nxx054. J Nutr. 2018. PMID: 29546301 Free PMC article.
-
Dietary Potential Renal Acid Load Is Positively Associated with Serum Uric Acid and Odds of Hyperuricemia in the German Adult Population.J Nutr. 2018 Jan 1;148(1):49-55. doi: 10.1093/jn/nxx003. J Nutr. 2018. PMID: 29378039
-
Genetic and Epigenetic Regulation of the Innate Immune Response to Gout.Immunol Invest. 2023 Apr;52(3):364-397. doi: 10.1080/08820139.2023.2168554. Epub 2023 Feb 6. Immunol Invest. 2023. PMID: 36745138 Review.
-
Dietary factors and risk of gout and hyperuricemia: a meta-analysis and systematic review.Asia Pac J Clin Nutr. 2018;27(6):1344-1356. doi: 10.6133/apjcn.201811_27(6).0022. Asia Pac J Clin Nutr. 2018. PMID: 30485934
Cited by
-
Risk Predictors of High Uric Acid Levels Among Patients with Type-2 Diabetes.Diabetes Metab Syndr Obes. 2021 Dec 24;14:4911-4920. doi: 10.2147/DMSO.S344894. eCollection 2021. Diabetes Metab Syndr Obes. 2021. PMID: 34992399 Free PMC article.
-
Association and interaction between dietary patterns and gene polymorphisms in Liangshan residents with hyperuricemia.Sci Rep. 2022 Jan 25;12(1):1356. doi: 10.1038/s41598-021-04568-y. Sci Rep. 2022. PMID: 35079028 Free PMC article.
-
Nonlinear association of cardiometabolic index with hyperuricemia: insights from the NHANES 1999-2018 study.Front Endocrinol (Lausanne). 2025 Mar 26;16:1459946. doi: 10.3389/fendo.2025.1459946. eCollection 2025. Front Endocrinol (Lausanne). 2025. PMID: 40206602 Free PMC article.
-
Role of Vitamin C in Prophylaxis and Treatment of Gout-A Literature Review.Nutrients. 2021 Feb 22;13(2):701. doi: 10.3390/nu13020701. Nutrients. 2021. PMID: 33671646 Free PMC article. Review.
-
Biochemical and Hematological Correlates of Elevated Homocysteine in National Surveys and a Longitudinal Study of Urban Adults.Nutrients. 2020 Mar 30;12(4):950. doi: 10.3390/nu12040950. Nutrients. 2020. PMID: 32235453 Free PMC article.
References
-
- Choi H, Mount D, Reginato A. Pathogenesis of gout. Ann Intern Med. 2005;143:499–516. - PubMed
-
- George RL, Keenan RT. Genetics of hyperuricemia and gout: implications for the present and future. Curr Rheumatol Rep. 2013;15:309. - PubMed
-
- Fang J, Alderman M. Serum uric acid and cardiovascular mortality the NHANES I epidemiologic follow-up study, 1971–1992. National Health and Nutrition Examination Survey. JAMA. 2000;283:2404–2410. - PubMed
-
- Kontogianni MD, Chrysohoou C, Panagiotakos DB, et al. Adherence to the Mediterranean diet and serum uric acid: the ATTICA study. Scand J Rheumatol. 2012;41:442–449. - PubMed
MeSH terms
Substances
Grants and funding
LinkOut - more resources
Full Text Sources
Other Literature Sources
