

Tissue resident memory T cells in the human conjunctiva and immune signatures in human dry eye disease
- PMID: 28345628
- PMCID: PMC5366884
- DOI: 10.1038/srep45312
Tissue resident memory T cells in the human conjunctiva and immune signatures in human dry eye disease
Abstract
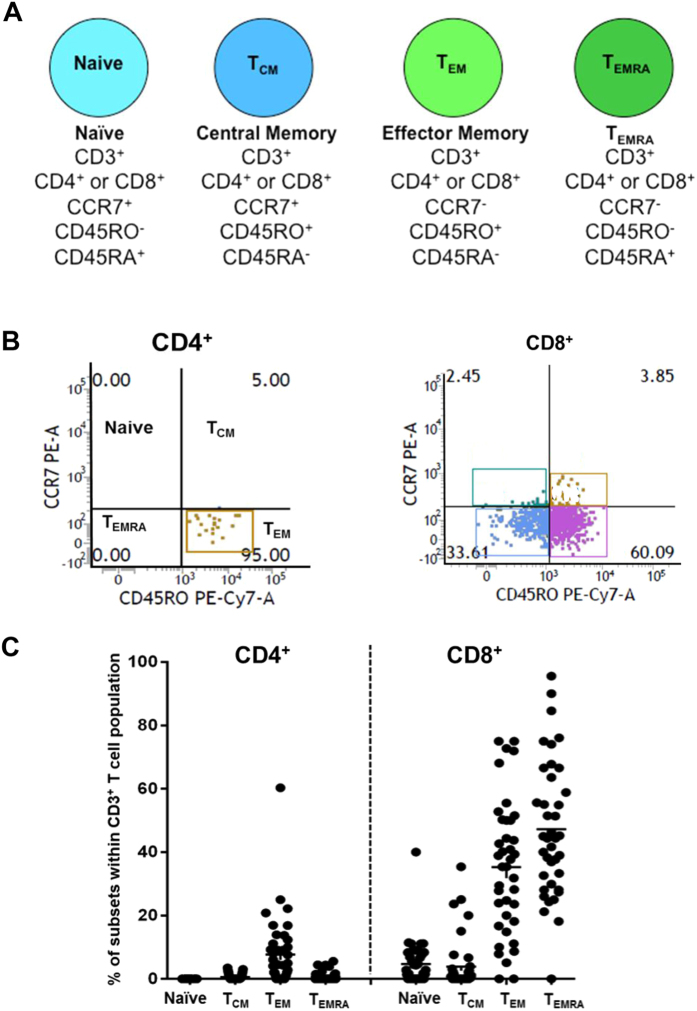
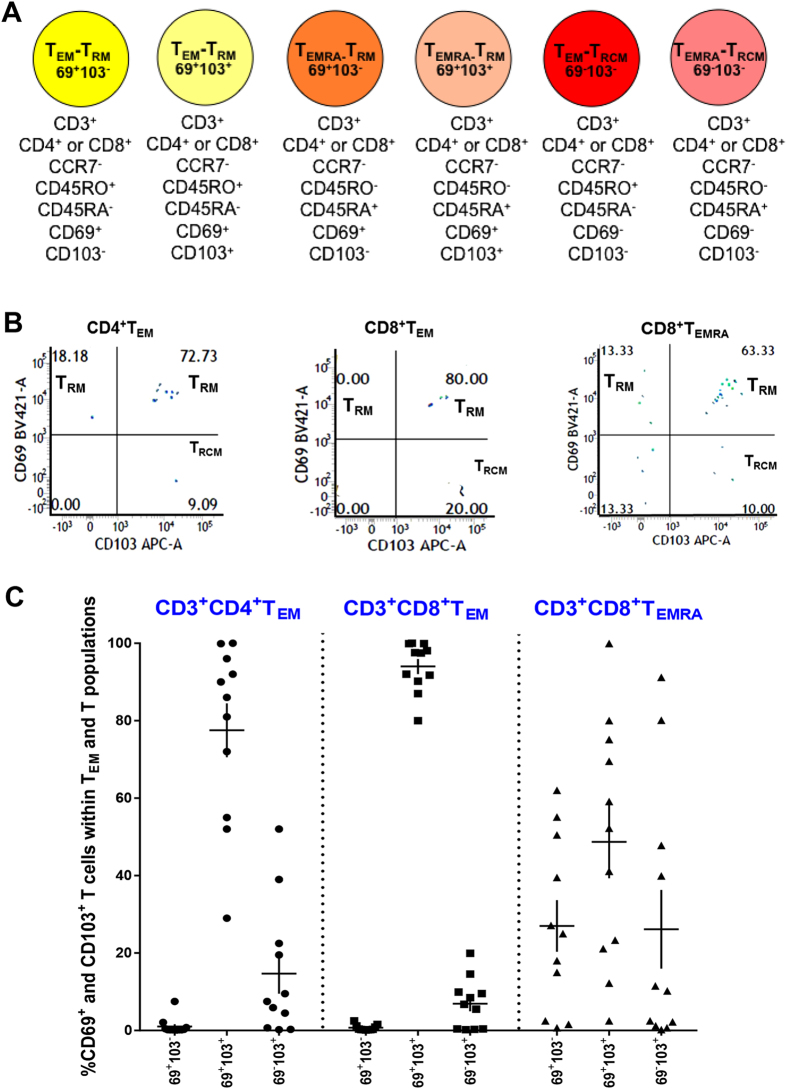
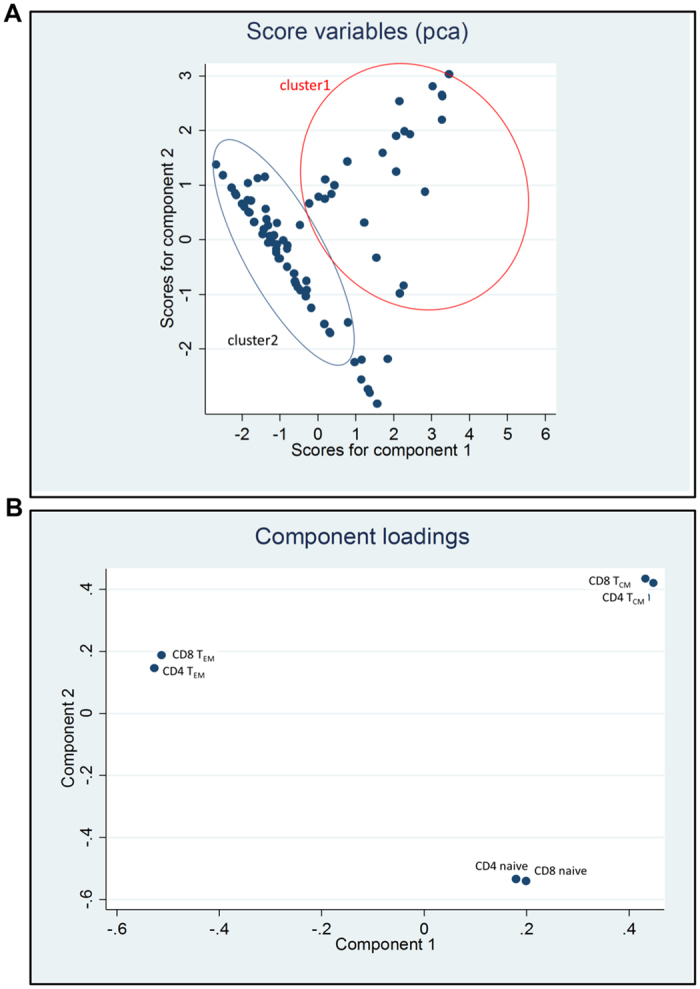
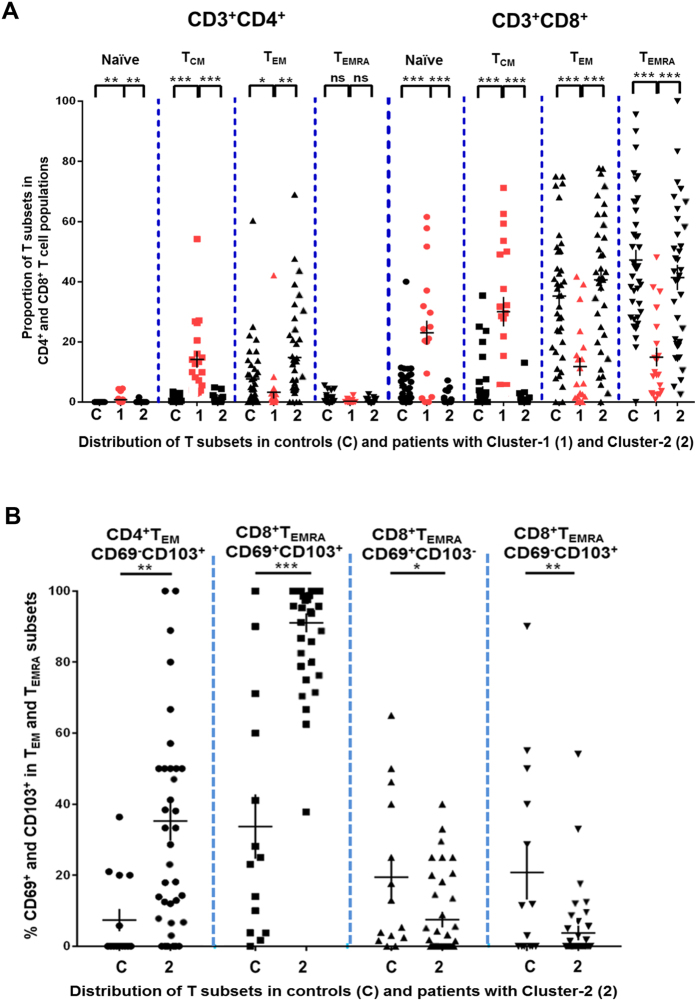
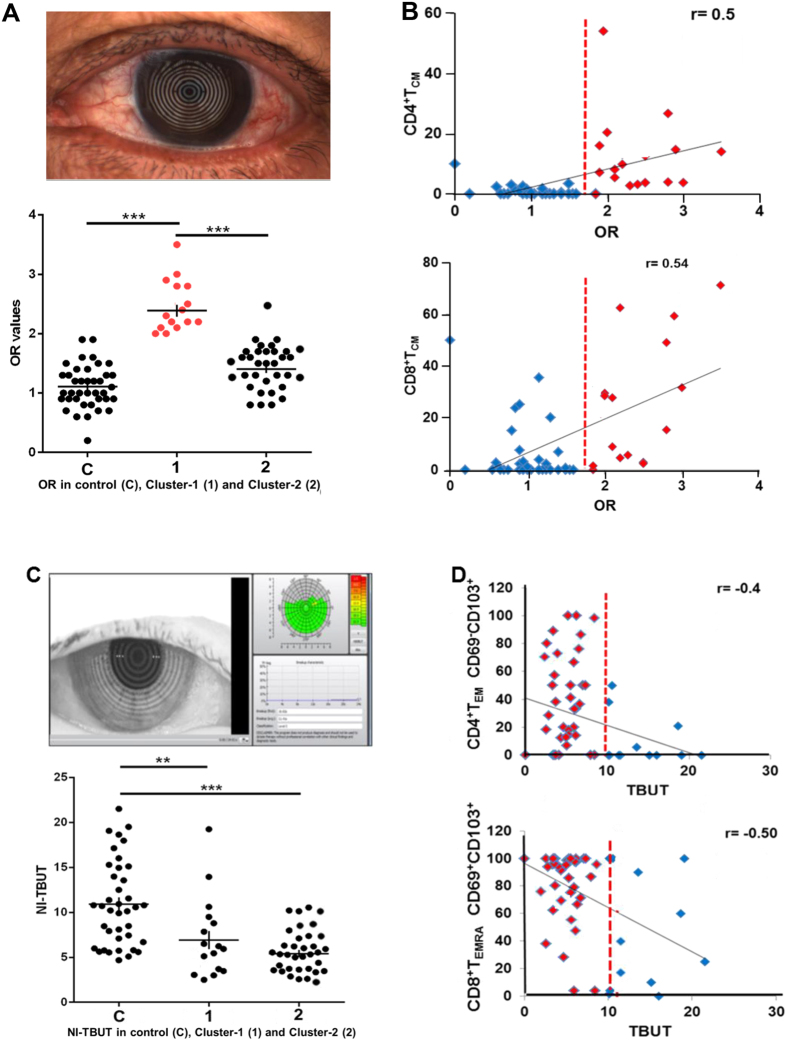
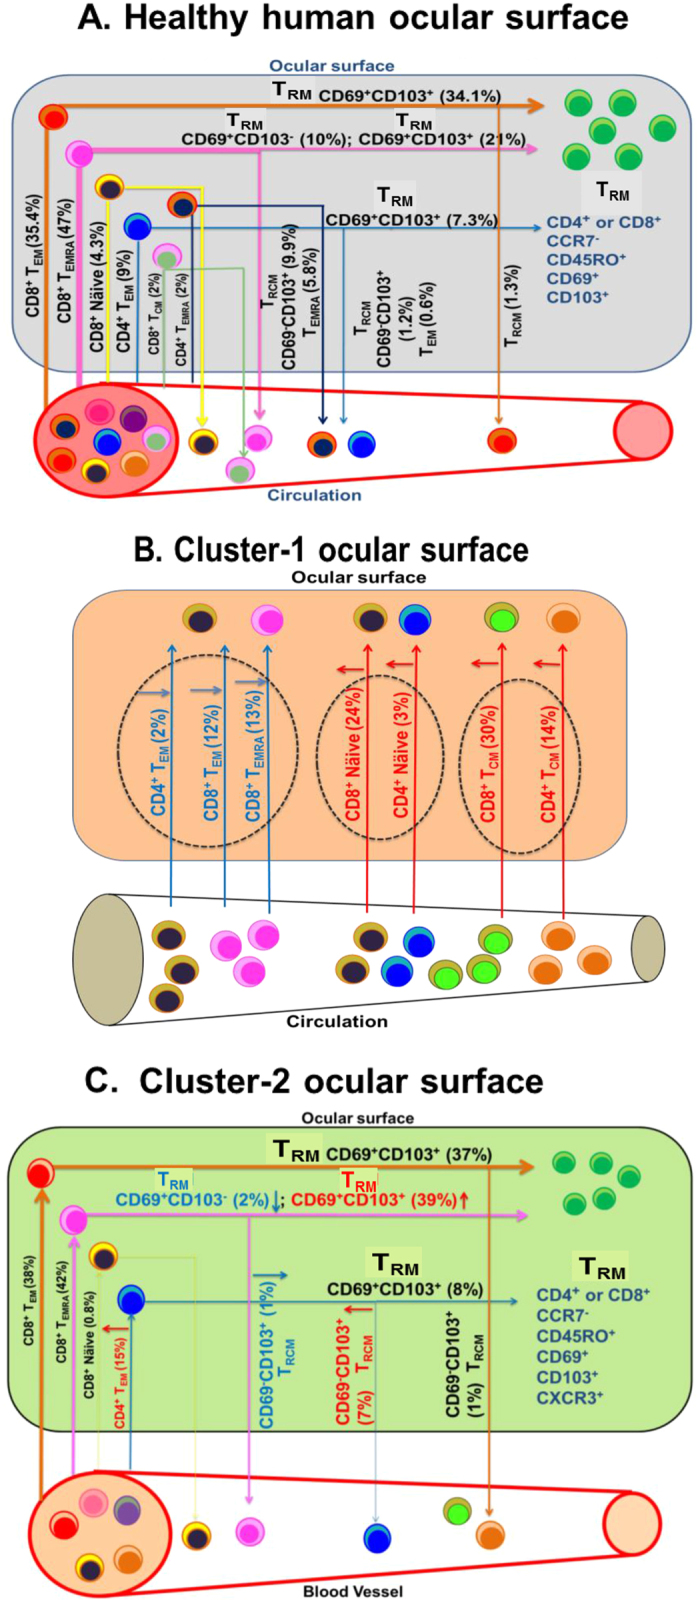
Non-recirculating resident memory (TRM) and recirculating T cells mount vigorous immune responses to both self and foreign antigens in barrier tissues like the skin, lung and gastrointestinal tract. Using impression cytology followed by flow cytometry we identified two TRM subsets and four recirculating T-subsets in the healthy human ocular surface. In dry eye disease, principal component analysis (PCA) revealed two clusters of patients with distinct T-cell signatures. Increased conjunctival central memory and naïve T cells characterized Cluster-1 patients, and increased CD8+ TRMs and CD4+ recirculating memory T cells characterized Cluster-2 patients. Interestingly these T-cell signatures are associated with different clinical features: the first signature correlated with increased ocular redness, and the second with reduced tear break up times. These findings open the door to immune-based characterization of dry eye disease and T-subset specific immunotherapies to suppress T-subsets involved in disease. They may also help with patient stratification during clinical trials of immunomodulators.
Conflict of interest statement
The authors declare no competing financial interests.
Figures
Similar articles
-
Immune response in the conjunctival epithelium of patients with dry eye.Exp Eye Res. 2010 Oct;91(4):524-9. doi: 10.1016/j.exer.2010.07.008. Epub 2010 Jul 21. Exp Eye Res. 2010. PMID: 20654615
-
Human skin is protected by four functionally and phenotypically discrete populations of resident and recirculating memory T cells.Sci Transl Med. 2015 Mar 18;7(279):279ra39. doi: 10.1126/scitranslmed.3010302. Sci Transl Med. 2015. PMID: 25787765 Free PMC article.
-
CD4+ Memory T Cells at Home in the Tissue: Mechanisms for Health and Disease.Front Immunol. 2018 Oct 16;9:2394. doi: 10.3389/fimmu.2018.02394. eCollection 2018. Front Immunol. 2018. PMID: 30386342 Free PMC article. Review.
-
The dominant human conjunctival epithelial CD8αβ+ T cell population is maintained with age but the number of CD4+ T cells increases.Age (Dordr). 2012 Dec;34(6):1517-28. doi: 10.1007/s11357-011-9316-3. Epub 2011 Sep 27. Age (Dordr). 2012. PMID: 21948184 Free PMC article.
-
Resident Memory T Cells in Autoimmune Skin Diseases.Front Immunol. 2021 May 3;12:652191. doi: 10.3389/fimmu.2021.652191. eCollection 2021. Front Immunol. 2021. PMID: 34012438 Free PMC article. Review.
Cited by
-
Mass cytometry reveals the corneal immune cell changes at single cell level in diabetic mice.Front Endocrinol (Lausanne). 2023 Sep 5;14:1253188. doi: 10.3389/fendo.2023.1253188. eCollection 2023. Front Endocrinol (Lausanne). 2023. PMID: 37732130 Free PMC article.
-
Changes in conjunctival mononuclear phagocytes and suppressive activity of regulatory macrophages in desiccation induced dry eye.Ocul Surf. 2024 Oct;34:348-362. doi: 10.1016/j.jtos.2024.09.003. Epub 2024 Sep 19. Ocul Surf. 2024. PMID: 39306240
-
Molecular Characteristics and Distribution of Adult Human Corneal Immune Cell Types.Front Immunol. 2022 Feb 23;13:798346. doi: 10.3389/fimmu.2022.798346. eCollection 2022. Front Immunol. 2022. PMID: 35280984 Free PMC article.
-
A Non-invasive Way to Isolate and Phenotype Cells from the Conjunctiva.J Vis Exp. 2017 Jul 5;(125):55591. doi: 10.3791/55591. J Vis Exp. 2017. PMID: 28715398 Free PMC article.
-
Characterization of T cells in the progression of dry eye disease using single-cell RNA sequencing in mice.Eur J Med Res. 2025 Apr 28;30(1):338. doi: 10.1186/s40001-025-02607-2. Eur J Med Res. 2025. PMID: 40296131 Free PMC article.
References
-
- Sallusto F., Geginat J. & Lanzavecchia A. Central memory and effector memory T cell subsets: function, generation, and maintenance. Annual review of immunology 22, 745–763 (2004). - PubMed
Publication types
MeSH terms
Substances
LinkOut - more resources
Full Text Sources
Other Literature Sources
Molecular Biology Databases
Research Materials
