. 2017 Mar 27:7:45255.
doi: 10.1038/srep45255.

WT1 expression in breast cancer disrupts the epithelial/mesenchymal balance of tumour cells and correlates with the metabolic response to docetaxel

Affiliations

WT1 expression in breast cancer disrupts the epithelial/mesenchymal balance of tumour cells and correlates with the metabolic response to docetaxel

Mara Artibani et al. Sci Rep. .

Abstract

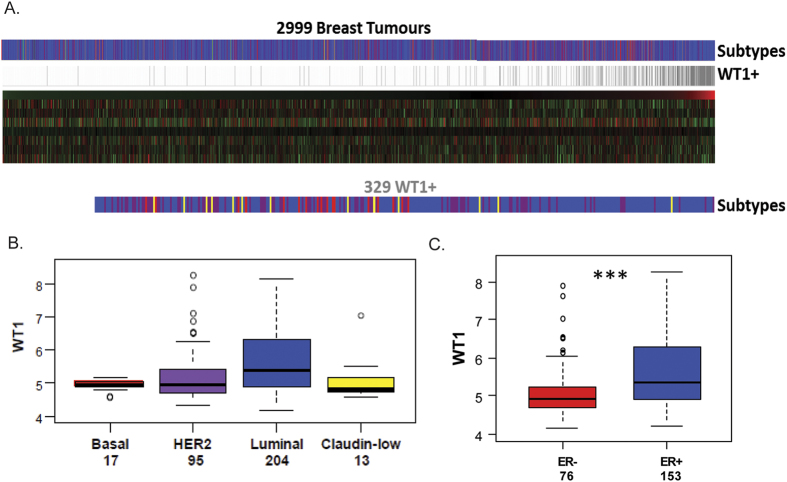
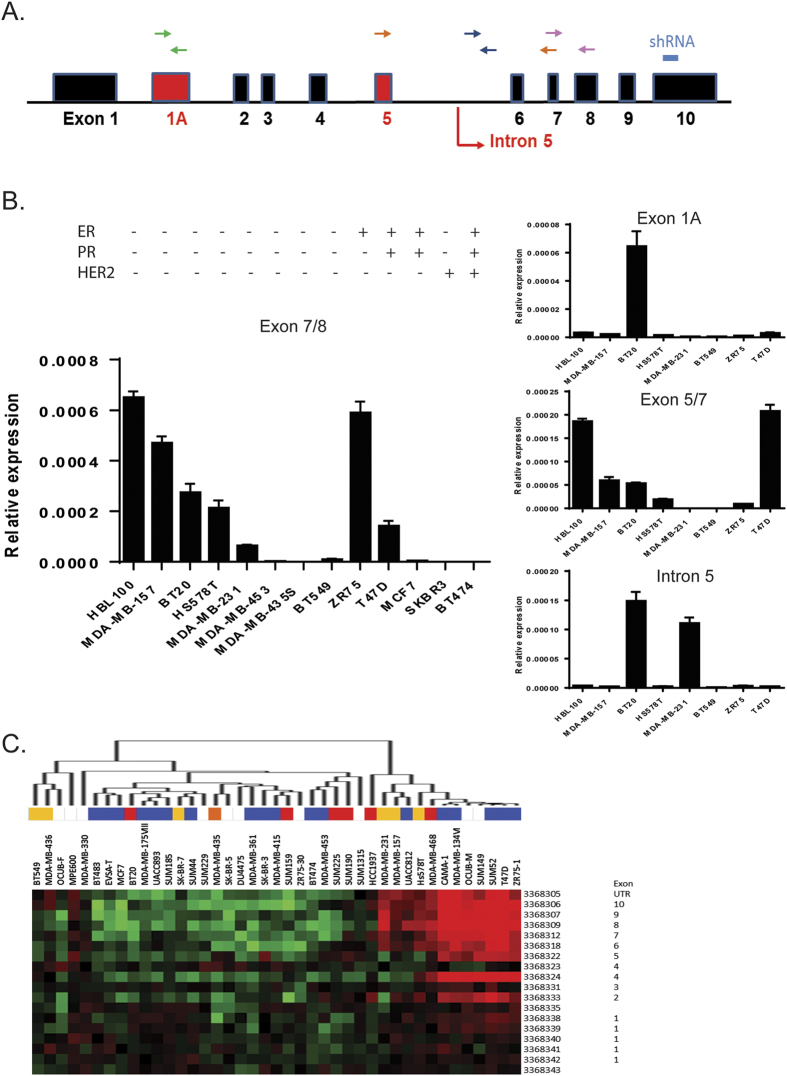
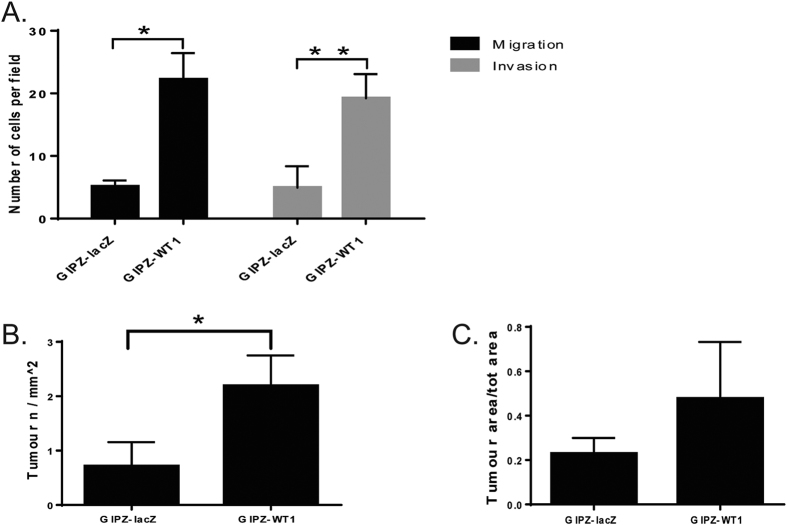
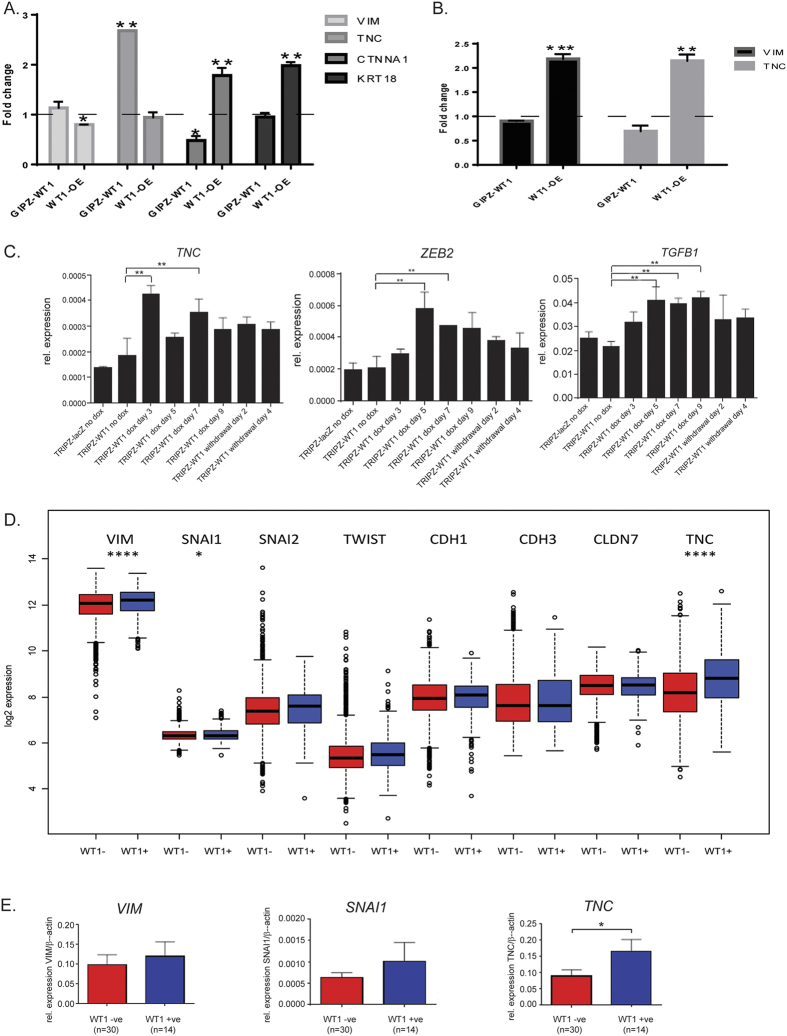
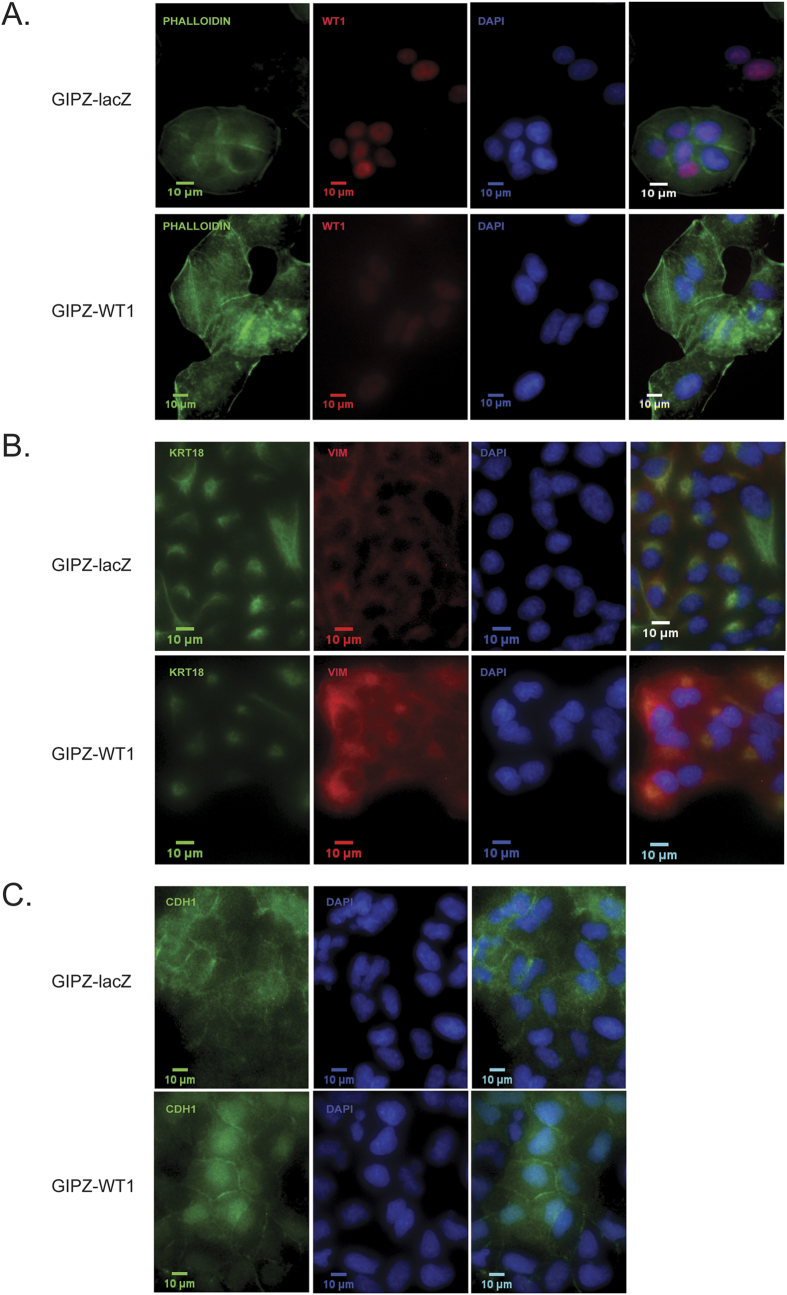
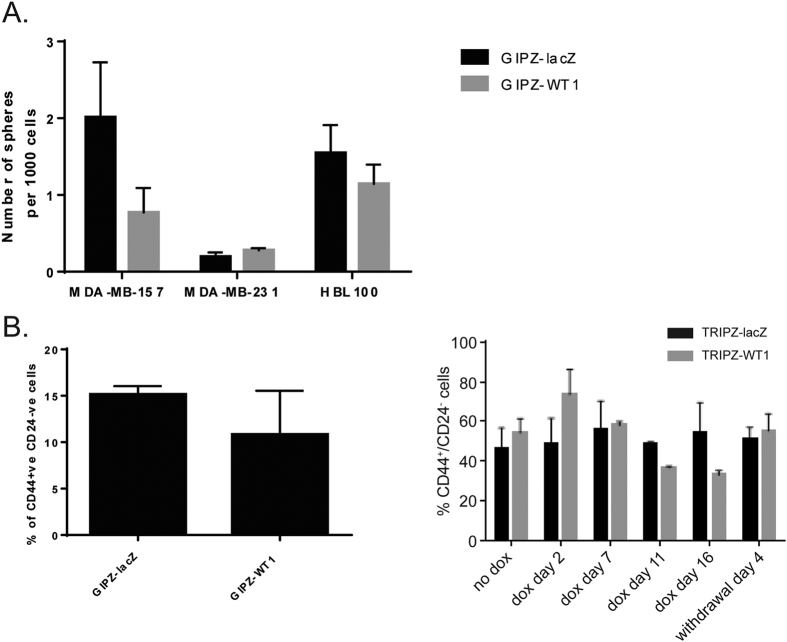
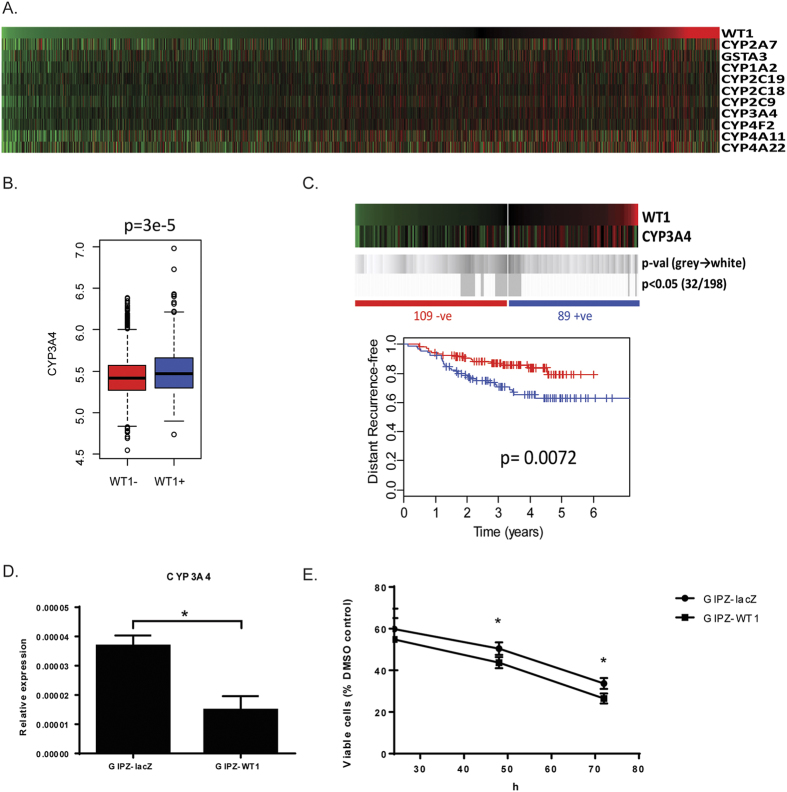
WT1 is a transcription factor which regulates the epithelial-mesenchymal balance during embryonic development and, if mutated, can lead to the formation of Wilms' tumour, the most common paediatric kidney cancer. Its expression has also been reported in several adult tumour types, including breast cancer, and usually correlates with poor outcome. However, published data is inconsistent and the role of WT1 in this malignancy remains unclear. Here we provide a complete study of WT1 expression across different breast cancer subtypes as well as isoform specific expression analysis. Using in vitro cell lines, clinical samples and publicly available gene expression datasets, we demonstrate that WT1 plays a role in regulating the epithelial-mesenchymal balance of breast cancer cells and that WT1-expressing tumours are mainly associated with a mesenchymal phenotype. WT1 gene expression also correlates with CYP3A4 levels and is associated with poorer response to taxane treatment. Our work is the first to demonstrate that the known association between WT1 expression in breast cancer and poor prognosis is potentially due to cancer-related epithelial-to-mesenchymal transition (EMT) and poor chemotherapy response.


Conflict of interest statement

The authors declare no competing financial interests.

Figures

Figure 1
Figure 1. WT1 expression in human primary breast cancer datasets.
(A) Gene expression analysis data from 17 integrated datasets (n = 2999 tumours). (B) Boxplot of WT1 expression in the different subtypes, y-axis showing log2 values. (C) Boxplots of WT1 expression in ER-positive (blue) and ER-negative (red) tumours designated by IHC of ER-alpha amongst those tumours with detectable expression of WT1, ***p < 0.001.
Figure 2
Figure 2. WT1 expression in breast cancer cell lines.
(A) Schematic of the WT1 locus, showing alternative exons/splices in red, the position of the primers for each qRT-PCR assay and the sequence targeted by the shRNA used in the knockdown experiments. (B) Quantitative real-time PCR of WT1 mRNA: data points represent the relative expression for each assay, error bars represent the standard deviation of two biological replicates. (C) Heatmap visualization of the relative expression of probes representing each WT1 exon across a panel of breast cancer cell lines in a published dataset (GSE16732). The different colours indicate the cell line subtype (red = basal, orange = basal B/mesenchymal, purple = HER2 amplified, blue = luminal, yellow = claudin-low).
Figure 3
Figure 3. WT1 knockdown and overexpression is achieved in breast cancer cell lines.
(A) Quantitative real-time PCR of WT1 mRNA in MDA-MB-157, MDA-MB-231 and HBL100 cells transduced with pGIPZ-miR: the graph represents fold change of mean expression relative to untransduced cells (given a value of 1); error bars represent the standard deviation of two separate biological replicates (**p < 0.01, ***p < 0.001). (B) Immunoblot of whole-protein lysates (40 μg) probed with antibodies to WT1 and HSP90, as a loading control. Only the truncated isoform of WT1 can be observed in MDA-MB-231 cells. Full-length blots are presented in Figure S8 in Additional file 1. (C) WT1 immunofluorescence of MDA-MB-157 cells transduced with pGIPZ-miR. (D) Quantitative real-time PCR of WT1 mRNA in MDA-MB-157 cells transduced with pTRIPZ-miR: the cells were cultured on 2 μg/ml doxycycline, the graph represents fold change of mean expression relative to untransduced cells, error bars represent the standard deviation of three biological replicates (*p < 0.05, **p < 0.01, ***p < 0.001). (E) Quantitative real-time PCR of WT1 mRNA in MDA-MB-157 and HBL100 cells transfected with pCI-WT1-OE; data points represent the relative expression, error bars represent the standard deviation of three biological replicates (***p < 0.001, ****p < 0.0001).
Figure 4
Figure 4. Knockdown of WT1 results in increased motility, invasiveness and metastatic potential of MDA-MB-157 cells.
(A) Bar diagram representing the mean number of migrating and invading cells from three independent experiments. (B,C) WT1 knockdown significantly increases the number (B) but not the size (C) of lung metastases. MDA-MB-157 cells transduced with pGIPZ-miR were injected into nude mice through the tail vein and lung metastases were assessed 8 weeks after injection (n = 4 for each group).
Figure 5
Figure 5. Correlation between WT1 expression and EMT markers in vitro and in vivo.
(A) Quantitative real-time PCR of epithelial and mesenchymal markers in MDA-MB-157 cells transduced with pGIPZ-miR or transfected with pCI-WT1-OE: the graph represents fold change of mean expression relative to control cells, error bars represent the standard deviation of three biological replicates (*p < 0.05, **p < 0.01). (B) Quantitative real-time PCR of mesenchymal markers in HBL100 cells transduced with pGIPZ-miR or transfected with pCI-WT1-OE: the graph represents fold change of mean expression relative to control cells, error bars represent the standard deviation of three biological replicates (**p < 0.01, ***p < 0.001). (C) Quantitative real-time PCR of TNC, TGFB1 and ZEB2 mRNA in MDA-MB-157 cells transduced with pTRIPZ-miR: data points represent the relative expression of the gene, error bars represent the standard deviation of three separate biological replicates (**p < 0.01). (D) Boxplot of EMT genes expression in the WT1-positive and WT1-negative samples obtained from 17 integrated datasets (n = 2999 tumours), y-axis showing log2 values. Statistically significant differences were observed only for VIM, SNAI1 and TNC, which showed higher expression in the WT1-positive samples. *p < 0.05, ****p < 0.0001. (E) Quantitative RT-PCR of EMT genes in clinical samples (n = 44 tumours).
Figure 6
Figure 6. EMT markers immunofluorescence in MDA-MB-157 cells.
MDA-MB-157 cells transduced with pGIPZ-miR were stained with phalloidin toxin (A), vimentin/cytokeratin18 (B) and E-cadherin (C) antibodies.
Figure 7
Figure 7. Knockdown of WT1 does not affect CSCs percentage or colony forming ability.
(A) Colony forming assay of MDA-MB-157, MDA-MB-231 and HBL100 cells with constitutive WT1 knockdown suspended in semi-solid medium. Data points represent the average number of spheres formed per well, error bars represent the SEM of four biological replicates. (B) FACS analysis of CD24 and CD44 expression in MDA-MB-157 cells transduced with pGIPZ-miR and pTRIZ-miR. Bar graphs represent the average percentage of CD44+/CD24− cells in the different clones, error bars represent the SEM of three biological replicates.
Figure 8
Figure 8. WT1 expression in breast cancer correlates with cytochrome P450 family members and poor response to taxane treatment.
(A) Heatmap showing ranked expression of WT1 alongside cytochrome P450 genes obtained from 17 integrated published microarray datasets (n = 2999 tumours). (B) Boxplot of CYP3A4 expression in the WT1-positive and WT1-negative samples. (C) Kaplan Meier survival analysis of 198 breast cancer patients treated with taxane-anthracycline chemotherapy (Dataset GSE25065) demonstrates that WT1 expression is associated with worse outcomes. Heatmaps show log2 mean-centered expression values, red = high, green = low. Shades of grey to white indicate p-values of log-rank (Mantel-Cox) tests at all possible cut-points are shown in grey. Vertical bars on survival curves indicate censored cases. (D) Quantitative real-time PCR of CYP3A4 mRNA in MDA-MB-157 cells transduced with pGIPZ-miR: data points represent the relative expression of the gene, error bars represent the standard deviation of two separate biological replicates (*p < 0.05). (E) Cytotoxycity of docetaxel is increased in MDA-MB-157 cells transduced with pGIPZ-miR. Mean and standard deviation of three independent experiments are plotted (*p < 0.05).

Similar articles

Cited by

References

    1. Hohenstein P. & Hastie N. D. The many facets of the Wilms’ tumour gene, WT1. Human molecular genetics 15 Spec No 2, R196–201, doi: 10.1093/hmg/ddl196 (2006). - DOI - PubMed
    1. Martinez-Estrada O. M. et al.. Wt1 is required for cardiovascular progenitor cell formation through transcriptional control of Snail and E-cadherin. Nature genetics 42, 89–93, doi: 10.1038/ng.494 (2010). - DOI - PMC - PubMed
    1. Essafi A. et al.. A wt1-controlled chromatin switching mechanism underpins tissue-specific wnt4 activation and repression. Developmental cell 21, 559–574, doi: 10.1016/j.devcel.2011.07.014 (2011). - DOI - PMC - PubMed
    1. Chau Y. Y. & Hastie N. D. The role of Wt1 in regulating mesenchyme in cancer, development, and tissue homeostasis. Trends in genetics: TIG 28, 515–524, doi: 10.1016/j.tig.2012.04.004 (2012). - DOI - PubMed
    1. Silberstein G. B., Van Horn K., Strickland P., Roberts C. T. & Daniel C. W. Altered expression of the WT1 Wilms tumor suppressor gene in human breast cancer. Proceedings of the National Academy of Sciences of the United States of America 94, 8132–8137 (1997). - PMC - PubMed

Publication types

MeSH terms