. 2017 Aug 1;196(3):340-352.
doi: 10.1164/rccm.201608-1672OC.

Smoking-Dependent Distal-to-Proximal Repatterning of the Adult Human Small Airway Epithelium

Affiliations

Smoking-Dependent Distal-to-Proximal Repatterning of the Adult Human Small Airway Epithelium

Jing Yang et al. Am J Respir Crit Care Med. .

Abstract

Rationale: Small airways are the primary site of pathologic changes in chronic obstructive pulmonary disease (COPD), the major smoking-induced lung disorder.

Objectives: On the basis of the concept of proximal-distal patterning that determines regional specialization of the airway epithelium during lung development, we hypothesized that a similar program operates in the adult human lung being altered by smoking, leading to decreased regional identity of the small airway epithelium (SAE).

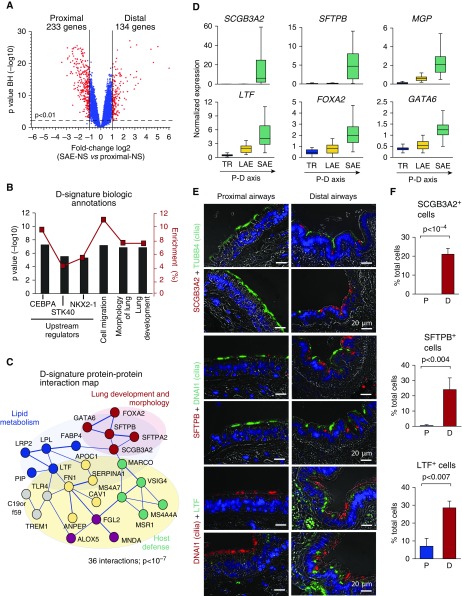
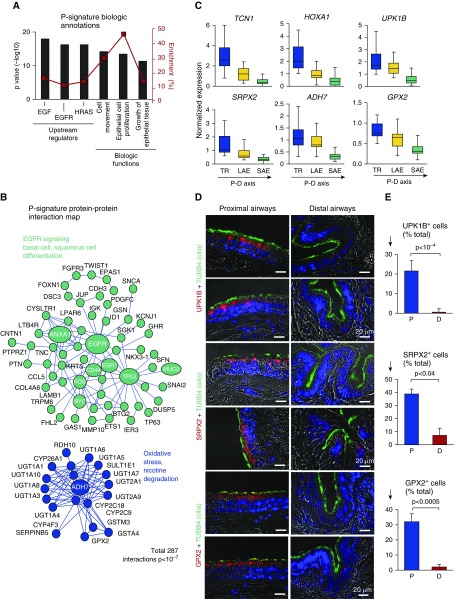
Methods: The proximal and distal airway signatures were identified by comparing the transcriptomes of large and small airway epithelium samples obtained by bronchoscopy from healthy nonsmokers. The expression of these signatures was evaluated in the SAE of healthy smokers and smokers with COPD compared with that of healthy nonsmokers. The capacity of airway basal stem cells (BCs) to maintain region-associated phenotypes was evaluated using the air-liquid interface model.

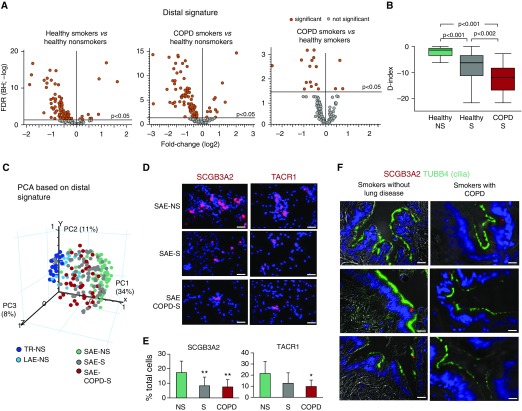
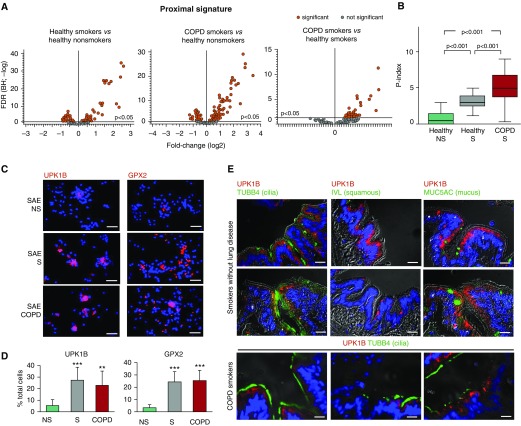
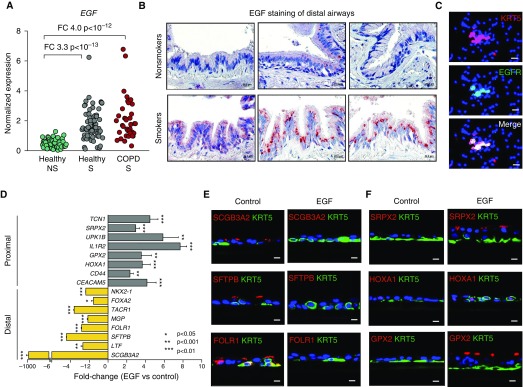
Measurements and main results: The distal and proximal airway signatures, containing 134 and 233 genes, respectively, were identified. These signatures included known developmental regulators of airway patterning, as well as novel regulators such as epidermal growth factor receptor, which was associated with the proximal airway phenotype. In the SAE of smokers with COPD, there was a dramatic smoking-dependent loss of the regional transcriptome identity with concomitant proximalization. This repatterning phenotype was reproduced by stimulating SAE BCs with epidermal growth factor, which was up-regulated in the SAE of smokers, during differentiation of SAE BCs in vitro.

Conclusions: Smoking-induced global distal-to-proximal reprogramming of the SAE represents a novel pathologic feature of COPD and is mediated by exaggerated epidermal growth factor/epidermal growth factor receptor signaling in SAE BCs.

Keywords: basal cells; chronic obstructive pulmonary disease; differentiation; stem cells; transcriptome.


Figures

Figure 1.
Figure 1.
Distal airway epithelial signature. (A) Volcano plot depicting differential gene expression between the distal (D; n = 63) and proximal (P; total n = 48, including trachea [TR; n = 27] and fourth- to sixth-generation bronchi [n = 21]) small airway epithelium of healthy nonsmokers (SAE-NS). D and P signatures were identified as sets of genes significantly up-regulated (red dots) in corresponding regions. Blue dots represent nonsignificant gene probe sets. (B) Biologic annotation categories enriched in the D signature on the basis of Ingenuity Pathway Analysis (IPA). Shown are the top three IPA-predicted upstream regulators and biologic functions based on the P value (bars, left y-axis) and enrichment score (red boxes, right y-axis). (C) STRING9.1-based protein–protein interaction networks in the D signature. Each circle corresponds to an individual gene; colors distinguish clusters determined using a Markov clustering algorithm and annotated using IPA and/or Gene Annotation Tool to Help Explain Relationships (GATHER). The structure of lines reflects the confidence of association, from thick (most confident) to thin (least confident). (D) Microarray-based normalized expression of selected D-signature genes (see Table E2 for full gene names and Figure E1 for more examples, statistics, and polymerase chain reaction validation) in the epithelium of TR (n = 27), large airway epithelium (LAE; fourth- to sixth-generation bronchi [n = 21]) and SAE (10th- to 12th-generation bronchi [n = 63]) of healthy nonsmokers. The direction of the proximal–distal (P–D) axis is shown. (E) Representative images of the P (bronchus) and D airway samples analyzed using immunofluorescence for D-signature markers secretoglobin family 3A member 2 (SCGB3A2), surfactant protein B (SFTPB), and lactotransferrin (LTF) in combination with cilia markers tubulin β4 chain (TUBB4) or dynein axonemal intermediate chain 1 (DNAI1). Nuclei are stained with 4′,6-diamidino-2-phenylindole (blue); scale bar = 20 μm. See Figure E2 for more examples. (F) Frequency of cells expressing SCGB3A2, SFTPB, and LTF in the P and D airway epithelium (n ≥ 3 samples; total, ≥500 cells/group). BH = Benjamini-Hochberg correction; CEBPA = CCAAT/enhancer-binding protein-α; FOXA2 = forkhead box protein A2; GATA6 = GATA-binding protein 6; MGP = matrix Gla protein; NKX2-1 = NK2 homeobox 1; STK40 = serine/threonine kinase 40.
Figure 2.
Figure 2.
Proximal airway epithelial signature. (A) Ingenuity Pathway Analysis–based biologic annotation categories enriched in the proximal signature. Shown are the top three Ingenuity Pathway Analysis–predicted upstream regulators and biologic functions based on the P value (bars, left y-axis) and enrichment score (red boxes, right y-axis). (B) STRING9.1-based protein–protein interaction networks in the P signature. Each circle corresponds to an individual gene (see Figure 1C legend for description). (C) Microarray-based normalized expression of selected P signature genes (see Table E3 for full gene names and Figure E3 for more examples, statistics, and TaqMan validation) in the epithelium from the trachea (TR), large airway epithelium (LAE; n = 21), and small airway epithelium (SAE; n = 63) of healthy nonsmokers. Direction of the proximal-to-distal (P–D) axis is shown. (D) Representative images of the P (bronchus) and D airway samples analyzed using immunofluorescence for P-signature genes uroplakin 1B (UPK1B), sushi repeat-containing protein X-linked 2 (SRPX2), and glutathione peroxidase 2 (GPX2) in combination with cilia marker tubulin β4 chain (TUBB4). Nuclei are stained with 4′,6-diamidino-2-phenylindole (blue); scale bar = 20 μm. See Figure E4 for more examples. (E) Frequency of cells expressing UPK1B, SRPX2, and GPX2 in the P and D airway epithelium (nc ≥ c3 samples; total, ≥500 cells per group). ADH7 = alcohol dehydrogenase 7 (class IV); EGF = epidermal growth factor; EGFR = epidermal growth factor receptor; HOXA1 = homeobox A1; HRAS = H-Ras; TCN1 = transcobalamin 1.
Figure 3.
Figure 3.
Down-regulation of distal (D)-signature expression in the small airway epithelium (SAE) in healthy smokers (S) and in smokers with chronic obstructive pulmonary disease (COPD-S). (A) Volcano plots illustrating differential expression of the D-signature gene probes in the SAE of healthy nonsmokers (NS; n = 63), healthy smokers (S; n = 73), COPD-S (n = 37), and significant probe sets (orange; Benjamini-Hochberg [BH]-corrected P < 0.05). (B) Mean D index in the SAE of indicated groups (described in A). Horizontal line within each bar represents the median for each group; P values are based on the Mann-Whitney U test. (C) Principal component analysis (PCA) of epithelial samples from the trachea (TR-NS; n = 27), large airway epithelium (LAE-NS; fourth- to sixth-generation bronchi; n = 21), and distal SAE (samples described in A) of nonsmokers based on the expression of the D-signature gene probes. (D) Representative images of SAE brushing samples from indicated groups analyzed using immunofluorescence for secretoglobin family 3A member 2 (SCGB3A2) and tachykinin receptor 1 (TACR1). Nuclei are stained with 4′,6-diamidino-2-phenylindole (blue); scale bar = 20 μm. See Figure E6 for more images and statistics. (E) SCGB3A2+ and TACR1+ cells (percentage of total) in the SAE brushing samples from NS (n = 9), S (n = 10), and COPD-S (n = 8). *P < 0.05, **P < 0.01. (F) Representative images of D airways of smokers without lung disease and COPD-S (n = 3 per group) analyzed using immunofluorescence for expression of SCGB3A1 (red) and cilia marker tubulin β4 chain (TUBB4) (green); nuclei are stained with 4′,6-diamidino-2-phenylindole (blue); scale bar = 20 μm. FDR = false discovery rate; PC = principal component.
Figure 4.
Figure 4.
Proximalization of small airway epithelium (SAE) in smokers and in smokers with chronic obstructive pulmonary disease (COPD-S). (A) Volcano plots depicting differential expression of the proximal (P)-signature gene probes in the SAE of healthy nonsmokers (NS; n = 63), healthy smokers (S; n = 73), COPD-S (n = 37), and significant probe sets (orange; Benjamini-Hochberg [BH]-corrected P < 0.05). (B) P index in the SAE of indicated groups (study population as in A). Horizontal line within each bar represents the median value for each group. P values are based on the Mann-Whitney U test. (C) Representative images of SAE brushing samples from indicated groups analyzed using immunofluorescence for proximal signature genes uroplakin 1B (UPK1B) and glutathione peroxidase 2 (GPX2). Nuclei are stained with 4′,6-diamidino-2-phenylindole (blue); scale bar = 20 μm. See Figure E6 for more images and statistics. (D) UPK1B+ and GPX2+ cells (percentage of total) in the SAE brushing samples from healthy NS (n = 9), S (n = 10), and COPD-S (n = 8). **P < 0.01, ***P < 0.001. (E) Representative images of immunofluorescence analysis of the distal airways of S without lung disease and COPD-S (n = 3 per group) for expression of UPK1B and cilia marker tubulin β4 chain (TUBB4), as well as (for S without lung disease) UPK1B and involucrin (IVL) or mucin 5AC (MUC5AC). Scale bar = 20 μm. FDR = false discovery rate.
Figure 5.
Figure 5.
Epidermal growth factor (EGF)/epidermal growth factor receptor (EGFR) signaling in small airway epithelium (SAE) basal stem cells (BCs) promotes smoking-associated distal (D)-to-proximal (P) repatterning phenotype. (A) Microarray-based EGF gene expression in the SAE of healthy nonsmokers (NS; n = 63), healthy smokers (S; n = 73), and smokers with chronic obstructive pulmonary disease (COPD-S; n = 37). Fold changes (FCs) and Benjamini-Hochberg–corrected P values are shown. (B) Representative images showing EGF expression in the D airways of NS and S (n = 3 per group) using immunohistochemistry. (C) Immunofluorescence analysis of SAE brushing samples from healthy NS for BC marker keratin 5 (KRT5) and EGFR. In B and C, scale bar = 20 µm. (D) FC in expression of selected P- and D-signature genes in the epithelium derived from SAE BCs during 28 days of air–liquid interface culture in the presence of EGF (10 ng/ml) versus control BCs (n = 3 experiments). See Figures E9C and E9D for air–liquid interface time-course data and more examples. (E and F) Airway epithelium derived from control and EGF-treated SAE BCs as described in D analyzed using immunofluorescence for expression of indicated (E) D and (F) P signature genes (red), BC marker KRT5 (green), and nuclei (4′,6-diamidino-2-phenylindole [blue]). In E and F, scale bar = 10 µm. FOLR1 = folate receptor 1; GPX2 = glutathione peroxidase 2; HOXA1 = homeobox A1; SCGB3A2 = secretoglobin family 3A member 2; SFTPB = surfactant protein B; SRPX2 = sushi repeat-containing protein X-linked 2.

Comment in

References

    1. Hajj R, Baranek T, Le Naour R, Lesimple P, Puchelle E, Coraux C. Basal cells of the human adult airway surface epithelium retain transit-amplifying cell properties. Stem Cells. 2007;25:139–148. - PubMed
    1. Rock JR, Onaitis MW, Rawlins EL, Lu Y, Clark CP, Xue Y, Randell SH, Hogan BL. Basal cells as stem cells of the mouse trachea and human airway epithelium. Proc Natl Acad Sci USA. 2009;106:12771–12775. - PMC - PubMed
    1. Crystal RG, Randell SH, Engelhardt JF, Voynow J, Sunday ME. Airway epithelial cells: current concepts and challenges. Proc Am Thorac Soc. 2008;5:772–777. - PMC - PubMed
    1. Rock JR, Randell SH, Hogan BL. Airway basal stem cells: a perspective on their roles in epithelial homeostasis and remodeling. Dis Model Mech. 2010;3:545–556. - PMC - PubMed
    1. Kumar PA, Hu Y, Yamamoto Y, Hoe NB, Wei TS, Mu D, Sun Y, Joo LS, Dagher R, Zielonka EM, et al. Distal airway stem cells yield alveoli in vitro and during lung regeneration following H1N1 influenza infection. Cell. 2011;147:525–538. - PMC - PubMed

Publication types