. 2017 Jul 1;75(3):299-307.
doi: 10.1097/QAI.0000000000001382.

The CSF Immune Response in HIV-1-Associated Cryptococcal Meningitis: Macrophage Activation, Correlates of Disease Severity, and Effect of Antiretroviral Therapy

Affiliations

The CSF Immune Response in HIV-1-Associated Cryptococcal Meningitis: Macrophage Activation, Correlates of Disease Severity, and Effect of Antiretroviral Therapy

James E Scriven et al. J Acquir Immune Defic Syndr. .

Abstract

Background: Immune modulation may improve outcome in HIV-associated cryptococcal meningitis. Animal studies suggest alternatively activated macrophages are detrimental but human studies are limited. We performed a detailed assessment of the cerebrospinal fluid (CSF) immune response and examined immune correlates of disease severity and poor outcome, and the effects of antiretroviral therapy (ART).

Methodology: We enrolled persons ≥18 years with first episode of HIV-associated cryptococcal meningitis. CSF immune response was assessed using flow cytometry and multiplex cytokine analysis. Principal component analysis was used to examine relationships between immune response, fungal burden, intracranial pressure and mortality, and the effects of recent ART initiation (<12 weeks).

Findings: CSF was available from 57 persons (median CD4 34/μL). CD206 (alternatively activated macrophage marker) was expressed on 54% CD14 and 35% CD14 monocyte-macrophages. High fungal burden was not associated with CD206 expression but with a paucity of CD4, CD8, and CD4CD8 T cells and lower interleukin-6, G-CSF, and interleukin-5 concentrations. High intracranial pressure (≥30 cm H2O) was associated with fewer T cells, a higher fungal burden, and larger Cryptococcus organisms. Mortality was associated with reduced interferon-gamma concentrations and CD4CD8 T cells but lost statistical significance when adjusted for multiple comparisons. Recent ART was associated with increased CSF CD4/CD8 ratio and a significantly increased macrophage expression of CD206.

Conclusions: Paucity of CSF T cell infiltrate rather than alternative macrophage activation was associated with severe disease in HIV-associated cryptococcosis. ART had a pronounced effect on the immune response at the site of disease.


Conflict of interest statement

The authors have no conflicts of interest to disclose.

Figures

FIGURE 1.
FIGURE 1.
CSF flow cytometry gating. A1, FSC-SSC plot of CSF cells after exclusion of singlets, aggregates, Cryptococcus yeasts, and dead cells. Cells with high FSC noted (circled and marked *); (A2) neutrophils defined as CD66+ and high SSC; (B) CD3 used to identify T cells; (C1) T-cell subsets analyzed using CD4 and CD8; (C2) FSC-SCC view of T cells, “Large” T cells circled and marked *; (C3) HLA-DR expression on CD4+ T cells; (C4) HLA-DR expression on CD8+ T cells; (C5) analysis of “large T cells”—majority comprise CD8+ T cells; (D) further gating on non-T cells using CD14 and CD4 identifies monocyte-macrophages. Population of CD14 monocyte-macrophages are circled and marked †; (E1 and E2) CD14+ and CD14 monocyte-macrophages have similar physical characteristics (FSC-SSC) and similar expression of CD68; (E3–E6) expression of CD206, CD163, HLA-DR, and CD16 (respectively) on CD14+ and CD14 MM; (F) CD3CD4CD14CD16+ cells identified—likely NK cells.
FIGURE 2.
FIGURE 2.
Relationship between CSF immune response and fungal burden. A, PCA plot detailing distribution of participants according to CSF immune response after filtering for variables significantly correlated with CSF fungal burden (P < 0.05, q < 0.1). Axes represent the first three principal components; % displays the degree of total sample variability accounted for by component. Fungal burden is indicated by color (scale at left of plot displays log10 CFU/mL CSF). Participants with a high fungal burden (red, ∼106 CFU/mL) cluster together at the bottom of the plot while participants with low fungal burden (green ∼101 CFU/mL) group together at the top. B, PCA plot of variables significantly correlated with fungal burden that contributed to the PCA. Position in PCA plot indicates the weighting toward the first 3 principal components; variables located in close proximity contribute similarly. Color indicates direction of correlation with fungal load (red—positive correlation, green—negative correlation). Absolute cell counts are expressed in cells per milliliter CSF while relative counts are expressed as a percentage of all CSF leukocytes (%CD45 cells). CD45, leukocytes; DNT, double negative T cells, ie, CD4CD8; WCC, white cell count/μL by microscopy; Lymph, lymphocytes/μL by microscopy; MFI, median fluorescence intensity.
FIGURE 3.
FIGURE 3.
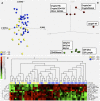
Differences in CSF immune response between participants who developed high intracranial pressure (ICP) during admission and those who did not. A, PCA plot showing distribution of participants according to CSF immune response after filtering for variables significantly associated with raised ICP. Axes indicate the first three principal components. Participants who developed high ICP during admission (≥30 cm H2O—blue) cluster together and broadly separate from those who do not develop high ICP (<30 cm H2O—yellow) according to CSF characteristics. B, PCA plot illustrating the 12 variables that significantly differed between the 2 groups and hence contributed to the PCA [red—significantly greater in subjects with high ICP, green—significantly lower in subjects with high ICP (P < 0.05 and q < 0.1)]. Absolute cell counts are expressed as cells per milliliter CSF; relative counts are expressed either as a percentage of CD45 cells (%CD45) or a percentage of all flow cytometry events (%total). C, Heat map illustrating nonhierarchal cluster analysis of participants according to the same 12 variables detailed in (B). Participants who develop high ICP during admission tend to cluster at the right end of the plot. Crypto, Cryptococcus; FAC, flow cytometry measurement of cell size; Crypto/CD4 FSC, relative size of Cryptococcus in relation to CD4 T cells; Large T, large T cells as detailed in Fig. 1; DNT, double negative T cells, CD4CD8; WCC, white cell count; Lymph, lymphocyte count.
FIGURE 4.
FIGURE 4.
PCA and nonhierarchical cluster analysis examining effect of recent ART initiation on CSF immune response. A, PCA plot showing distribution of subjects according to CSF immune response. Subjects who started taking ART in the previous 12 weeks (blue dots) group together and separate from subjects not taking ART (yellow dots). The participant with unmasking IRIS is marked. B, PCA plot displaying 12 variables that contributed to the PCA. Plot position reflects variable weightings toward the three principal components: red dot (variable significantly increased among participants taking ART); green dot (variable significantly decreased among participants taking ART). Variables with similar contributions are positioned in close proximity; those correlated ≥80% are connected with lines. Statistical significance defined as P < 0.05 and q < 0.1. C, Heat map demonstrating nonhierarchical cluster analysis according to CSF immune response. Subjects who started ART in the previous 12 weeks (blue squares) group together due to similar expression of the 12 variables (rows) detailed in (B). Expression of variable in relation to geometric mean is indicated by color of square (red—increased; green—decreased). %T, relative frequency as a percentage of all CSF T cells; %CD45, relative frequency as a percentage of all CSF leukocytes; MFI, median fluorescence intensity; CD14+, CD14+ monocyte-macrophages; CD14, CD14 monocyte-macrophages; CD206+ %CD14, proportion of CD14 monocyte-macrophages expressing CD206; HLADR %CD4, proportion of CD4 T cells expressing HLA-DR.

References

    1. Emmons CW. Saprophytic sources of Cryptococcus neoformans associated with the pigeon (Columba livia). Am J Hyg. 1955;62:227–232. - PubMed
    1. Goldman DL, Khine H, Abadi J, et al. Serologic evidence for Cryptococcus neoformans infection in early childhood. Pediatrics. 2001;107:E66. - PubMed
    1. Salyer WR, Salyer DC, Baker RD. Primary complex of cryptococcus and pulmonary lymph nodes. J Infect Dis. 1974;130:74–77. - PubMed
    1. Bicanic T, Harrison TS. Cryptococcal meningitis. Br Med Bull. 2004;72:99–118. - PubMed
    1. Cohen DB, Zijlstra EE, Mukaka M, et al. Diagnosis of cryptococcal and tuberculous meningitis in a resource-limited African setting. Trop Med Int Health. 2010;15:910–917. - PubMed

Publication types

MeSH terms