. 2017 Jun;13(6):633-639.
doi: 10.1038/nchembio.2343. Epub 2017 Mar 27.

Near-infrared optogenetic pair for protein regulation and spectral multiplexing

Affiliations

Near-infrared optogenetic pair for protein regulation and spectral multiplexing

Taras A Redchuk et al. Nat Chem Biol. 2017 Jun.

Abstract

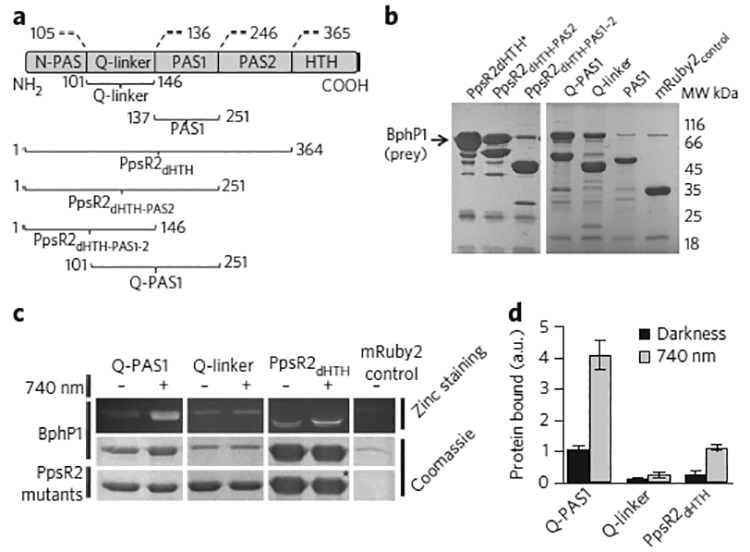
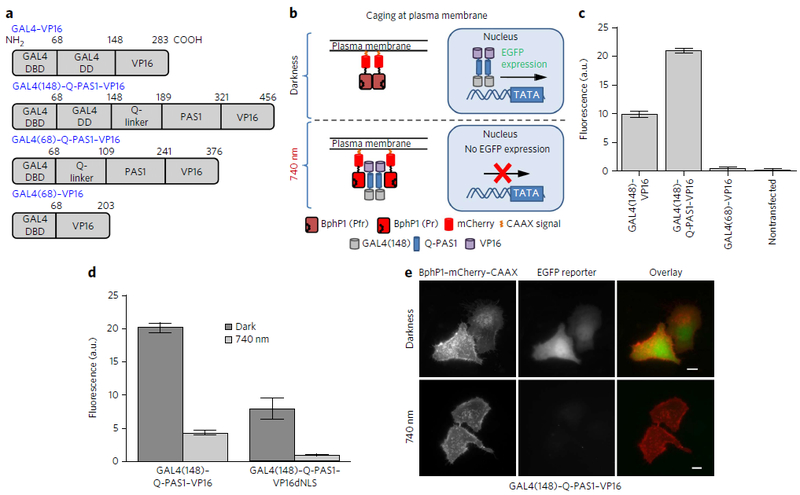
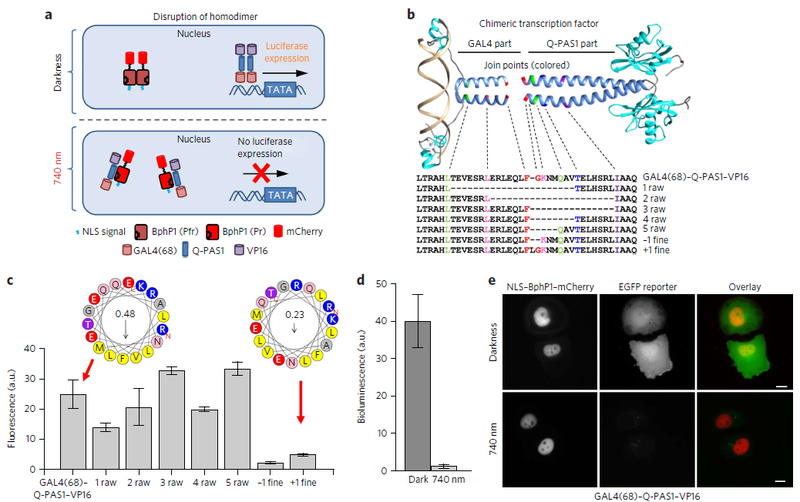
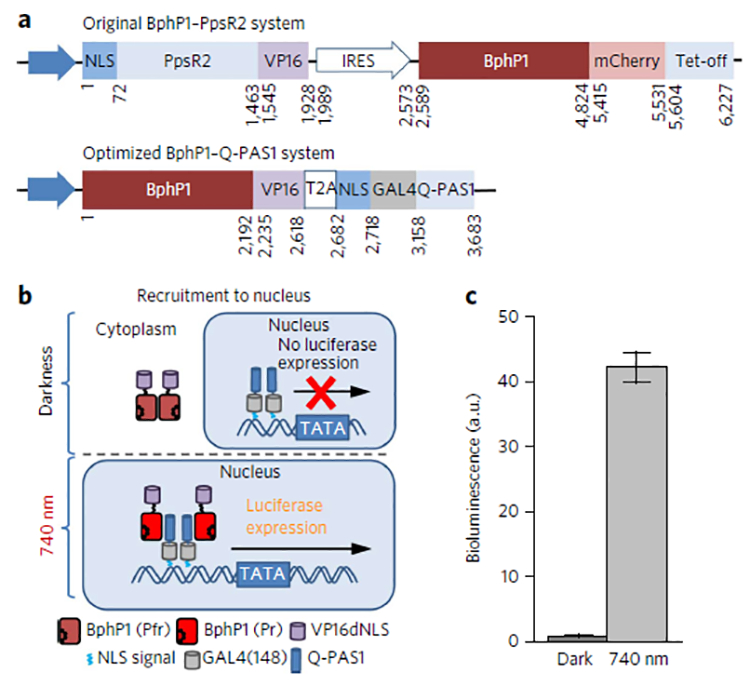
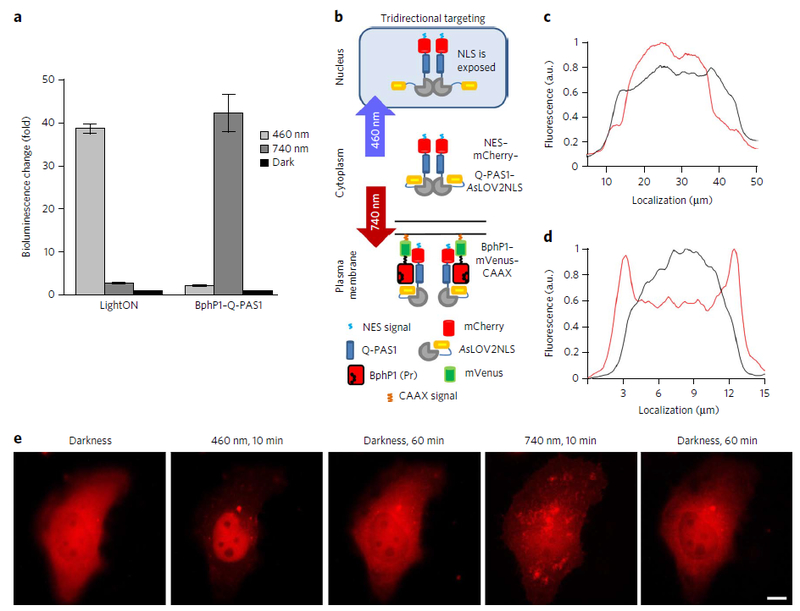
Multifunctional optogenetic systems are in high demand for use in basic and biomedical research. Near-infrared-light-inducible binding of bacterial phytochrome BphP1 to its natural PpsR2 partner is beneficial for simultaneous use with blue-light-activatable tools. However, applications of the BphP1-PpsR2 pair are limited by the large size, multidomain structure and oligomeric behavior of PpsR2. Here, we engineered a single-domain BphP1 binding partner, Q-PAS1, which is three-fold smaller and lacks oligomerization. We exploited a helix-PAS fold of Q-PAS1 to develop several near-infrared-light-controllable transcription regulation systems, enabling either 40-fold activation or inhibition. The light-induced BphP1-Q-PAS1 interaction allowed modification of the chromatin epigenetic state. Multiplexing the BphP1-Q-PAS1 pair with a blue-light-activatable LOV-domain-based system demonstrated their negligible spectral crosstalk. By integrating the Q-PAS1 and LOV domains in a single optogenetic tool, we achieved tridirectional protein targeting, independently controlled by near-infrared and blue light, thus demonstrating the superiority of Q-PAS1 for spectral multiplexing and engineering of multicomponent systems.


Conflict of interest statement

Competing financial interests The authors declare no competing financial interests.

Figures

Figure 1
Figure 1. Characterization of BphP1 interaction with PpsR2 deletion mutants in vitro.
| (a) Domain structure of the PpsR family of proteins and PpsR2 mutants. Amino acid numbers are noted according to a R. palustris PpsR2 sequence (Genbank ANB32144.1). (b) BphP1 interaction with different PpsR2 deletion mutants. Black arrow indicates BphP1 position. (c) BphP1 interactions with PpsR2 mutants containing Q-linker in the presence or absence of 740 nm light. Top and middle panels, bound BphP1 (prey); bottom panel, Q-PAS1, Q-linker and PpsR2dHTH (bait). The bands marked with an asterisk contain the overlaid PpsR2dHTH-mRuby2 and BphP1 proteins, which have similar electrophoretic mobility. (d) Intensities of protein bands in pull-down analysis. Data were normalized to the band intensity of the sample containing Q-PAS1 in darkness. Error bars represent s.e.m.; n = 3 experiments. a.u., arbitrary units. Uncut gel images are provided in Supplementary Figure 4.
Figure 2
Figure 2. Transcription inhibition via light-induced relocalization approach.
| (a) Domain structure of the GAL4–VP16 and GAL4–Q-PAS1–VP16 mutants. GAL4 DNA-binding domain, GAL4 dimerization domain, Q-linker and PAS1 domain of PpsR2, and VP16 transactivation domain are labeled as DBD, DD, Q-linker, PAS1 and VP16, respectively. Numbers refer to amino acid residue position in the corresponding construct. (b) Schematic representation of light-induced transcription inhibition via GAL4(148)–Q-PAS1–VP16 relocalization to the plasma membrane. (c) EGFP expression in HeLa cells cotransfected with different transcription activators and a pG5–EGFP (5× UAS) reporter plasmid. Constructs are marked according to a. Data were normalized to the EGFP expression level achieved with GAL4–VP16. Error bars represent s.e.m.; n = 3 experiments. (d) Comparison of EGFP expression levels launchedby the GAL4(148)–Q-PAS1–VP16 and GAL4(148)–Q-PAS1–VP16dNLS constructs. Data were normalized to the EGFP expression level detected with GAL4(148)–Q-PAS1–VP16dNLS in darkness. Error bars represent s.e.m.; n = 3 experiments. (e) Images of live HeLa cells cotransfected with GAL4(148)–Q-PAS1–VP16, BphP1–mCherry–CAAX and pG5–EGFP reporter plasmid in darkness and after 740 nm illumination. Scale bars, 10 μm. In d and e, the samples were incubated either in darkness or under 740 nm pulsed light (30 s on and 180 s off) of 0.2 mW cm−2 started 6 h after transfection. Analysis was performed 24 h after transfection.
Figure 3
Figure 3. Light-induced dissociation of chimeric transcription factor.
| (a) Schematic representation of light-induced transcription inhibition via disruption of the GAL4(68)–Q-PAS1–VP16 dimer. (b) Structure and sequence alignment of engineered chimeric transcription factors consisting of the Q-PAS1 and GAL4(68) parts fused together. The GAL4(DBD) structure in complex with DNA (PDB ID: 3COQ) and a modified RsPpsR structure (PDB ID: 4HH2)were used for visualization. Join points of the α-helical fusion regions for different constructs are shown with dashed lines and colors. (c) Comparison of the EGFP reporter levels for the different GAL4–Q-PAS1–VP16 fusion constructs co-expressed with NLS–BphP1–mCherry. For each construct, the EGFP induction level was normalized to the EGFP level in cells transfected with pG5–EGFP (5× UAS) reporter plasmid only. Helical wheels represent the α-helical joining regions of chimeric transcription factors with either preserved (like GAL4(68)–Q-PAS1–VP16) or disrupted (+1 fine) coiled-coil motif. The numbers in circles are the calculated hydrophobic moments. (d) Fluc expression in HeLa cells cotransfected with GAL4(68)–Q-PAS1–VP16, NLS–BphP1–mCherry and pFR–Luc reporter plasmid. Error bars represent s.e.m.; n = 3 experiments. (e) Images of live HeLa cells cotransfected with GAL4(68)–Q-PAS1–VP16, NLS–BphP1–mCherry and pG5–EGFP reporter plasmid in darkness and after 740 nm illumination. Scale bars, 10 μm. In d and e the samples were incubated either in darkness or under 740 nm pulsed light (30 s on and 180 s off) of 0.2 mW cm−2 started 6 h after the transfection. Analysis was performed 48 h after the transfection.
Figure 4
Figure 4. Light-controlled activation of reporter expression.
| (a) Constructs encoding the original BphP1–PpsR2 and the enhanced 1.7-fold smaller BphP1–Q-PAS1 transcription activation systems. IRES, ribosome entry site. (b) Schematic representation of light-controlled transcription activation of luciferase reporter via recruitment to nucleus of BphP1–VP16 transactivator. (c) Luciferase reporter expression in HeLa cells cotransfected with an optimized BphP1–Q-PAS1 system and a pFR–Luc reporter according to b. The samples were incubated either in darknessor under 740 nm pulsed light (30 s on and 180 s off) of 0.2 mW cm−2 started 6 h after the transfection. Analysis was performed 48 h after the transfection. Data were normalized to the bioluminescence signal of the cells kept in darkness. Error bars represent s.e.m.; n = 3 experiments.
Figure 5
Figure 5. Spectral multiplexing of the BphP1–Q-PAS1 system with blue-light-activatable tools.
| (a) Light-to-dark ratio of luciferase reporter bioluminescence detected in HeLa cells cotransfected with the LightON and BphP1–Q-PAS1 transcription activation systems, both GAL4–UAS based. Samples were illuminated either by continuous 460 nm light of 1 mW cm−2 or by 740 nm pulsing light of 1 mW cm−2. In the latter case, 30 s light pulses were alternated with 180 s of darkness. Illumination started 6 h after the transfection and continued for 48 h. Data were normalized to the signal of dark sample. Error bars represent s.e.m.; n = 3 experiments. (b) Schematic representation of light-controllable tridirectional subcellular targeting using the merged BphP1–Q-PAS1 and AsLOV2cNLS systems, resulting in the NES–mCherry–Q-PAS1–AsLOV2cNLS construct, termed iRIS. (c) Intensity profile of mCherry fluorescence of iRIS of the cell before (black line) and after (red line) 10 min of 460 nm illumination. (d) Intensity profile of mCherry fluorescence of iRIS of the cell before (black line) and after (red line) 10 min of 740 nm illumination. (e) Sequential targeting of iRIS from a cytoplasm to the nucleus and to the plasma membrane in a single cell after the indicated illumination (10 min of 460 nm of 1 mW cm−2 or 740 nm of 1 mW cm−2 light) and dark relaxation periods. Scale bar, 10 μm.

Comment in

References

    1. Deisseroth K Optogenetics. Nat. Methods 8, 26–29(2011). - PMC - PubMed
    1. Shcherbakova DM, Shemetov AA, Kaberniuk AA & Verkhusha VV Natural photoreceptors as a source of fluorescent proteins, biosensors, and optogenetic tools. Annu. Rev. Biochem 84, 519–550 (2015). - PMC - PubMed
    1. Wang X, Chen X & Yang Y Spatiotemporal control of gene expression by a light-switchable transgene system. Nat. Methods 9, 266–269(2012). - PubMed
    1. Strickland D et al. TULIPs: tunable, light-controlled interacting protein tags for cell biology. Nat. Methods 9, 379–384 (2012). - PMC - PubMed
    1. Niopek D et al. Engineering light-inducible nuclear localization signals for precise spatiotemporal control of protein dynamics in living cells. Nat. Commun 5, 4404(2014). - PMC - PubMed

Publication types

MeSH terms