. 2017 Aug;36(31):4415-4426.
doi: 10.1038/onc.2017.73. Epub 2017 Mar 27.

Hepatic cyclooxygenase-2 overexpression induced spontaneous hepatocellular carcinoma formation in mice

Affiliations

Hepatic cyclooxygenase-2 overexpression induced spontaneous hepatocellular carcinoma formation in mice

H Chen et al. Oncogene. 2017 Aug.

Abstract

Cyclooxygenase (COX)-2 is upregulated in hepatocellular carcinoma (HCC). However, the direct causative effect of COX-2 in spontaneous HCC formation remains unknown. We thus investigate the role and molecular pathogenesis of COX-2 in HCC by using liver-specific COX-2 transgenic (TG) mice. We found spontaneous HCC formation with elevated inflammatory infiltrates and neovessels in male TG mice (3/21, 14.3%), but not in any of male WT mice (0/19). Reduced representation bisulfite sequencing (RRBS) and gene expression microarrays were performed in the HCC tumor and non-HCC liver tissues to investigate the molecular mechanisms of COX-2-driven HCC. By RRBS, DNA promoter hypermethylation was identified in HCC from TG mice. Induction of promoter hypermethylation was associated with reduced tet methylcytosine dioxygenase 1 (TET1) expression by COX-2. TET1 could catalyze the conversion of 5-methylcytosine into 5-hydroxymethylcytosine (5hmC) and prevents DNA hypermethylation. In keeping with this, loss of 5hmC was demonstrated in COX-2-induced HCC. Consistently, COX-2 overexpression in human HCC cell lines could reduce both TET1 expression and 5hmc levels. Integrative analyses of DNA methylation and gene expression profiles further identified significantly downregulated genes including LTBP1, ADCY5 and PRKCZ by promoter methylation in COX-2-induced HCC. Reduced expression of LTBP1, ADCY5 and PRKCZ by promoter hypermethylation was further validated in human HCCs. Bio-functional investigation revealed that LTBP1 inhibited cell proliferation in HCC cell lines, suggesting its potential role as a tumor suppressor in HCC. Gene expression microarrays revealed that signaling cascades (AKT (protein kinase B), STK33 (Serine/Threonine kinase 33) and MTOR (mechanistic target of rapamycin) pathways) were enriched in COX-2-induced HCC. In conclusion, this study demonstrated for the first time that enhanced COX-2 expression in hepatocytes is sufficient to induce HCC through inducing promoter hypermethylation by reducing TET1, silencing tumor-suppressive genes and activating key oncogenic pathways. Inhibition of COX-2 represents a mechanism-based target for HCC prevention.


Conflict of interest statement

The authors declare no conflict of interest.

Figures
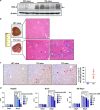
Figure 1
Figure 1
Spontaneous HCC formation in liver of COX-2 TG mice. (a) Western blot of livers from WT and TG mice. The cell lysates were blotted with anti-COX-2 or anti-β-actin antibody. The arrow indicates the position of COX-2. (b) Macroscopic photographs and hematoxylin and eosin (H&E) staining (× 100 magnification) of representative images of livers from WT and COX-2 TG mice. The liver from WT mice appeared normal. Liver from TG mice showed formation of well-differentiated HCC (gray arrow or T), inflammatory infiltration (blue arrow) and neovessels (white arrow). (c) F4/80 staining of representative pictures of livers from WT and COX-2 TG mice with HCC formation (× 200 magnification). The presence of macrophages was shown as brown-staining (black arrow). Average number of macrophages were counted in different areas (at least five) in each sample (n = 3 for both genotypes). (d) Celecoxib inhibited cell growth of different HCC cell lines in a dose-dependent manner. The cell lines were exposed to different concentrations of celecoxib for 5 days. Data are represented as mean±s.d. P-values were obtained by independent Student'st-test. (*P<0.05, **P<0.01).
Figure 2
Figure 2
COX-2 overexpression increase the expression of target genes of AKT, STK33 and MTOR pathways in HCC of TG mice. (a) The expression of 1742 DEGs (twofold change and adjusted P-value <0.05) in three HCCs from different TG mice compared with three livers of TG mice (w/o HCC) are shown in a heat map (the green, black and red colors represent lower than average, close to average and higher than average expression value, respectively). Unsupervised hierarchical clustering analysis was applied. (b) GSEA enrichment analysis of oncogenic signature for 1742 DEGs. Normalized enrichments score (NES) and nominal P-value are shown per each gene set analyzed. Sixteen gene sets are significantly enriched at nominal P-value <0.05. GSEA enrichment plots shown in right panel demonstrates upregulation of AKT, STK33 and MTOR pathway (top gene sets) signatures in COX-2-induced HCC. (c) Western blot of three normal livers from WT mice, three livers from TG mice (w/o HCC) and three HCC from TG mice. The tissue lysates were blotted with indicate antibody. Levels of proteins were quantified by Image J (National Institutes of Health, Bethesda, MD, USA). The bar graph represents relative expression of each protein with mean values from WT group set as 1.0. Data are represented by mean±s.d. P-values were obtained by independent Student'st-test (*P<0.05, **P<0.01). (d) The graph shows each gene and the number of subsets in which it appears by leading edge analysis. (e) The mRNA expression of Hbegf, Krt23, Pak1 and TNFRSF12A in HCCs from TG mice (n=3) compared with normal livers from WT mice (n=3) or livers from TG mice without HCC (n=3). Data are represented as mean±s.d. P-values were obtained by independent Student'st-test. (*P<0.05, **P<0.01).
Figure 3
Figure 3
Characterization of DNA methylation in COX-2-induced HCC of TG mice. (a) The methylation levels of 3717 DMRs (1.25-fold change and false discovery rate <5%) in three HCC vs three livers (w/o HCC) and from different TG mice are shown in a heat map (the blue, green and yellow colors represent lower than average, close to average and higher than average methylation level, respectively). Unsupervised hierarchical clustering analysis was applied. (b) DNA methylation patterns in different genomic regions, including upstream, 5’-UTR, promoter, coding sequence (CDS), 3’-UTR, intron and downstream. (c) Scatter plot of 695 DMRs at promoter region in three HCC vs three livers (w/o HCC) from different TG mice. The data are represented by median with interquartile range. (d) Enrichment of Kyoto Encyclopedia of Genes and Genomes (KEGG) pathways analysis for 3717 DMRs and 1742 DEGs. Pathways with 10 or more genes involved and a P-value <1e-06 are considered as significantly affected. Gene number involved in different pathway is indicated above bars.
Figure 4
Figure 4
Identification and validation of aberrantly methylated genes involved in COX-2-induced HCC in mice. (a) Dot plots of genes of differential expression and methylation (promoter) in three HCC vs three livers (w/o HCC) from different TG mice. Several candidate genes with differential expression (delta CT value) and altered methylation level (delta M value) were listed in the right panel. (b) The mRNA expression of seven candidate genes (Adcy5, Axin2, Ltbp1, Nkd1, Ntn1, Plxnc1 and Prkcz) in three normal livers from WT mice, three livers from TG mice (w/o HCC) and three HCC from TG mice. Data are represented by mean±s.d. P-values were obtained by independent Student's t-test. (*P<0.05, **P<0.01). (c) Bisulfite genomic sequencing of Adcy5, Ltbp1, Nkd1 and Plxnc1 in HCCs from TG mice compared with normal livers from WT mice. The location of CpG island and bisulfite genomic sequencing target regions were shown for each gene, with black bars denoting the first exons. TSS, transcription start site. Average methylation levels at each site are shown. P-values were obtained by repeated-measures analysis of variance.
Figure 5
Figure 5
COX-2 overexpression reduced the expression and activity of TET1. (a) Comparison of genes that are involved in DNA methylation and demethylation process between three HCC vs three livers (w/o HCC) from different TG mice (data was acquired from gene expression array). The fold change (FC) ratio (HCC vs non-HCC) and P-value were list in the top panel. The bottom panel showed the mRNA expression of TET1 in three normal livers from WT mice, three livers from TG mice (w/o HCC) and three HCC from TG mice by using real-time PCR. Data are represented by mean±s.d. P-values were obtained by independent Student's t-test. (*P<0.05, **P<0.01). (b) Western blot of three normal livers from WT mice, three livers from TG mice (w/o HCC) and three HCC from TG mice. The tissue lysates were blotted with indicate antibody (top panel). Levels of proteins were quantified by Image J. The bar graph (bottom panel) represents relative expression of each protein with mean values from WT group set as 1.0. Data are represented by mean±s.d. P-values were obtained by independent Student's t-test. (*P<0.05, **P<0.01). (c) Comparison of global 5hmC quantification in three normal livers from WT mice, three livers from TG mice (w/o HCC) and three HCC from TG mice. P-values were obtained by independent Student's t-test. (*P<0.05, **P<0.01). (d, f) In two different stable COX-2-overexpressing cell lines (Hep3B and SK-Hep1), the mRNA expression (d) and protein expression (e) of TET1 were measured. Data are represented by mean±s.d. (n⩾3). P-values were obtained by independent Student's t-test. (**P<0.01, ***P<0.001). (f) Global 5hmC levels were assayed by dot blot analysis for two different stable COX-2-overexpressing cell lines (Hep3B and SK-Hep1). Quantification was performed by Image J. (g) Celecoxib treatment increases TET1 expression both at mRNA (top panel) and protein level (bottom panel) in dose-dependent manner. HepG2 was deprived of serum overnight and then treated with different dosage of celecoxib for 12 h. Data are represented by mean±s.d. (n⩾3). P-values were obtained by independent Student's t-test. (***P<0.001). Protein quantification was performed by Image J. (h) Schematic diagram of the molecular events for COX-2 inducing hypermethylated genes.
Figure 6
Figure 6
COX-2-induced hypermethylated genes (ADCY5, Ltbp1 and Prkcz) are novel tumor suppressors inactivated by DNA methylation in human HCC. (a) The mRNA expression level of ADCY5, Ltbp1 and Prkcz in 16 normal livers (NL), 30 pairs of HCC (T) and adjacent non-HCC (NT) liver tissues. Data are represented by mean±s.d. P-values were obtained by Mann–Whitney U-test or Wilcoxon matched-pairs test. (*P<0.05, **P<0.01, ***P<0.001). (b) The mRNA expression level of ADCY5, Ltbp1 and Prkcz in 371 primary HCC (T) and 50 adjacent non-HCC (NT) liver tissue from TCGA LIHC (liver HCC) data set. Data are represented by mean±s.d. P-values were obtained by Mann–Whitney U-test. (*P<0.05, **P<0.01, ***P<0.001). (c) The Spearson correlation between mRNA expression level and methylation level of ADCY5, Ltbp1 and Prkcz in 371 primary HCC samples from TCGA data. The gene methylation levels were determined as the average beta-values of different probes, which are mapped to CpG island in their promoter regions on genes.
Figure 7
Figure 7
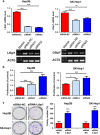
Knockdown of LTBP1 promoted HCC cell proliferation. (a) Hep3B and SK-Hep1 cells were transfected with negative control small interfering RNA (siRNA-NC), Ltbp1 target siRNA1 or siRNA2 for 4 days. Ltbp1 knockdown efficiency in different cell lines were validated by q-PCR (top panel) and reverse transcriptase (RT)–PCR (bottom panel). Data are represented by mean±s.d. P-values were obtained by independent Student's t-test. (**P<0.01, ***P<0.001). (b) The cell viability was measured at day 4 by MTT assay. P-values were obtained by independent Student's t-test. (*P<0.05, ***P<0.001). (c) Knockdown of Ltbp1 by Ltbp1 target siRNA2 promoted colony formation in Hep3B and SK-Hep1 cells. (***P<0.001).

References

    1. Wang D, Dubois RN. The role of COX-2 in intestinal inflammation and colorectal cancer. Oncogene 2010; 29: 781–788. - PMC - PubMed
    1. Gupta S, Srivastava M, Ahmad N, Bostwick DG, Mukhtar H. Over-expression of cyclooxygenase-2 in human prostate adenocarcinoma. Prostate 2000; 42: 73–78. - PubMed
    1. Singh B, Berry JA, Shoher A, Ramakrishnan V, Lucci A. COX-2 overexpression increases motility and invasion of breast cancer cells. Int J Oncol 2005; 26: 1393–1399. - PubMed
    1. Lim HY, Joo HJ, Choi JH, Yi JW, Yang MS, Cho DY et al. Increased expression of cyclooxygenase-2 protein in human gastric carcinoma. Clin Cancer Res 2000; 6: 519–525. - PubMed
    1. Yip-Schneider MT, Barnard DS, Billings SD, Cheng L, Heilman DK, Lin A et al. Cyclooxygenase-2 expression in human pancreatic adenocarcinomas. Carcinogenesis 2000; 21: 139–146. - PubMed

Publication types