. 2017 Jul 27;36(30):4288-4298.
doi: 10.1038/onc.2017.63. Epub 2017 Mar 27.

SerpinB2 regulates stromal remodelling and local invasion in pancreatic cancer

Affiliations

SerpinB2 regulates stromal remodelling and local invasion in pancreatic cancer

N L E Harris et al. Oncogene. .

Abstract

Pancreatic cancer has a devastating prognosis, with an overall 5-year survival rate of ~8%, restricted treatment options and characteristic molecular heterogeneity. SerpinB2 expression, particularly in the stromal compartment, is associated with reduced metastasis and prolonged survival in pancreatic ductal adenocarcinoma (PDAC) and our genomic analysis revealed that SERPINB2 is frequently deleted in PDAC. We show that SerpinB2 is required by stromal cells for normal collagen remodelling in vitro, regulating fibroblast interaction and engagement with collagen in the contracting matrix. In a pancreatic cancer allograft model, co-injection of PDAC cancer cells and SerpinB2-/- mouse embryonic fibroblasts (MEFs) resulted in increased tumour growth, aberrant remodelling of the extracellular matrix (ECM) and increased local invasion from the primary tumour. These tumours also displayed elevated proteolytic activity of the primary biochemical target of SerpinB2-urokinase plasminogen activator (uPA). In a large cohort of patients with resected PDAC, we show that increasing uPA mRNA expression was significantly associated with poorer survival following pancreatectomy. This study establishes a novel role for SerpinB2 in the stromal compartment in PDAC invasion through regulation of stromal remodelling and highlights the SerpinB2/uPA axis for further investigation as a potential therapeutic target in pancreatic cancer.


Conflict of interest statement

The authors declare no conflict of interest.

Figures

Figure 1
Figure 1
The SERPINB2 gene is frequently deleted in PDAC. (a) Alteration frequencies of the PAS component genes SERPINB2, PLAU, PLAUR and SERPINE1 across various cancer types in the cBIO cancer genomics database. (b) Oncoprint showing mutual exclusivity of SERPINB2 PLAU, PLAUR and SERPINE1 genomic alterations in pancreatic tumours in the UTSW dataset (n=109).
Figure 2
Figure 2
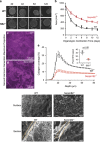
Fibroblast-derived SerpinB2 is necessary for efficient collagen I matrix contraction. (a) Photographs showing collagen I matrix contraction over 12 days in the presence of either wild-type or SerpinB2−/− MEFs. (b) Changes in area (mm2) of collagen matrices shown in (a) over the 12-day contraction period. (c, d): Maximum projection through 0–80 μm z-stack of SHG signal intensity of collagen I matrices formed with either (c) wild-type or (d) SerpinB2−/− MEFs (e) Quantification of SHG signal intensity within matrices formed by either wild-type or SerpinB2−/− MEFs, inset: mean SHG signal peak. (fi) SEM ultrastructure analysis showing surface (f, g) or sagittal section (h, i) of collagen I matrices. Values shown are mean±s.e.m. from three separate experiments, statistical analysis performed using an unpaired t-test.
Figure 3
Figure 3
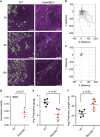
SerpinB2 is necessary for efficient migration of MEFs during collagen I matrix contraction. (a) Migration of wild-type or SerpinB2−/− MEFs through collagen I matrices was tracked over 14 h at day 6 of contraction. Collagen (magenta) was detected using SHG and wild-type or SerpinB2−/− MEFs were detected through stable GFP expression. Cell tracks are marked by a vector tail (white). (b, c) Polar plots denoting cell directionality (x,y distance) and total displacement (μm) of either wild-type (b) or SerpinB2−/− (c) MEFs through collagen I matrices over the time course (14 h) of the experiment. (d) Normalized motility of wild-type or SerpinB2−/− MEFs through collagen I matrices was computed by tracking cell position over time (mean±s.em. from three separate matrices). (e) Average number of protrusions per cell over time (mean±s.e.m. across five time points). (f) Average length of protrusions per cell across the course of the experiment (mean±s.e.m. across five time points). Statistical analyses were performed using unpaired t-tests.
Figure 4
Figure 4
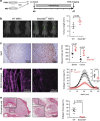
Stromal SerpinB2 attenuates PDAC tumour growth in mixed cell allografts. (a) A mixture of MEFs (wild-type or SerpinB2−/−) and PDAC cells (at a 3:1 MEF:PDAC ratio) were inoculated s.c. into nude mice and allowed to grow for 7 days prior to euthanasia and tissue collection. (b) IVIS imaging of MEF-GFP fluorescence; tumour volume quantification (mean±s.e.m., n=5). (c) Ki-67 staining and quantification at both the border and centre of tumours (with insets showing high magnification view). (d) Maximum projection of SHG signal intensity within MEF:PDAC tumours and quantification of SHG signal (inset shows intensity of SHG signal peak). (e) Picrosirius staining (with insets showing high magnification view) and quantification of collagen I/III coverage of tumours. Individual values shown are means from three representative images per tumour, from five animals per group with mean±s.e.m. denoted. Statistical analyses were performed using unpaired t-tests.
Figure 5
Figure 5
Stromal SerpinB2 attenuates PDAC local invasion in mixed cell allografts. Photomicrographs and quantification of local cell invasion into muscle tissue (a, b) or subcutaneous fat (c, d), by either wild-type or SerpinB2−/− MEF:PDAC tumours. Individual values shown are from five or four animals per group in WT or SerpinB2−/− respectively, with mean±s.e.m. denoted. Statistical analyses were performed using unpaired t-tests. (e) uPA enzymatic activity (IU/mg) from either wild-type or SerpinB2−/− MEF:PDAC tumour lysates (bars represent mean±s.e.m., n=3).
Figure 6
Figure 6
PLAU expression is associated with poor prognosis following pancreatectomy. Hazard ratio (a) and overall survival (b) in relation to PLAU mRNA expression (log scale) for a cohort of patients with resected PDAC (n=141). Increasing PLAU expression was significantly associated with poor prognosis following pancreatectomy (Cox model coefficient 0.387; likelihood ratio P=1.9e-4). Standard error of the fit is shown as a light blue band, and the distribution of PLAU expression in the cohort as a grey density distribution. 10th, 50th and 90th percentiles of the PLAU expression distribution are indicated by vertical green, blue, and orange lines, respectively. The Cox model predicted survival curves for these three percentiles of PLAU expression are further illustrated in (b).

Similar articles

Cited by

References

    1. Siegel RL, Miller KD, Jemal A. Cancer statistics, 2016. CA Cancer J Clin 2016; 66: 7–30. - PubMed
    1. Neesse A, Michl P, Frese KK, Feig C, Cook N, Jacobetz MA et al. Stromal biology and therapy in pancreatic cancer. Gut 2011; 60: 861–868. - PubMed
    1. Goldstein D, El-Maraghi RH, Hammel P, Heinemann V, Kunzmann V, Sastre J et al. nab-Paclitaxel plus gemcitabine for metastatic pancreatic cancer: long-term survival from a phase III trial. J Natl Cancer Inst 2015; 107: dju413. - PubMed
    1. Von Hoff DD, Ervin T, Arena FP, Chiorean EG, Infante J, Moore M et al. Increased survival in pancreatic cancer with nab-paclitaxel plus gemcitabine. N Engl J Med 2013; 369: 1691–1703. - PMC - PubMed
    1. Rowe RG, Sheikh R, Weiss SJ, Walsh N, Clynes M, O’Connor R et al. Challenges of drug resistance in the management of pancreatic cancer. Cancer Epidemiol Biomarkers Prevent 2000; 9: 1647–1661. - PubMed

Publication types

Substances