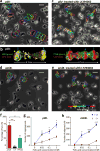
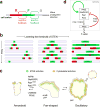
. 2017 Apr;19(4):329-340.
doi: 10.1038/ncb3495. Epub 2017 Mar 27.

Altering the threshold of an excitable signal transduction network changes cell migratory modes

Affiliations

Altering the threshold of an excitable signal transduction network changes cell migratory modes

Yuchuan Miao et al. Nat Cell Biol. 2017 Apr.

Abstract

The diverse migratory modes displayed by different cell types are generally believed to be idiosyncratic. Here we show that the migratory behaviour of Dictyostelium was switched from amoeboid to keratocyte-like and oscillatory modes by synthetically decreasing phosphatidylinositol-4,5-bisphosphate levels or increasing Ras/Rap-related activities. The perturbations at these key nodes of an excitable signal transduction network initiated a causal chain of events: the threshold for network activation was lowered, the speed and range of propagating waves of signal transduction activity increased, actin-driven cellular protrusions expanded and, consequently, the cell migratory mode transitions ensued. Conversely, innately keratocyte-like and oscillatory cells were promptly converted to amoeboid by inhibition of Ras effectors with restoration of directed migration. We use computational analysis to explain how thresholds control cell migration and discuss the architecture of the signal transduction network that gives rise to excitability.


Conflict of interest statement

COMPETING FINANCIAL INTERESTS

The authors declare no competing financial interests.

Figures
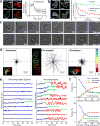
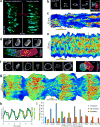
Figure 1
Figure 1. Acute clamping of PIP2 at lowered levels triggers cell migratory mode transitions
(a) Left, confocal images of myr-GFP-FKBP-FKBP (green) and mCherry-FRB-Inp54p (red) before and after rapamycin treatment. Right, temporal profile of normalized intensity of cytosolic mCherry (mean±s.d., n=25 cells). (b) Left, confocal images of PIP2 biosensors PHPLCδ-YFP and GFP-NodulinQ534P before and after rapamycin treatment. Right, normalized ratios of membrane to cytosol intensity of PHPLCδ-YFP (black), GFP-NodulinQ534P (red), and GFP-Nodulin (blue) following rapamycin treatment at time 0 (mean±s.e.m, n=21 cells for each biosensor). Initial data are shown in Supplementary Fig. 1a. (“Nodulin” refers to the Nlj6-like nodulin domain of the Arabidopsis Sec14-nodulin protein AtSfh1. NodulinQ534P is a mutant with defects in self-oligomerization and thus diminished affinity for PIP2 compared with Nodulin.) (c) Time lapse phase-contrast images showing the transition of an amoeboid cell to a fan-shaped (top) or an oscillatory cell (bottom). Scale bars in all images represent 10 μm. (d) Centroid tracks showing random movement of amoeboid (left), fan-shaped (middle), and oscillatory (right) cells. Each track lasts 10 min and was reset to the same origin. Insets show color-coded (1 min intervals) outlines of a cell. Velocity (μm/min) and directedness are 4.2±1.6 and 0.39 for amoeboid, 11.7±1.8 and 0.91 for fan-shaped, and 7.5±2.0 and 0.40 for oscillatory cells (mean +/− s.d, n=50 cells for each). (e) Temporal profiles of normalized areas of 10 control (left) and experimental cells (right). Dashed lines indicate the addition of rapamycin at time 0. Based on the corresponding movies, amoeboid, fan-shaped, and oscillatory modes are colored as blue, green, and red respectively. (f) Fractions of each migratory mode in 10-min time windows in a cell population of ~100 cells before and after Inp54p recruitment. 0.5 μM (top) or 5 μM (bottom) rapamycin were added at time 0.
Figure 2
Figure 2. Actin profiles show distinct spatiotemporal patterns in amoeboid, fan-shaped, and oscillatory cells
(a) T-stacks of LimE∆coil-YFP (LimE) in initially amoeboid cells before and after recruiting inactive (left) or active (right) Inp54p. Red dashed line indicates the addition of rapamycin. (b, d, f) Time-lapse confocal images and color-coded overlays of the YFP fluorescence intensities at 2 sec intervals of an amoeboid (b), fan-shaped (d), and oscillatory cell (f) expressing LimE. Scale bars represent 10 μm. (c, e, g) Kymographs of cortical LimE intensity in the same amoeboid (c), fan-shaped (e), and oscillatory cells (g). Durations of the kymographs are 5 min (c, e) and 10 min (g). (h) Temporal profiles of cell area (black) and normalized mean cortical LimE intensity (green) of the oscillatory cell above. Normalization for changes in cell shape is based on the kymograph of stably recruited mCherry-FRB-Inp54p intensity in the same cell as shown in Supplementary Fig. 5d. (i) Relative frequency of different LimE sizes (percentage of cell perimeter) appearing in each mode of migration (>2000 time points combined from 10 kymographs of each mode automatically thresholded and quantified in MATLAB).
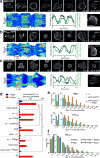
Figure 3
Figure 3. A signal transduction network mediates the transitions of cell migratory modes
(a, b, c) Dynamics of signal transduction biosensors RBD-YFP (a), PHcrac-YFP (b), and PTEN-GFP (c). In each panel, top shows time-lapse confocal images of cells transitioning from amoeboid to oscillatory mode after rapamycin addition at time 0; bottom left shows kymograph of cortical intensity of each biosensor in an oscillatory cell; bottom middle shows temporal profile of cell area (black) and normalized mean cortical signaling intensity (green) in the corresponding oscillatory cell (normalization for changes in cell shape based on the kymograph of stably recruited mCherry-FRB-Inp54p intensity in the same cell as shown in Supplementary Fig. 5e–g.); bottom right shows confocal image of a fan-shaped cell. Scale bars in all images represent 10 μm. (d) Percentage (mean±s.d., n=3experiments, >500 cells in each experiment, ***P<0.0001, one-way ANOVA with post-hoc Tukey HSD test) of fan-shaped plus oscillatory cells 10 min before (blue bars) and 10–20 min (red bars) after the addition of rapamycin at time 0. (e) Distributions of different sizes of RBD-GFP (top) and PHcrac-YFP (bottom) activity in cells of wt, pkbA-/pkbR1-, and pkbA-/pkbR1- overexpressing PKBA. Cells were treated with 5 μM LatrunculinA for 30 min. (f) Distributions of different sizes of PHcrac-YFP activity in wt cells, as well as wt cells expressing myr-FKBP-FKBP plus PKBA-mCherry-FRB, treated with DMSO or rapamycin in addition to 5 μM LatrunculinA for 30 min. More than 3000 cells from 3 independent experiments were analyzed in each condition in e and f.
Figure 4
Figure 4. Properties of the STEN waves are altered independent of cytoskeleton
(a, b) Merged time-lapse TIRFM images of each mode of migration. PHcrac-YFP (green) and mCherry-FRB-Inp54p (red) are shown in a, and LimE-YFP (green) and mCherry-FRB-Inp54p (red) in b. The mCherry-FRB-Inp54p signals serve as membrane markers following recruitment. The white arrows point to new waves initiating at the front of fan-shaped cells. (c) Time-lapse TIRFM images of PHcrac-YFP (green) and LimE-RFP (red) in the same oscillatory cell. (d) Scatter plot of wave speed in each mode of migration (n=31 cells for each mode and the horizontal lines indicate median, P=0.00019 comparing amoeboid and fan-shaped, P<0.0001 comparing amoeboid and oscillator, Wilcoxon-Mann-Whitney rank sum test). (e) PHcrac-YFP activities in LatrunculinA-treated cells. Left, confocal images of PHcrac-YFP in the same cells before and after Inp54p recruitment. Right, Distributions of different sizes of PHcrac-YFP activity in cells expressing mCherry-FRB-Inp54p(D281A) or mCherry-FRB-Inp54p (in addition to myr-FKBP-FKBP) treated with DMSO or rapamycin for 30 min. More than 3000 cells from 3 independent experiments were analyzed in each condition. (f, g) Kymographs of cortical PHcrac-YFP (f) or PTEN-GFP (g) intensity in cells treated with 5 μM LatrunculinA. The red dashed lines indicate time 0 at which rapamycin was added. Solid vertical lines on the left of each kymograph represent 20 μm. Scale bars in all images represent 10 μm.
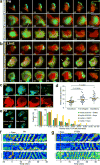
Figure 5
Figure 5. The threshold for STEN activation is lowered
(a, b) Responses of PHcrac-YFP to global cAMP stimulations in the same cells before (blue box) and after (red box) Inp54p recruitment. Time-lapse confocal images of PHcrac (green) and mCherry-FRB-Inp54p (red) are shown on the top. cAMP was added at time 0 (316 pM cAMP in a and 100 nM cAMP in b). Scale bars represent 10 μm. Temporal profiles of normalized mean cytosolic PHcrac intensity are shown at the bottom, with blue line indicating before and red after rapamycin treatment (mean±s.e.m., n=26 cells for a and n=18 cells for b). (c, d) Normalized PHcrac responses (drop of cytosolic intensity) to different doses of cAMP before (blue) and after (red) rapamycin. c, recruiting Inp54p. d, recruiting inactive Inp54p. Response in each individual condition was normalized to that upon 100 nM cAMP stimulation (mean±s.e.m., from the lowest to the highest cAMP concentrations, n=24, 21, 26, 21, 25, 18 cells in c, and n=21, 21, 23, 23, 21, 23 cells in d, *P=0.046, **P=0.002, ***P<0.0001, two-tailed t-test).
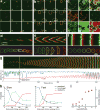
Figure 6
Figure 6. Simulations of the excitable network with varying thresholds successfully capture various cell migratory modes
(a, b, c) Two-dimensional simulations showing waves of activity propagating outward and extinguishing, with gradually decreasing threshold from a to c. Green and red represent the activator (F) and inhibitor (R) activities, respectively. Yellow denotes the region where the two overlap. (d, e, f) Kymographs (top) and simulated cell morphologies (bottom) give rise to amoeboid, fan-shaped and oscillatory behaviors, respectively. The cell shapes are color-coded from blue to red, showing the same cell at subsequent times; the colored crosses denote a fixed origin. (g) Kymograph (top) of the response to a gradual threshold decrease over a larger time scale. The threshold was held constant until t=100 (dotted line), after which it was lowered exponentially. The lower plots show the maximum (blue) and mean (red) levels of activity. (h) Fraction of cells in one of the three migratory modes as a function of time, with slowly (left) and rapidly (right) decreasing threshold obtained from simulations of 45–55 cells. (i) Normalized response curve to different levels of external stimuli (cAMP) for higher (blue) and lower (red) thresholds. Normalization is with respect to the 100 nM cAMP response.
Figure 7
Figure 7. Innately fan-shaped or oscillatory cells can be converted to amoeboid mode
(a, c, d, e) Phase-contrast images of pikI- (a, c) and amiB- cells (d, e) treated with (c, e) or without (a, d) LY294002 (LY). Color-coded outlines (1 min apart) of several cells were imposed on top of the phase images, with magenta outlining the current cells. Scale bars represent 25μm. (b) T-stacks of merged confocal images of oscillatory pikI- cells expressing RBD-YFP and LimE-RFP (left) or PTEN-GFP and LimE-RFP (right). Blue arrows indicate the spreading phases during the oscillation. (f) Percentage of fan-shaped cells in amiB- before and after 30 μM LY treatment, and after 20 μM PP242 treatment (mean±s.d., n=3 experiments, >100 cells in each experiment, *P=0.0043, **P=0.0002, one-way ANOVA with post-hoc Tukey HSD test). (g, h) Chemotaxis assays before (red) and after (blue) LY treatment. Number of cells migrating through pores into folic acid filled chambers and controls are shown (mean±s.e.m., n=3 experiments, >7500 cells in each experiment, *P=0.0036, 0.0033, 0.0013 in g, *P=0.0019 and ***P<0.0001 in h, two-tailed t-test). g, pikI-; h, amiB-.
Figure 8
Figure 8. Propagating waves of STEN activity control cell migratory modes
(a) Snapshot of the cortical membrane showing regions where the STEN is in B- (grey), F- (green), and R- (red) states. Positive feedback, depicted as mutual inhibition between F- and B states, and negative feedback from R- to F-states, together with diffusion of network components, advances the wave unidirectionally (black arrow). (b) During amoeboid migration (left), network activities initiate locally and spread in waves that dissipate over a short distance. Since the F-state organizes cytoskeletal activities, this pattern controls the formation of pseudopodia. When the threshold of the network is lowered (middle), the waves initiate at larger zones and spread faster and further around the cell before dissipating. When the threshold is further lowered, initiated waves propagate even further to swiftly cover the nearly entire membrane. Color scheme is same as in a. (c) Schematic representation of STEN and cytoskeletal activities in amoeboid, fan-shaped, and oscillatory cells. (d) Proposed molecular architecture of STEN. PIP2 levels antagonize while GbpD(GEF), Rap1, and RasC promote the positive feedback loop (green) of the excitable network. PKBs serve in a delayed negative feedback loop (red) through a set of their substrates including Sca1 and PI5K, and promote F-actin through other sets of substrates.

References

    1. Bosgraaf L, Van Haastert PJ. The ordered extension of pseudopodia by amoeboid cells in the absence of external cues. PloS one. 2009;4:e5253. - PMC - PubMed
    1. Barnhart EL, Allen GM, Julicher F, Theriot JA. Bipedal locomotion in crawling cells. Biophys J. 2010;98:933–942. - PMC - PubMed
    1. Mattila PK, Lappalainen P. Filopodia: molecular architecture and cellular functions. Nat Rev Mol Cell Biol. 2008;9:446–454. - PubMed
    1. Krause M, Gautreau A. Steering cell migration: lamellipodium dynamics and the regulation of directional persistence. Nat Rev Mol Cell Biol. 2014;15:577–590. - PubMed
    1. Reichman-Fried M, Minina S, Raz E. Autonomous modes of behavior in primordial germ cell migration. Dev Cell. 2004;6:589–596. - PubMed

Publication types

MeSH terms

LinkOut - more resources