. 2017 Mar 27;13(3):e1005443.
doi: 10.1371/journal.pcbi.1005443. eCollection 2017 Mar.

Geometry can provide long-range mechanical guidance for embryogenesis

Affiliations

Geometry can provide long-range mechanical guidance for embryogenesis

Mahamar Dicko et al. PLoS Comput Biol. .

Abstract

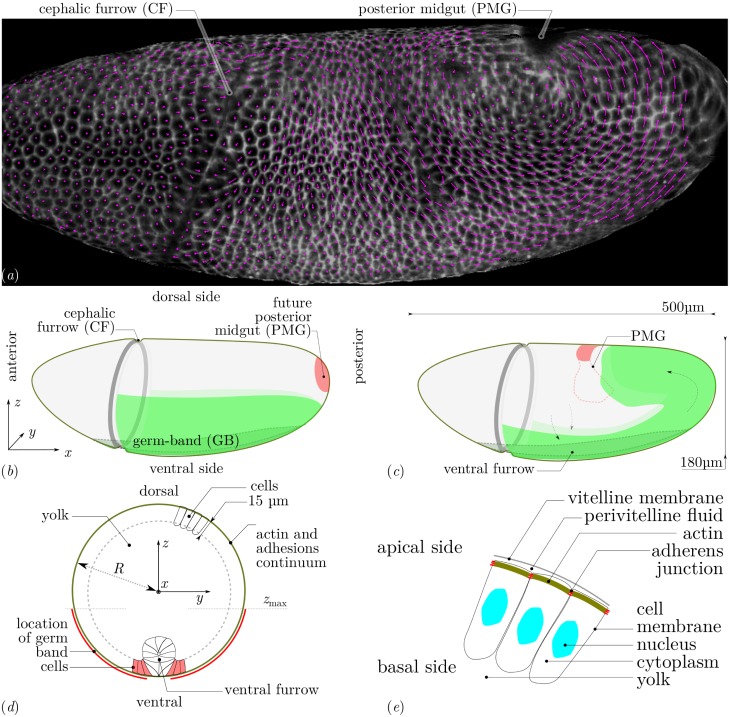
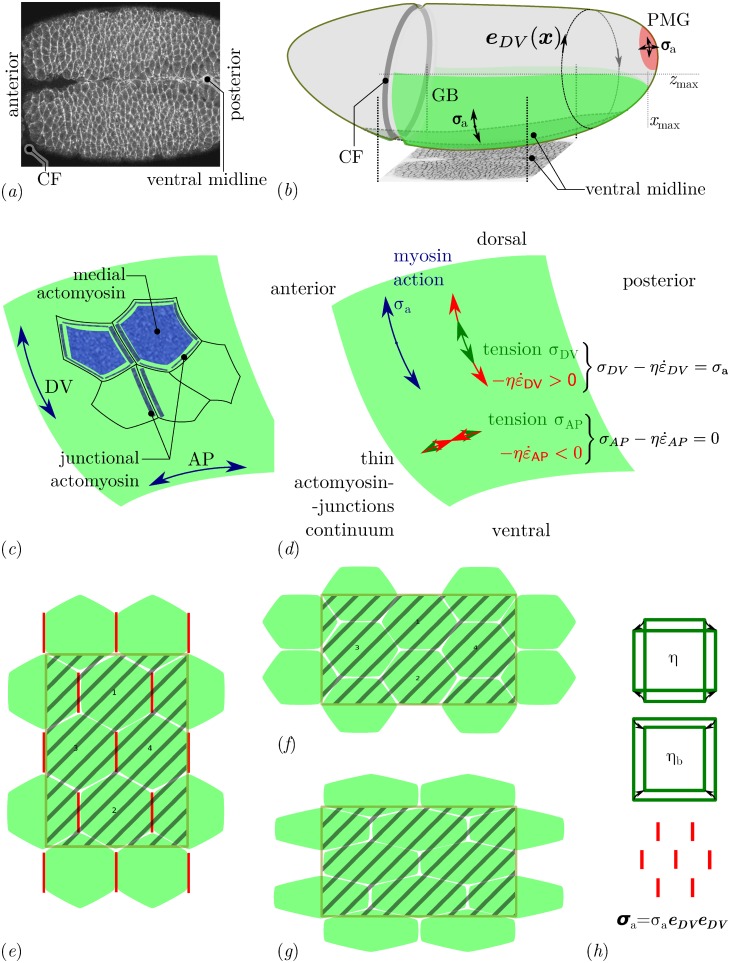
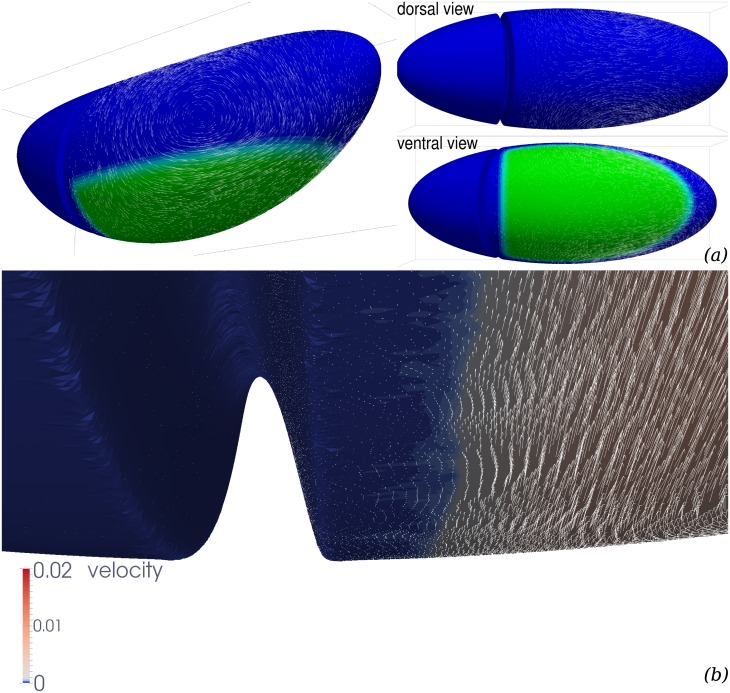
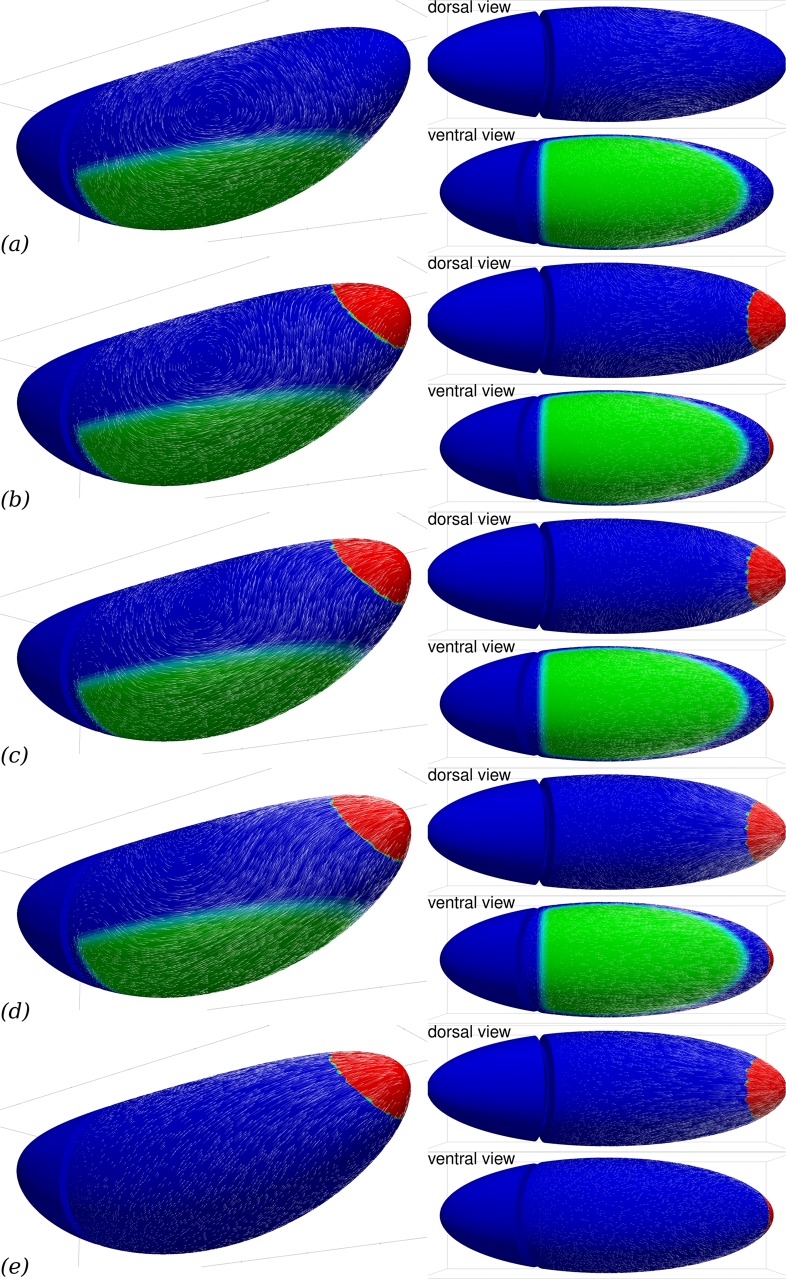
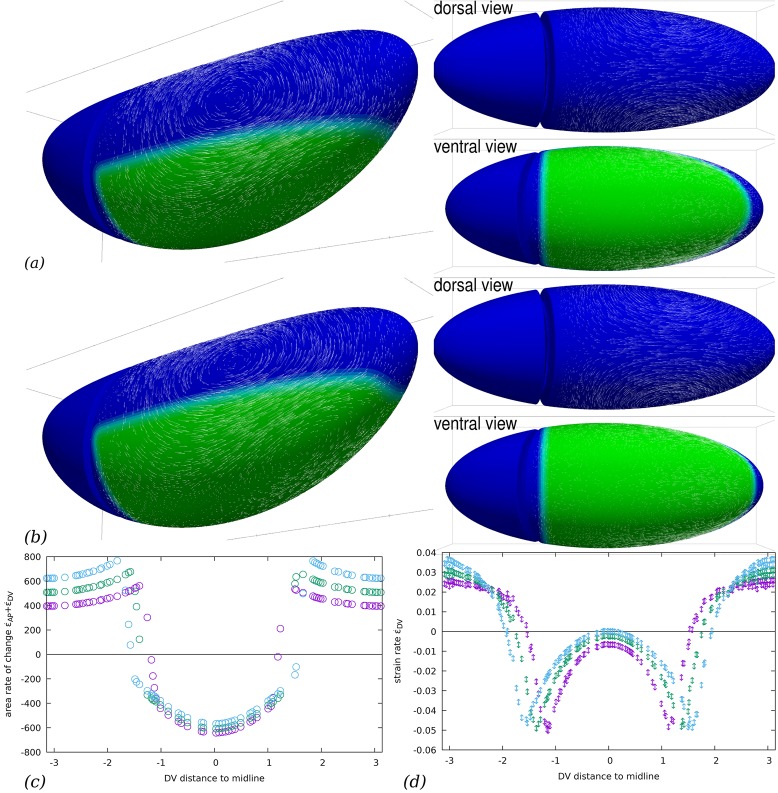
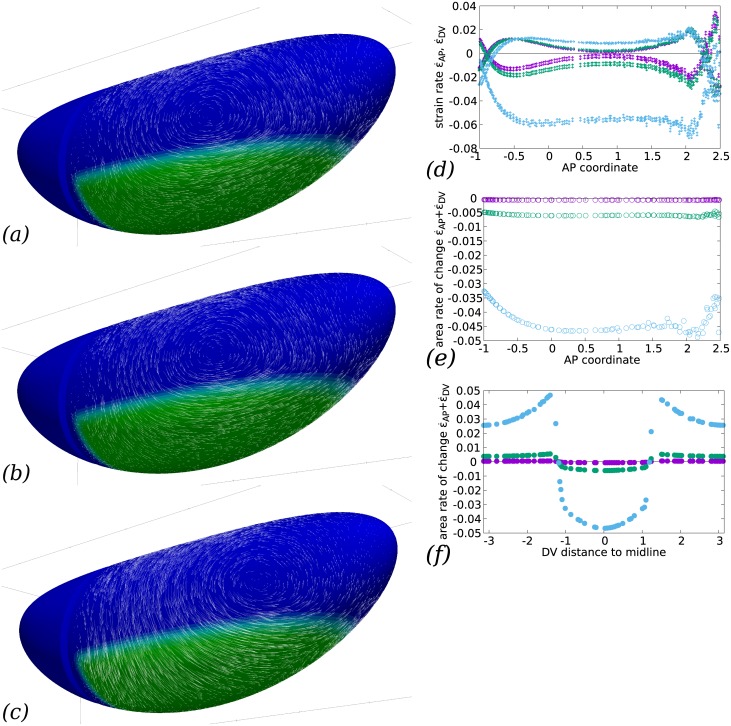
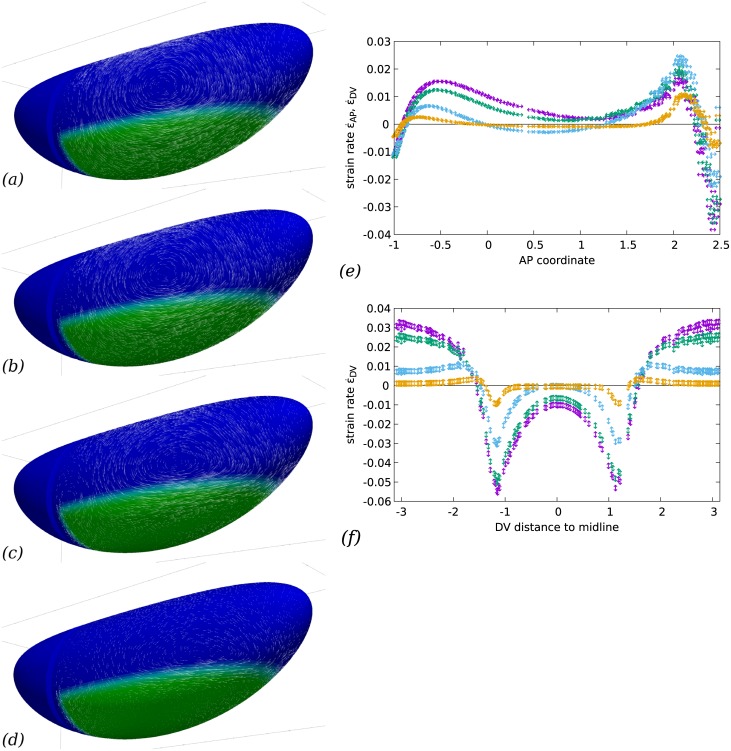
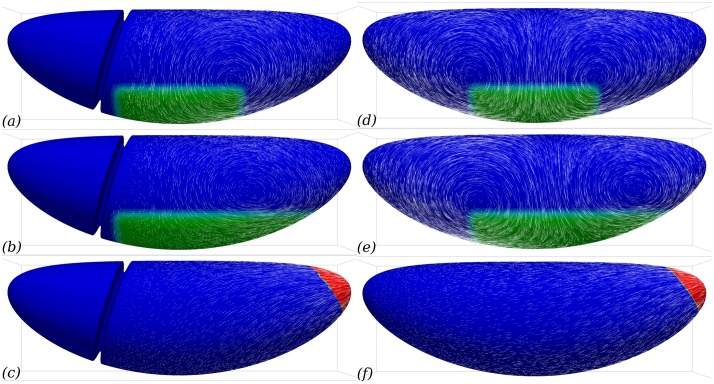
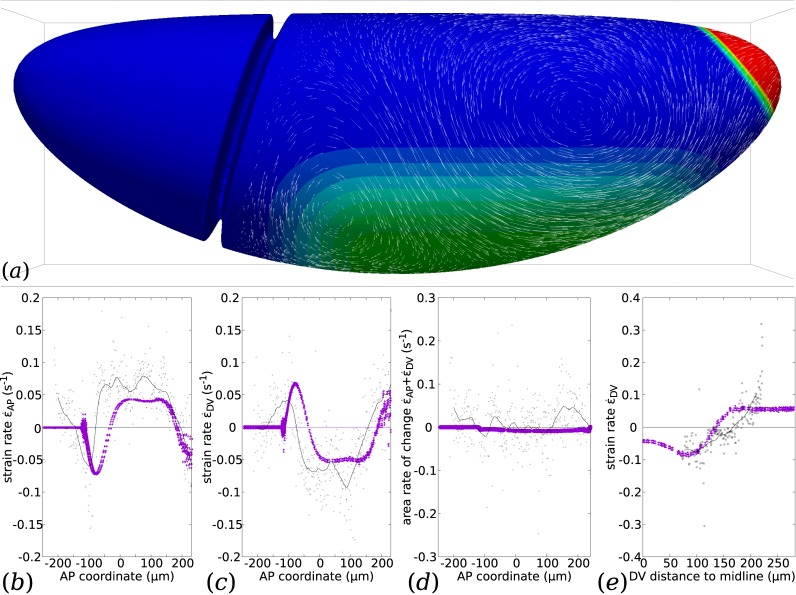
Downstream of gene expression, effectors such as the actomyosin contractile machinery drive embryo morphogenesis. During Drosophila embryonic axis extension, actomyosin has a specific planar-polarised organisation, which is responsible for oriented cell intercalation. In addition to these cell rearrangements, cell shape changes also contribute to tissue deformation. While cell-autonomous dynamics are well described, understanding the tissue-scale behaviour challenges us to solve the corresponding mechanical problem at the scale of the whole embryo, since mechanical resistance of all neighbouring epithelia will feedback on individual cells. Here we propose a novel numerical approach to compute the whole-embryo dynamics of the actomyosin-rich apical epithelial surface. We input in the model specific patterns of actomyosin contractility, such as the planar-polarisation of actomyosin in defined ventro-lateral regions of the embryo. Tissue strain rates and displacements are then predicted over the whole embryo surface according to the global balance of stresses and the material behaviour of the epithelium. Epithelia are modelled using a rheological law that relates the rate of deformation to the local stresses and actomyosin anisotropic contractility. Predicted flow patterns are consistent with the cell flows observed when imaging Drosophila axis extension in toto, using light sheet microscopy. The agreement between model and experimental data indicates that the anisotropic contractility of planar-polarised actomyosin in the ventro-lateral germband tissue can directly cause the tissue-scale deformations of the whole embryo. The three-dimensional mechanical balance is dependent on the geometry of the embryo, whose curved surface is taken into account in the simulations. Importantly, we find that to reproduce experimental flows, the model requires the presence of the cephalic furrow, a fold located anteriorly of the extending tissues. The presence of this geometric feature, through the global mechanical balance, guides the flow and orients extension towards the posterior end.


Conflict of interest statement

The authors have declared that no competing interests exist.

Figures

Fig 1
Fig 1
(a) Lateral view of a wildtype Drosophila embryo and flow of cells during GB extension. White, two-dimensional rendering of signal of membrane markers in an apical curved image layer of a three-dimensional z-stack acquired by light-sheet microscopy (specifically, mSPIM) at an arbitrary time instant (late fast phase of GB extension). Magenta, two-dimensional projection of the displacement of the centroid of each cell over the following 30 seconds. (b) Geometry and tissue configuration of Drosophila embryo [5] immediately prior to GB extension. Tissues situated at the outer surface are in solid colors, dashed lines correspond to structures internal to the embryo. (c) Sketch of morphogenetic movements and tissue configuration during GB extension and PMG invagination. (d) Geometry and structures of mechanical relevance in a transverse cut. The coordinate origin is in the centre. Contiguous cells form a continuous surface at the periphery of the embryo, the external limit is the cell’s apical side, the internal one (dashed line) their basal side. Only some cells are drawn. On the ventral side, a ventral furrow forms before GB extension and seals at the ventral midline just as the GB starts extending. Within the cells, actin structures form apically and are connected from one cell to the other by adhesive molecules, forming an embryo-scale continuum at the periphery of the embryo. The GB is highlighted in red, in this region myosin is activated in a planar-polarised manner. (e) Sketch of structures of mechanical relevance in the epithelial cells. The vitelline membrane is a rigid impermeable membrane. The perivitelline fluid is incompressible and viscous. The actomyosin of Drosophila cells is located at their apical surface, it is a thin layer (< 1 μm) connected to other cell’s actomyosin via adherens junctions. The cytoplasm of cells behaves as an incompressible viscous fluid during the flow [32]. It is enclosed in the cell membranes, which have a low permeability but present excess area compared to cell’s volume. Beyond the basal surface of the cell monolayer, the yolk is an incompressible viscous fluid.
Fig 2
Fig 2. Myosin distribution during GB extension.
(a) Fluorescently labeled myosin in the GB and midline over a ventral region early in GB extension [5]. The myosin is significantly denser along DV-oriented cell junctions (y direction) than along AP-oriented ones (x direction). This planar polarisation can be quantified [11, 19, 41]. (b) Sketch of the geometry of the entire embryo with the planar-polarised GB region (green) and the isotropically contracting PMG region (red) [5]. The region shown in panel a is shown from below. Isotropic contraction is assumed to be linked with an isotropic action of myosin, thus σa is an isotropic tensor in the PMG, whereas planar polarisation results in an anisotropic prestress σa [21], whose orientation we take as eDVeDV, where eDV is a tangential unit vector orthogonal to the main axis of the embryo. (c) Sketch of the different pools of myosin present at the cell apices. Junctional myosin is associated with cell-cell junctions, and may form supracellular cables. Medial myosin is apical myosin not associated with junctions. (d) Tangential apical stresses in an arbitrary region of the GB. According to the constitutive relation, Eq (2), the (opposite of) viscous stress -ηε˙ and mechanical stress σ need to balance the myosin prestress σa in both AP and DV directions. Since myosin prestress is zero along AP, the mechanical stress is equal to the viscous stress in this direction, σAP=ηε˙AP, thus AP tension results in extension. In the DV direction, we have σDVηε˙DV=σa, resulting in a combination of DV tension and contraction (convergence). The global mechanical balance, Eq (1), has to be solved in order to calculate σ and ε˙. (e)–(h) Tissue strain, cell intercalation and cell shape change schematics (e) Initial cell arrangement, with planar-polarised myosin along DV-oriented cell-cell junctions (vertical) and the definition of a region of interest to track tissue deformation (hashed area) (f) A combination of cell intercalation (cells marked 1 and 2 are now neighbours) and cell shape and area changes leads to a tissue-scale deformation [15]. The region of interest has now a reversed aspect ratio along AP and DV, and has changed area. (g) A different combination of these cell-scale events (here no intercalation but more extensive pure shear of single cells and same area change) can lead to the same tissue-scale deformation. (h) Tissue scale resistance to deformation can be quantified by two numbers, a shear viscosity η and a second viscosity ηb corresponding to the additional resistance to area variations. Planar-polarised myosin prestress can be retained at tissue scale as an anisotropic prestress tensor σa.
Fig 3
Fig 3. Flow field generated by planar-polarised myosin contractility in the GB.
Parameters are ηb/η = 103, cf/η = 1/R, where R is the radius of a transverse cut of Γ, see Fig 1d. The GB region is defined as the ventral region posterior to cephalic furrow, and more ventral than a coronal plane zmax = −0.2R, see Fig 1. (a) Global view. The cephalic furrow is represented by a trough, the ventral furrow is not represented as we assume it to have sealed completely at the time corresponding to the simulations. Green, ventral region of the GB where we assume myosin planar-polarised contractility. White arrows, velocity vectors (arbitrary units, not all vectors calculated are represented). (b) Close-up of the region close to cephalic furrow and ventral midline. Every velocity vector calculated is represented, in arbitrary units 10 times larger than in panel (a).
Fig 4
Fig 4. PMG invagination can contribute to GB extension.
Parameters are the same as in Fig 3, reprinted in (a), but (be) another region (red) is actively contracting in an isotropic way, mimicking the effect of PMG invagination on neighbouring tissues. From (b) to (d), the isotropic PMG contraction intensity is doubled each time. (e), effect of isotropic PMG contraction in the absence of any myosin activity in the GB itself.
Fig 5
Fig 5. Influence of the patterning of myosin activation.
(ab) Flow field generated by planar-polarised myosin contractility in the GB. Parameters are the same as in Fig 3, but the region of planar-polarised myosin recruitment is larger: (a) zmax = 0, (b) zmax = 0.2R (compare to Fig 3 where zmax = −0.2R). The same phenomenology is observed, with a strong posterior-oriented GB extension. Close to the midline, the tissue is not extended and goes towards anterior (slightly for zmax = 0, significantly for zmax = 0.2R). (c) Rate of area change as a function of the DV distance to ventral midline (in units of R), along a transverse cut midway along AP (x = 0), for zmax = −0.2R (purple symbols), zmax = 0 (green symbols), and zmax = 0.2R (cyan symbols). In the region where myosin prestress is nonzero, area decreases, while it increases outside this region. (d) Rate of DV strain as a function of the DV distance to ventral midline (in units of R), along a transverse cut midway along AP (x = 0), for zmax = −0.2R (purple symbols), zmax = 0 (green symbols), and zmax = 0.2R (cyan symbols). Dorsally, there is a DV extension and ventrally a DV contraction. A peak of DV contraction is located at the boundary of the myosin activated region in each case.
Fig 6
Fig 6. Influence of the bulk viscosity on the convergence and extension of GB.
(ac) Flows calculated for (a) ηb/η = 103, (b) ηb/η = 102, (c) ηb/η = 10. While the posterior-wards flow at the GB posterior end is similar, the lateral flow is strongly affected with a much larger ventral-wards convergent flow along DV when the bulk viscosity is reduced to 10 (whereas no qualitative change is seen between 103 and 102). The position of the vortex centre is also much modified for low bulk viscosity. (d) Rates of strain in the DV (↕ symbols) and AP (↔ symbols) directions for the three choices of ηb/η (purple, 103, green, 102, cyan, 10), as a function of AP coordinate x (in units of R) close to the midline (y = 0.2R). In the GB, DV rate is negative (convergence) and AP rate positive (extension). The DV rate of strain is increasingly negative for low bulk viscosity, indicating a stronger convergent flow, while the AP rate increases much less, indicating little change in the rate of GB extension. Posterior to the GB (AP coordinate x ≳ 2R), the DV and AP strain rate values ramp and invert their sign, indicating that the direction of elongation swaps from AP to DV, which corresponds to the splayed velocity vectors seen at the posterior limit of the GB e.g. in panel a. Anterior to the GB (AP coordinate x ≃ −R), the same effect is observed due to the obstacle of the cephalic furrow. (e) Rate of area change for the same choices of ηb/η, confirming that area decreases much more for lower bulk viscosity in the GB region. (f) Rate of area change for the same choices of ηb/η as a function of the DV distance (in units of R) to ventral midline, along a transverse cut midway along AP (x = 0). When ηb/η is sufficiently small to allow area variations, the GB region exhibits area reduction and dorsal region area increase.
Fig 7
Fig 7. Friction with vitelline membrane and/or cytosol and yolk modifies the flow pattern.
(ad) Global flow pattern. Parameters are the same as in Fig 3, but the hydrodynamic length varies between Λ = 10R (a), Λ = R (b, reprinted from Fig 3), Λ = R/10 (c), and Λ = R/100 (d). In all cases the GB extends posteriorly. In the cases of small hydrodynamic length, convergence and extension flow occur mostly in regions where there is a gradient of contractility. Overall, friction renders the effect of actomyosin activity more local to regions where they exhibit a variation, hence vortex structures are more localised next to these regions with higher friction and have less influence in regions of uniform actomyosin activity (dorsally or close to ventral midline e.g.) (e) Rates of strain in the AP direction for the four choices of Λ/R (purple, 10R, green, 1, cyan, 1/10 and orange, 1/100), as a function of AP coordinate x (in units of R) close to the midline (y = 0.2R). The overall magnitude of strain decreases with increased friction, as an increasing part of the energy provided by myosin activity needs to overcome friction in addition to deforming the cell apices. The rate of strain is uniformly positive (elongation) only when Λ is close to unity or smaller, else a region of shortening appears in the central part of GB. (Note that since area change is close to zero, the DV strain value is very close and opposite to the value of AP strain everywhere.) (f) Rate of strain in the DV direction for the four choices of Λ, as a function of AP coordinate x (in units of R) close to the midline (y = 0.2R). DV rate of strain always peaks close to the boundary of the GB area where myosin is active, in relative terms the peak is more pronounced for large frictions. Dorsally, there is always a positive DV rate of strain, indicating a DV elongation due to the pull of the neighbouring converging GB. This is matched with an AP shortening of a similar magnitude. Ventrally, the negative rate of strain (indicating convergence) is observed to decay when the hydrodynamic length becomes small, in that case the DV narrowing is limited to a narrow band at the DV edge of the GB. This localisation effect of small hydrodynamic length is also seen for the dorsal DV elongation, but to lesser extent.
Fig 8
Fig 8. Cephalic furrow (CF) can guide GB extension to be mostly posterior-wards.
Lateral view of flow fields generated by myosin contractility in the presence (ac) or absence (df) of a cephalic furrow. (a, d) With a hypothetical symmetric planar-polarised myosin activity, the presence of CF orients the flow towards the posterior whereas it is perfectly symmetric in its absence. (b, e) With a realistic asymmetric planar-polarised myosin activity, the presence of CF still has a major role in orienting the flow the towards posterior. Although the asymmetric myosin patterning induces a asymmetric flow in the absence of the CF, the flow is not biased towards the posterior. (c, f) The flow created by PMG invagination is much less sensitive to the presence of CF.
Fig 9
Fig 9. Simulation of GB extension with proposed parameters for the WT Drosophila and comparison with an example of real data.
(a) Flow calculated for a proposed choice of parameters ηb = 102η, cf/η = 1/R, and a proposed choice of myosin prestress distribution and polarisation, as shown in colour code. The intensity of the prestress is graded at the boundary of the myosin-activated region. (be) Rates of strain predicted by the simulation (purple symbols) along specific AP or DV-oriented lines, and measured from the example of tracked data presented in Fig 1a (tissue strain rate calculated at cell centroids, gray dots; LOESS regression with 25-micron window, black curve). (b) Rate of strain in the AP direction as a function of AP coordinate x close to the midline (y = 0.2R). (c) Rate of strain in the DV direction as a function of AP coordinate x close to the midline (y = 0.2R). (d) Rate of area change as a function of AP coordinate x close to the midline (y = 0.2R). (e) Rate of strain in the DV direction as a function of the DV distance to ventral midline, along a transverse cut midway along AP (x = 0).

References

    1. Heisenberg CP, Bellaiche Y. Forces in tissue morphogenesis and patterning. Cell. 2013;153:948–962. 10.1016/j.cell.2013.05.008 - DOI - PubMed
    1. Mao Y, Tournier AL, Hoppe A, Kester L, Thompson BJ, Tapon N. Differential proliferation rates generate patterns of mechanical tension that orient tissue growth. EMBO J. 2013;32:2790–2803. 10.1038/emboj.2013.197 - DOI - PMC - PubMed
    1. Martin AC. Pulsation and stabilization: Contractile forces that underlie morphogenesis. Dev Biol. 2010;341:114–125. 10.1016/j.ydbio.2009.10.031 - DOI - PubMed
    1. Martin AC, Gelbart M, Fernandez-Gonzalez R, Kaschube M, Wieschaus EF. Integration of contractile forces during tissue invagination. J Cell Biol. 2010;188:735–749. 10.1083/jcb.200910099 - DOI - PMC - PubMed
    1. Lye CM, Sanson B. Tension and epithelial morphogenesis in Drosophila embryos In: Labouesse M, editor. Forces and Tension in Development. vol. 95 of Curr. Topics Dev. Biol. Elsevier; 2011. p. 145–187. 10.1016/B978-0-12-385065-2.00005-0 - DOI - PubMed

Publication types

MeSH terms

LinkOut - more resources