. 2017 Mar 27;13(3):e1006701.
doi: 10.1371/journal.pgen.1006701. eCollection 2017 Mar.

A genetic switch controls the production of flagella and toxins in Clostridium difficile

Affiliations

A genetic switch controls the production of flagella and toxins in Clostridium difficile

Brandon R Anjuwon-Foster et al. PLoS Genet. .

Abstract

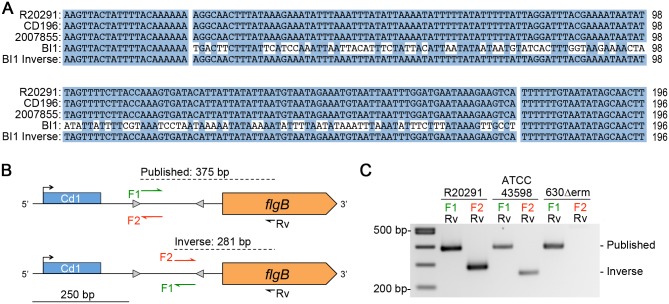
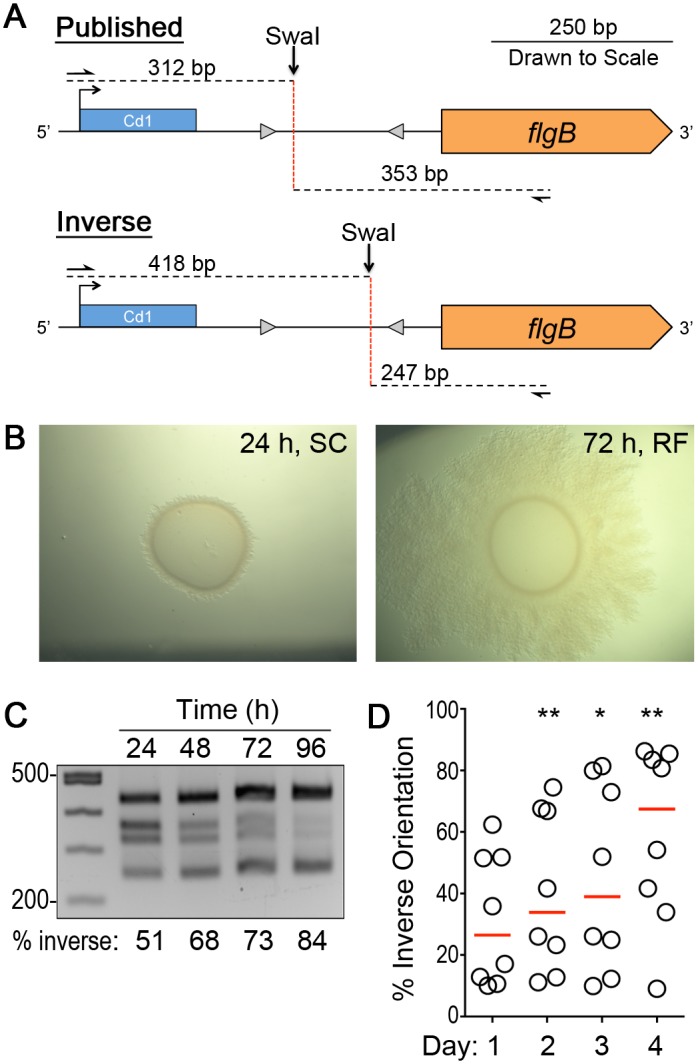
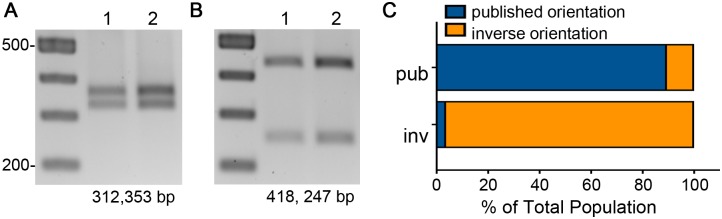
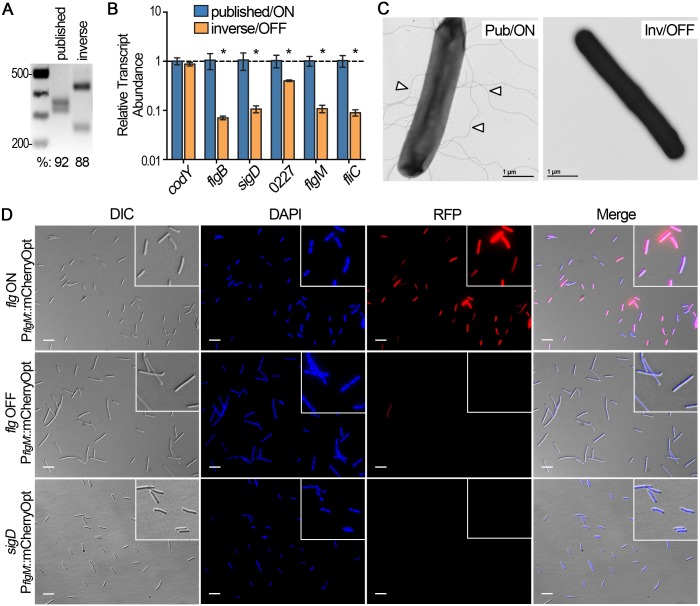
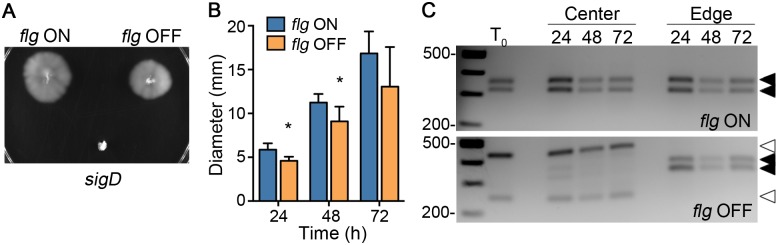
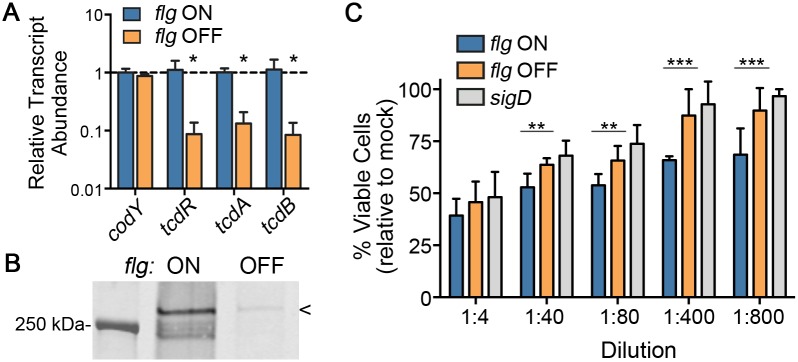
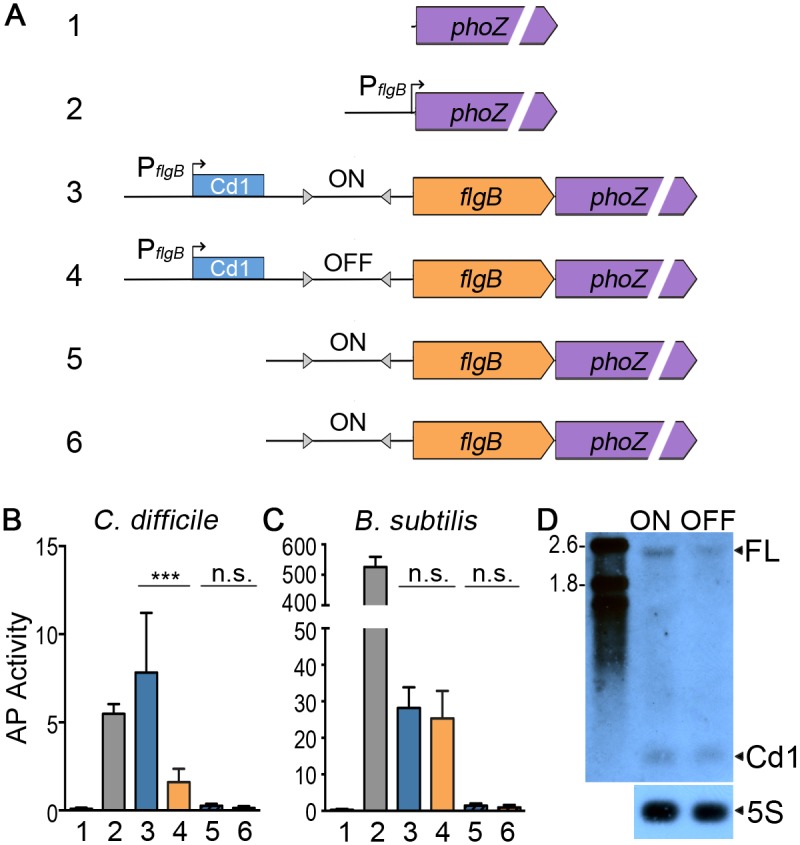
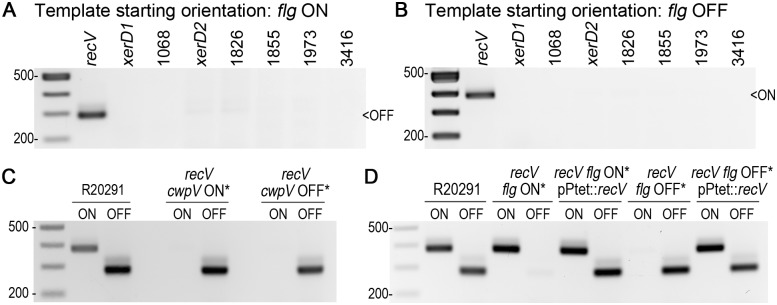
In the human intestinal pathogen Clostridium difficile, flagella promote adherence to intestinal epithelial cells. Flagellar gene expression also indirectly impacts production of the glucosylating toxins, which are essential to diarrheal disease development. Thus, factors that regulate the expression of the flgB operon will likely impact toxin production in addition to flagellar motility. Here, we report the identification a "flagellar switch" that controls the phase variable production of flagella and glucosylating toxins. The flagellar switch, located upstream of the flgB operon containing the early stage flagellar genes, is a 154 bp invertible sequence flanked by 21 bp inverted repeats. Bacteria with the sequence in one orientation expressed flagellum and toxin genes, produced flagella, and secreted the toxins ("flg phase ON"). Bacteria with the sequence in the inverse orientation were attenuated for flagellar and toxin gene expression, were aflagellate, and showed decreased toxin secretion ("flg phase OFF"). The orientation of the flagellar switch is reversible during growth in vitro. We provide evidence that gene regulation via the flagellar switch occurs post-transcription initiation and requires a C. difficile-specific regulatory factor to destabilize or degrade the early flagellar gene mRNA when the flagellar switch is in the OFF orientation. Lastly, through mutagenesis and characterization of flagellar phase locked isolates, we determined that the tyrosine recombinase RecV, which catalyzes inversion at the cwpV switch, is also responsible for inversion at the flagellar switch in both directions. Phase variable flagellar motility and toxin production suggests that these important virulence factors have both advantageous and detrimental effects during the course of infection.


Conflict of interest statement

The authors have declared that no competing interests exist.

Figures

Fig 1
Fig 1. Evidence for DNA inversion at the flagellar switch.
(A) Nucleotide sequences corresponding to the 5’ UTR of the flgB operon from genome sequences available for PCR ribotype 027 strains were aligned using Clustal Omega. Shown are the regions corresponding to the putative flagellar switch and flanking imperfect inverted repeats. For strain BI1 “inverse”, the alignment was repeated after replacing the putative switch with its reverse complement. Identical nucleotides are indicated with blue shading. (B) Diagram of the PCR strategy used to detect the putative flagellar switch orientation. The primer names and sequences used for each strain are listed in the S2 Table. The predicted product sizes are based on R20291 sequence. (C) Orientation-specific PCR products for the flagellar switch from three C. difficile strains representing three ribotypes (R20291, 027, NCBI Accession No FN545816.1; ATCC43598, 017, NCBI sequence read archive SRX656590 [115]; 630Δerm, 012, NCBI Accession No. EMBL:LN614756 [116]).
Fig 2
Fig 2. Enrichment for flagellar phase variant populations.
(A) Diagram of the asymmetric PCR-digestion method used to determine the proportions of bacteria in the population with the putative flagellar switch in each orientation. (B) Representative images of C. difficile R20291 colonies after 24 hours of growth, which are circular with smooth edges (left), and after 72 hours of growth, which are rough with filamentous edges (right). (C) Asymmetric PCR-digestion assay showing the proportions of bacteria with the flagellar switch in each orientation within colonies collected every 24 hours for four days. Below each lane is the percentage of the colony population in which the flagellar switch is in the inverse orientation, calculated by comparing relevant band intensities to the total normalized to a standard curve. (D) Quantitative measurements of the percentage of bacteria in each colony with the switch in the inverse orientation over the course of four days, with relevant band intensities normalized to a standard curve (S1 Methods). Each circle represents one of eight biological replicates monitored over time. * p < 0.05, ** p < 0.01 by one-way ANOVA and Dunnett’s multiple comparisons test.
Fig 3
Fig 3. Assessing the purity of enriched populations.
(A, B) Asymmetric PCR-digestion assay of genomic DNA to determine the orientation of the flagellar switch in individual colonies. Bacteria from individual colonies contain the switch predominantly in the published orientation (A) or the inverse orientation (B). Two representatives of each are shown. (C) Quantitative PCR results of the flagellar switch orientation in enriched phase variant populations (published, n = 9; inverse, n = 10). The ΔΔCt method was used to determine the relative DNA copies of the flagellar switch orientation in enriched populations relative to the rpoC gene.
Fig 4
Fig 4. The orientation of the flagellar switch impacts the expression of the downstream flagellar genes.
(A) Asymmetric PCR-digestion assay performed on C. difficile R20291 isolates with the flagellar switch in the published and inverse orientations respectively. (B) qRT-PCR was used to determine the abundance of representative flagellar gene transcripts in isolates with the flagellar switch in the published and inverse orientation. Four independent isolates were tested, and Ct values for each flagellar gene and the codY gene (non-regulated control) were normalized to those of the housekeeping gene rpoC; the published orientation samples were arbitrarily chosen as the reference condition. Shown are the means and standard deviations. * p < 0.05 by t-tests comparing mean transcript abundances between published and inverse samples, n = 4. (C) Visualization of flagella by transmission electron microscopy at 25,000X magnification. Size bars = 1 micron. Representative images of bacterial flagellar switch isolates are shown. Arrowheads indicate flagella. (D) Micrographs of enriched flg ON, flg OFF, and a sigD mutant transformed with the pPflgM::mCherryOpt reporter. Channels used are indicated for each column; the fourth column images are a merge of the DIC, DAPI, and RFP. RFP positive and negative bacteria were visually enumerated relative to the DIC and DAPI channels, and quantifications are shown in S4 Fig. White bars = 10 microns.
Fig 5
Fig 5. Motility medium spatially segregates flagellar phase variant populations.
(A) The motility of C. difficile R20291 flg ON and OFF isolates was evaluated in soft agar medium. A non-motile R20291 sigD mutant was included as a control. (B) The motility of flg ON and OFF isolates was quantified by measuring the diameters every 24 hours for 3 days, and means and standard deviations are shown. * p < 0.05 by t-tests comparing values at each time point. The data are combined from two independent experiments with four biological replicates of each flg phase. (C) At 24, 48 and 72 hours, bacteria were sampled from the center and edges of the growth in the motility assays for flg ON and OFF isolates (top and bottom panels, respectively) and subjected to asymmetric PCR-digestion assays. Black arrows indicate products for the ON orientation; open arrows, the OFF orientation. Shown are representative images from 2 independent experiments, each with two biological replicates of each flg phase.
Fig 6
Fig 6. The orientation of the flagellar switch impacts toxin production.
(A) qRT-PCR was used to determine the abundance of the indicated transcripts in flg ON and OFF isolates of C. difficile R20291. Four independent isolates were tested, and Ct values for each gene were normalized to those of the housekeeping gene rpoC; the flg ON samples were arbitrarily chosen as the reference condition. Shown are means and standard deviations. * p < 0.05 by t-tests comparing mean transcript abundances between flg ON and OFF samples, n = 4. (B) TcdA protein levels in cell lysates of flg ON and OFF isolates were evaluated by western blot. Shown is a representative image for three independent experiments each with at least three replicates of each flg phase. (C) The flg ON and OFF isolates, as well as the sigD mutant control, were grown to stationary phase in TY medium. The supernatants were serially diluted and applied to Vero cells for 24 hours. Cell viability was assessed using the CellTiter Glo assay. Data are combined from two independent experiments each with four replicates of sigD mutant and flg phase variants, and means and standard deviations are shown. ** p < 0.01, *** p < 0.001 by one-way ANOVA comparing the means for each dilution.
Fig 7
Fig 7. The orientation of the flagellar switch controls flagellar gene expression post-transcription initiation.
(A) Diagram of the reporter gene fusions (S1 Methods). The known flgB operon promoter, the Cd1 c-di-GMP riboswitch, and the orientation of the flagellar switch are indicated, if present. (B,C) The fusions in A were integrated into the C. difficile R20291 chromosome (left) or the B. subtilis BS49 chromosome via Tn916 [112]. Alkaline phosphatase (AP) activity was measured as described previously [77]. Means and standard deviations are shown. *** p < 0.001 by one-way ANOVA and Bonferroni’s multiple comparisons test, n = 8. n.s. = not significant. (D) Northern blot detection of the phoZ-containing transcripts from C. difficile R20291 bearing fusions 3 or 4. The full length (FL) transcript of ~2400 nt is indicated. 5S RNA served as the loading control. The image is representative of three biological replicates for each strain.
Fig 8
Fig 8. Identification of the recombinase that mediates inversion of the flagellar switch.
(A,B) Orientation-specific PCR (Fig 1B) assays to identify the conserved recombinase that catalyzes inversion at the flagellar switch from ON to OFF (A) and OFF to ON (B). The gene name or R20291 locus tag numbers for the eight conserved recombinases are shown. A 375 bp product indicates the ON orientation; a 281 bp product indicates the OFF orientation. (C) Orientation-specific PCR for the flagellar switch to determine whether the recV cwpV locked ON and OFF mutants were locked for the flagellar switch. (D) Orientation-specific PCR for the flagellar switch in complemented recV mutants (pPtet::recV) and controls.
Fig 9
Fig 9. Mutation of recV results in phase-locked motility and toxin production.
(A,B) C. difficile strains were assayed for motility in BHIS-0.3% agar. (A) Photographs were taken every 24 hours, and a representative image from 48 hours is shown. (B) Measurements of the diameters of motility were taken at 24, 48 and 72 hours. Shown are means and standard deviations from six biological replicates. ** p < 0.01, *** p < 0.001, by two-way ANOVA and Tukey’s multiple comparison test, comparing to flg ON/pPtet. (C) TcdA protein levels in cell lysates were evaluated by western blot. Shown is a representative image of three independent assays. (B,C) Numbers indicate the strain, as indicated in panel A.

References

    1. Cartman ST, Heap JT, Kuehne SA, Cockayne A, Minton NP. The emergence of “hypervirulence” in Clostridium difficile. Int J Med Microbiol. 2010. August;300(6):387–95. 10.1016/j.ijmm.2010.04.008 - DOI - PubMed
    1. Smits WK, Lyras D, Lacy DB, Wilcox MH, Kuijper EJ. Clostridium difficile infection. Nat Rev Dis Primers. 2016;2:16020 10.1038/nrdp.2016.20 - DOI - PMC - PubMed
    1. Lessa FC, Mu Y, Bamberg WM, Beldavs ZG, Dumyati GK, Dunn JR, et al. Burden of Clostridium difficile infection in the United States. N Engl J Med. 2015. February 26;372(9):825–34. 10.1056/NEJMoa1408913 - DOI - PMC - PubMed
    1. Theriot CM, Young VB. Interactions Between the Gastrointestinal Microbiome and Clostridium difficile. Annu Rev Microbiol. 2015;69:445–61. 10.1146/annurev-micro-091014-104115 - DOI - PMC - PubMed
    1. Merrigan M, Venugopal A, Mallozzi M, Roxas B, Viswanathan VK, Johnson S, et al. Human Hypervirulent Clostridium difficile Strains Exhibit Increased Sporulation as Well as Robust Toxin Production. J Bacteriol. 2010. October 1;192(19):4904–11. 10.1128/JB.00445-10 - DOI - PMC - PubMed

MeSH terms